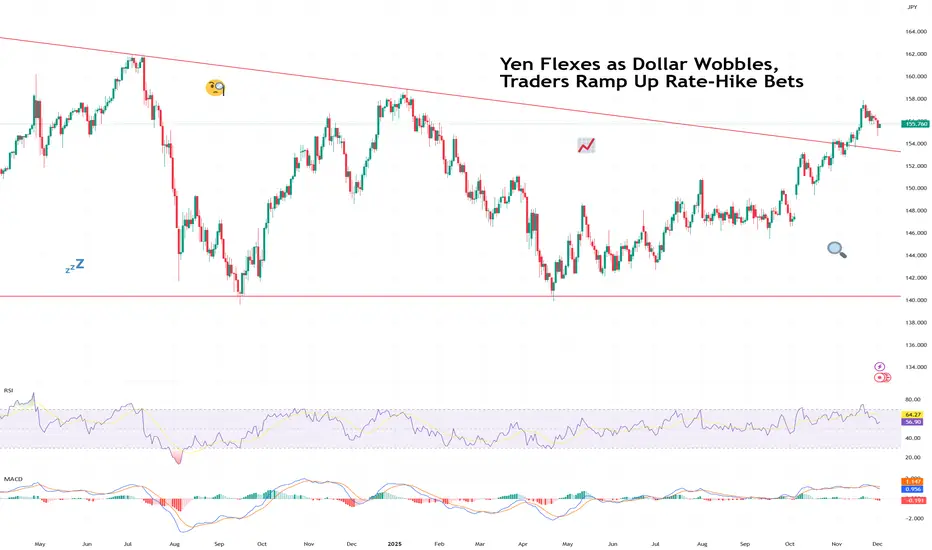
Yen Flexes as Dollar Wobbles, Traders Ramp Up Rate-Hike BetsThe yen came into Monday looking calm… and then proceeded to bench-press the dollar.
The FX:USDJPY pair slid under ¥155, hitting a session low of ¥154.65, after BoJ Governor Kazuo Ueda dropped one of the most powerful phrases in global FX:
“We will weigh the pros and cons of tightening.”
In Tokyo-speak, that’s basically suggesting “rate hike incoming!”
The greenback instantly shed over 100 pips (every day trader’s dream), a half-percent haircut that reminded traders just how exquisitely sensitive the yen is to hints of policy change after 30 years of ultra-loose money.
The next day, however, was a bit different. Early Tuesday morning, the pair gained back about half of what it lost the day before. Still, some things to note about Monday's slide:
It wasn’t just FX that reacted. The yen’s surge:
Knocked the Nikkei FX:JPN225 down 2%,
Pushed Japanese government bond yields to 17-year highs,
And forced traders to reprice Japan’s entire risk landscape in real time.
🕰️ The Market Has Been Waiting for This Moment
FX traders have been staring at the FX:USDJPY for months, waiting for a sign — any sign — that Japan was finally ready to pivot. In the meantime, officials have made a sport out of verbal interventions:
“We are watching FX moves with urgency.”
“We will not tolerate excessive yen weakness.”
“We have tools, and we are not afraid to use them.”
Translation: Stop shorting the yen, it stresses us out.
With Ueda openly weighing a rate hike at the December 19 Bank of Japan meeting, traders are scrambling to unwind one of the most crowded trades in global macro: the “short yen” position.
A country that’s really truly reluctant to raise rates is suddenly hinting at liftoff — or at least a step towards it.
📉 Dollar Wobbles as Macro Crosswinds Build
While Japan is drifting away from negative-rate territory, the US dollar faces a catalyst-packed December that could amplify or counter the yen’s breakout.
Four major US data releases stand between now and the BoJ’s meeting:
Dec 5: Fed’s preferred inflation gauge (PCE)
Dec 10: CPI inflation report
Dec 10: Fed interest-rate decision
Dec 16: Nonfarm payrolls (US jobs report)
If the Fed so much as hums a dovish note, yen strength could accelerate fast.
If Powell surprises with a hawkish tone, the dollar may find a floor.
Either way, this is the first time in years that both sides of the dollar-yen have meaningful rate catalysts.
🔄 A Trend Reversal in the Making?
Big macro traders — the same funds that spent the last year squeezing every drop out of the yen carry trade — are taking profits, reducing leverage, and even tiptoeing into long-yen bets.
When one of the world’s great one-way trades starts wobbling, liquidity thins, and volatility spikes.
This is precisely the environment where this volatile beast can swing 100 pips before your coffee cools.
And if Japan genuinely signals the start of a tightening cycle? Carry unwinds can get violent.
One central bank hint today can become a multi-month trend tomorrow.
🧭 So What Happens Next?
The yen’s flex this week may be just the opening act.
Everything now hinges on:
BoJ clarity on Dec 19
How soft (or not) US inflation comes in
Whether the Fed’s tone shifts on Dec 10
And how the labor market behaves into year-end
Watch the economic calendar and get ready for action. FX volatility is back on the menu.
Now that it’s happening, everyone’s asking the same question:
We’ll leave it to you : Was this a one-day pop — or the start of the yen’s long-awaited comeback tour? Share your views in the comments!
Community ideas
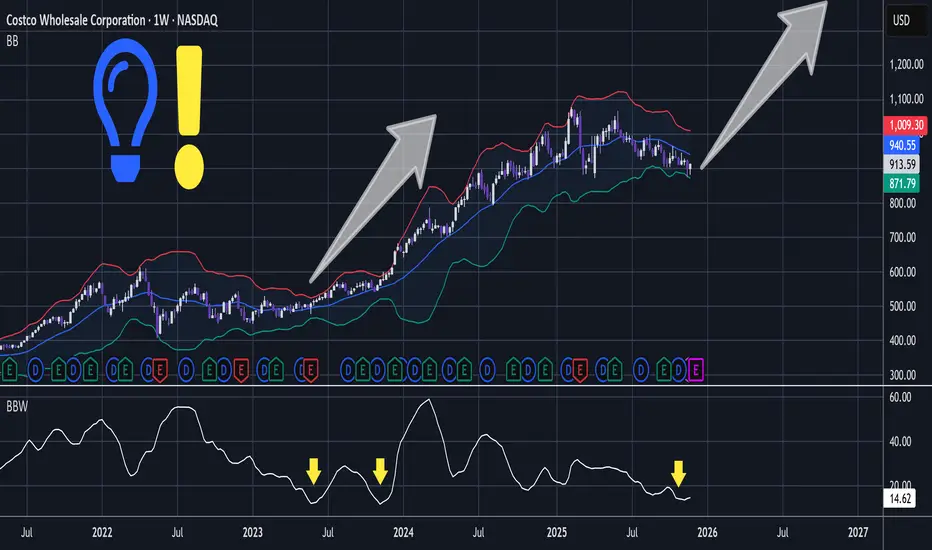
COST - Retail Powerhouse In Ideal HTF PositionShallow compressive action has printed contracting Bollinger Bands.
Notice that the BBW - Bollinger Band Width is similar to the previous correction before breakout.
In lower time frame the significantly sized slump has whipsawed through support and wedge trendline to become a bullish engulf:
This event looks likely to be the 8,9 and 10 slump following the Wyckoff Creek of Schematic 1.
And so I think this bullish wedge can also be considered to be a Wyckoff Creek.
Also similar to the Wyckoff schematic, the Creek comes after a long corrective phase - Costco has been in a choppy sideways correction for about a year.
Costco has a very strong trending history and this sideways passage appears to be building pressure for a breakout into the next major wave up.
I am in position already and have more to buy if it pulls back to support @ $932.29 - from there I will just hold.
So I am giving this ideal technical entry to TradingView 👍.
That said DYOR .
This analysis is shared for educational purposes only and does not constitute financial advice. Please conduct your own research before making any trading decisions.
NVDA vs AVGO: The Battle for the AI Throne Has Begun⚡A New Leader Emerges in the Semiconductors
For years, NVDA was the undisputed titan — the gravitational center of the semiconductor universe.
But now, the geometry tells a different story.
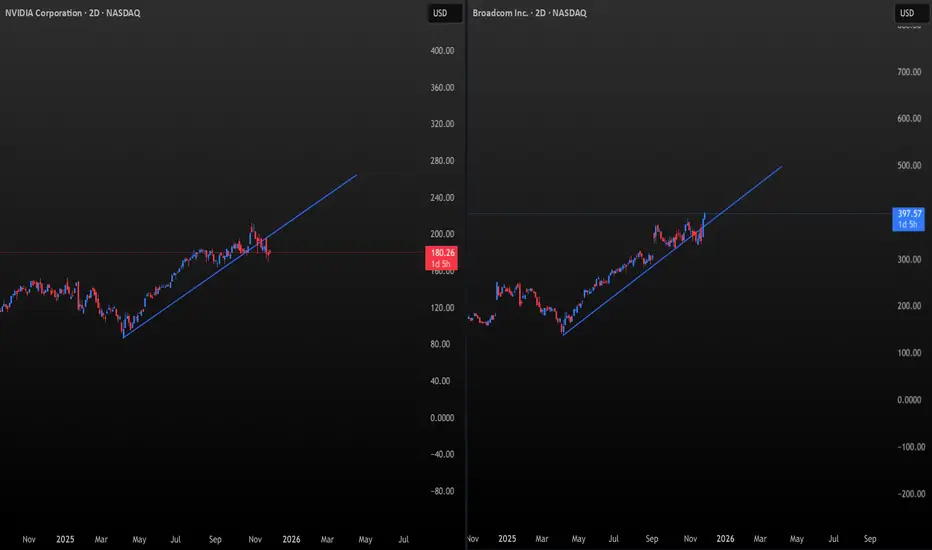
THE CHARTS 📐
Both charts use the same natural scaling:
1° of time = $1 of price per unit.
And here’s the critical observation:
NVDA has broken beneath its 1° angle.
AVGO has recaptured and accelerated above its 1° angle.
AVGO has already made new all-time highs.
During a semiconductor correction.
While SMH was down.
While the S&P 500 retraced.
The real question still remains however, are we still in the early innings of the AI Boom?
SMH — The Semiconductor Supercycle Update
The Structure That Defines the AI Era🏛️
The 2023–2027 channel is the master structure for this entire semiconductor cycle.
SMH bounced precisely where the primary and secondary angles intersect.
🚀 Market Knots — Speed & Acceleration Confirm the Turn
Speed found support precisely at the median line around 126 Market Knots — the natural mid-energy band where major long-term advances restart.
Acceleration appears to have:
🔻spiked,
📉bottomed, and
is now curling upward.
Poised to turn positive
The measurements point to a weekly bottom and another wave higher in this semiconductor cycle fueled by AI growth.
The Leadership Rotation🏅 (The Baton Moment)
AVGO is emerging as the structural leader of the AI supercycle.
It has already demonstrated exceptional strength:
holding its 1° angle, breaking into new all-time highs, and accelerating while the rest of the semiconductor sector underperformed.
This behavior is not random.
It reflects Broadcom’s unique position at the infrastructure core of AI — the networking, switching, optical, and custom ASIC layer that becomes the bottleneck after GPUs.
As the semiconductor supercycle builds, AVGO steps forward as the defining leader of the AI boom
SPX to Money Supply WARNING!If the charts aren’t showing bubble setups, I’m not going to invent them. I post what the data shows. So please don’t shoot the messenger when I say GTFO & STFO.
And just to keep the facts straight:
Brokerage, stock, and crypto accounts are not part of M2.
Why does M2 matter?
It’s the actual spendable money in the economy.
When M2 grows faster than real output (as it did in 2021), price pressure builds.
The economy runs on liquidity.
Retail, goods, services all of it requires money you can actually spend, not paper gains in a trading account.
When the S&P 500 disconnects massively from M2 — like during the dot-com bubble — revenue and profit growth can’t keep pace. Valuations expand purely on speculation, not on real, organic fundamentals. That’s how multiples stretch and bubbles form.
The problem? Most retail traders have no idea this is happening. They’re trading with their hair on fire, following cute social-media stories dressed up as “analysis,” using strategies that have never been tested in real markets.
And that’s exactly how bubbles are fed:
big players sell into retail euphoria, and retail ends up holding the bag of schitt!
Buy when stocks are cheap, not at all-time highs in euphoria land.
"Price is what you payt, VALUE is what you get!"
THANK YOU for getting me to 5,000 followers! 🙏🔥
Let’s keep climbing.
If you enjoy the work:
👉 Drop a solid comment
Let’s push it to 6,000 and keep building a community grounded in truth, not hype.

Internal vs External Liquidity: The Skill Nobody Actually MasterMost traders think they understand liquidity…
They mark equal highs, equal lows, and call it a day.
But let me tell you something real:
Knowing liquidity exists is NOT the skill.
Knowing WHICH liquidity matters right now is the real edge.
That’s the difference between:
✔ catching continuations
✔ catching reversals
✔ avoiding trap entries
✔ timing precision entries
✔ and actually staying in profitable moves
Most traders lose because they don’t understand the hierarchy of liquidity.
Let me break this down the way nobody online does:
⸻
🔥 1. Internal Liquidity = Fuel for Continuation
This is the liquidity inside the active range.
It sits between swing points, inside consolidation, above minor highs, below short-term lows.
Internal liquidity gets taken when:
• Market is in trend
• Price is compressing
• Price is building inducement
• Algorithms are collecting “fuel” before delivery
When internal gets swept, DO NOT expect a reversal.
Expect a continuation into the next external pool.
This is why most traders get faked out:
They see a sweep and scream “reversal!”
But they’re reacting to internal liquidity — not the real turning point.
⸻
🔥🔥 2. External Liquidity = The Real Reversal Zones
External liquidity sits at the RANGE BOUNDARIES:
• The major swing high
• The major swing low
• The extreme points of the structure
These are the levels that actually SHIFT trend, cause deep pullbacks, or start major legs.
This is where smart money:
✔ Clears the crowd
✔ Triggers stops
✔ Closes positions
✔ Repositions
✔ Begins delivery in the opposite direction
External liquidity is the turning point.
Internal liquidity is just the build-up.
If you can’t distinguish the two, every reversal will feel random to you.
⸻
🔥🔥🔥 3. Here’s the Rule Nobody Teaches:
If price sweeps internal → expect continuation.
If price sweeps external → expect correction or reversal.
But here’s where MOST traders fail:
They don’t know which one they’re looking at.
If you think a reversal is starting but you’re still inside the range…
You’re not trading a reversal.
You’re trading hopium.
⸻
🔥🔥🔥🔥 4. How Smart Money Chooses Which Liquidity to Target First
This is where your real edge comes in.
Smart money asks ONE question:
“Which pool unlocks the next delivery path?”
If the next objective is above → they’ll sweep internal lows to build power.
If the next objective is below → they’ll sweep internal highs to induce buyers.
Smart money is always targeting what unlocks:
✨ the cleanest path
✨ the imbalanced leg
✨ the untouched zone
✨ the unmitigated order block
✨ the next HTF objective
You think the sweep is the entry.
They see the sweep as the setup.
⸻
🔥🔥🔥🔥🔥 5. Here’s the TRUTH:
Internal liquidity fuels the move.
External liquidity flips the move.
If you master this one skill, your whole trading shifts.
Your confidence shifts.
Your timing shifts.
Your strike rate shifts.
You stop chasing noise.
You stop guessing bottoms.
You stop guessing tops.
You start reading intention — not reacting to candles.
Most of the trading world knows liquidity.
Almost nobody knows when liquidity actually matters.
That’s the part the textbooks don’t teach.
That’s the part the YouTubers don’t show.
That’s why most traders stay confused for years.
Internal liquidity gets you in —
External liquidity gets you paid.
Master the difference and you’ll trade with precision most people only dream of.

Stocks Stage Comeback in Time for Thanksgiving. What's Behind ItIt’s Thanksgiving, and you know what that means. “Hey, sweety, why don't you come here and let us know how your high-beta stocks are doing. Here’s our little investor.”
And for once, the answer isn’t followed by a sigh. Stock traders are heading into the holiday with something they haven’t had in a while — gains and optimism.
Major US indices just logged their fourth straight day of gains, with the Nasdaq Composite on pace for its best Thanksgiving week since 2008.
That’s right: the last time the Nasdaq had a holiday rally this strong, we were still explaining what a “smartphone” was.
This year, it’s all about two things:
A dovish Federal Reserve
An AI trade that refuses to sit idle
Let’s carve into what’s driving this seasonal sprint.
📈 AI Fears Cool Off
The market has spent the past month wrestling with fears that AI stocks were puffing up like an overfilled Thanksgiving parade balloon. But this week, the anxiety faded.
Microsoft NASDAQ:MSFT , CoreWeave NASDAQ:CRWV , Dell NYSE:DELL , and even suddenly-revived AI-adjacent names have found solid footing again. The Nasdaq TVC:IXIC jumped 0.8% on Wednesday, outpacing the other indices and reminding investors that tech still runs this town.
What changed?
No new AI scandals and bubble talk
No shocking spending pivots (thanks, Meta NASDAQ:META )
No high-profile shorts announcing apocalyptic bets (thanks, Burry)
And some great data-center guidance in recent earnings ( thanks, Dell NYSE:DELL )
Even Nvidia NASDAQ:NVDA , which has been under the most scrutiny , clawed back 1.4% Wednesday — though the stock is still well off its early-month peak.
Investors are clearly reshuffling their AI winners, but the trade lives on. A shakeout doesn’t mean a shutdown.
🟩 Breadth Returns: Not Just a Tech Party
All but two sectors of the S&P 500 SP:SPX moved higher Wednesday, pushing the broader index up 0.7%.
The Dow TVC:DJI matched that performance, rising 315 points, with both indices tracking for their best Thanksgiving week since 2012.
Even the defensive sectors joined in. When utilities and consumer staples start partying with semiconductors and mega-cap tech, you know sentiment’s shifting.
🏦 The Fed Is Quietly Setting the Table
Just a week ago, the odds of a December rate cut were a coin toss — roughly 50/50 according to CME FedWatch. Today, that probability has surged to more than 80%.
What a cut could mean to traders:
Cheaper borrowing
Higher valuations
Softer financial conditions
And fewer landmines in the months ahead
Nothing gets markets into the holiday spirit like the smell of potential rate cuts.
This week is also shortened — stock markets are closed Thursday and shut early Friday (ref: the economic calendar ). With fewer trading hours to log, investors often front-load their optimism or their panic. This time, it’s mostly optimism.
🔄 Nvidia Isn’t Gone — It’s Just Taking a Breath
Nvidia’s stock remains sharply lower from its early November highs, but Wednesday’s move showed there’s still life in the AI leader.
Meta NASDAQ:META , Alphabet NASDAQ:GOOGL , and select cloud names have picked up flows as traders diversify their AI bets.
And while Nvidia might not be the main driver of the rally this week (spoiler alert: it’s Google ), its ability to stay positive helped prevent any emotional selling from spreading through tech.
🧁 The Warm, Lightly-Toasted Takeaway
If you were expecting a quiet, uneventful lead-in to the holidays — the market apparently had other plans.
Here’s where we’re at now:
A four-day winning streak,
A revival in Big Tech,
A broad rally across sectors,
And Fed expectations suddenly swinging toward cuts.
Off to you : Will it last through December? With inflation, rate decision, and jobs data, will AI stocks keep marching higher or retreat? Share your view in the comments and, to our US folks, enjoy Thanksgiving!

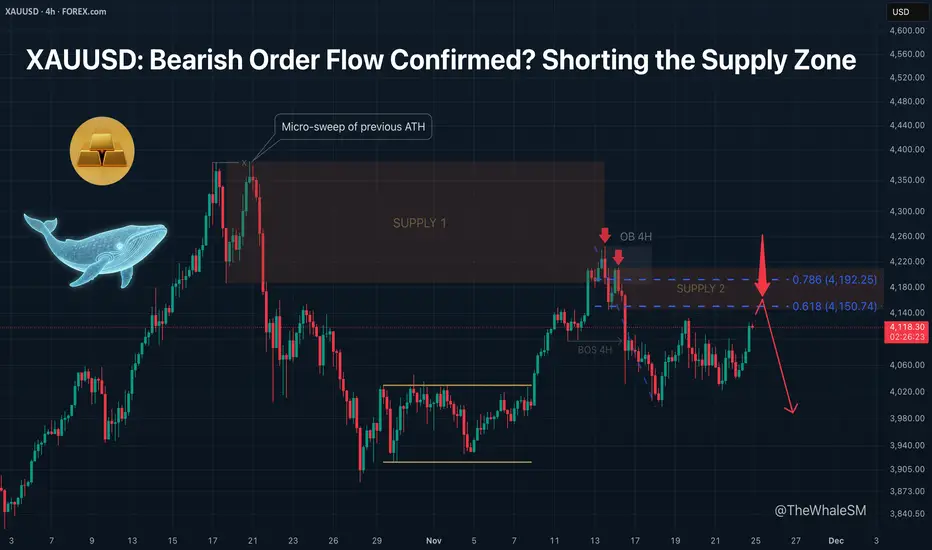
XAUUSD: Bearish Order Flow Confirmed? Shorting the Supply Zone.After updating the All-Time High (ATH), Gold performed a micro-sweep of liquidity from the previous ATH. This move was engineered via a Supply Zone . Following the sweep, this zone was mitigated, initiating a bearish order flow that broke the 4H structure to the downside (BOS 4H).
After the structural break, the price began approaching a second Supply Zone . A reversal is possible from this area to continue the bearish order flow, targeting an update of the structural low at $4000 . A full break of this low would indicate a high probability of a deeper correction on the higher timeframe.
✅ Short Setup Conditions:
Aside from the mitigation of the Supply Zone, I am looking for a reversal reaction from the 61.8% Fibonacci retracement level . The price must find acceptance below this level upon reaching it.
❌ Invalidation:
The short scenario is invalidated if the 61.8% level is broken. In that case, Gold will face further resistance at the 78.6% Fib level , but forming a short setup there is less probable than from the 61.8%.
~~~~~~~~~~~~~~~~~~~~~~~~~~~~~~~~~~~~~~~~~~~~~~~~~~~~~~~~~~~~~~~~~
The principles and conditions for forming the manipulation zones I show in this trade idea are detailed in my educational publication, which was chosen by TradingView for the "Editor's Picks" category and received a huge amount of positive feedback from this insightful trading community. To better understand the logic I've used here and the general principles of price movement in most markets from the perspective of institutional capital, I highly recommend checking out this guide if you haven't already. 👇
P.S. This is not a prediction of the exact price direction. It is a description of high-probability setups that become valid only if specific conditions are met when the price reaches the marked POI. If the conditions are not met, the setups are invalid. No setup has a 100% success rate, so if you decide to use this trade idea, always apply a stop-loss and proper risk management. Trade smart.
~~~~~~~~~~~~~~~~~~~~~~~~~~~~~~~~~~~~~~~~~~~~~~~~~~~~~~~~~~~~~~~~~
If you found this analysis helpful, support it with a Boost! 🚀
Have a question or your own view on this idea? Share it in the comments. 💬
► Follow me on TradingView for timely updates on THIS idea (entry, targets & live trade management) and not to miss my next detailed breakdown.
~~~~~~~~~~~~~~~~~~~~~~~~~~~~~~~~~~~~~~~~~~~~~~~~~~~~~~~~~~~~~~~~~
ETHUSD H1 | Bullish Bounce Off Key SupportMomentum: Bullish
Price is currently above the ichimoku cloud.
Buy entry: 2,867.08
- Pullback support
- 61.8% Fib retracement
- 100% Fib projection
Stop Loss: 2,777.16
- Overlap support
Take Profit: 2,972.69
- Swing high resistance
High Risk Investment Warning
Stratos Markets Limited (tradu.com/uk ), Stratos Europe Ltd (tradu.com/eu ):
CFDs are complex instruments and come with a high risk of losing money rapidly due to leverage. 70% of retail investor accounts lose money when trading CFDs with this provider. You should consider whether you understand how CFDs work and whether you can afford to take the high risk of losing your money.
Stratos Global LLC (tradu.com/en ): Losses can exceed deposits.
Please be advised that the information presented on TradingView is provided to Tradu (‘Company’, ‘we’) by a third-party provider (‘TFA Global Pte Ltd’). Please be reminded that you are solely responsible for the trading decisions on your account. Any information and/or content is intended entirely for research, educational and informational purposes only and does not constitute investment or consultation advice or investment strategy. The information is not tailored to the investment needs of any specific person and therefore does not involve a consideration of any of the investment objectives, financial situation or needs of any viewer that may receive it. Past performance is not a reliable indicator of future results. Actual results may differ materially from those anticipated in forward-looking or past performance statements. We assume no liability as to the accuracy or completeness of any of the information and/or content provided herein and the Company cannot be held responsible for any omission, mistake nor for any loss or damage including without limitation to any loss of profit which may arise from reliance on any information supplied by TFA Global Pte Ltd.

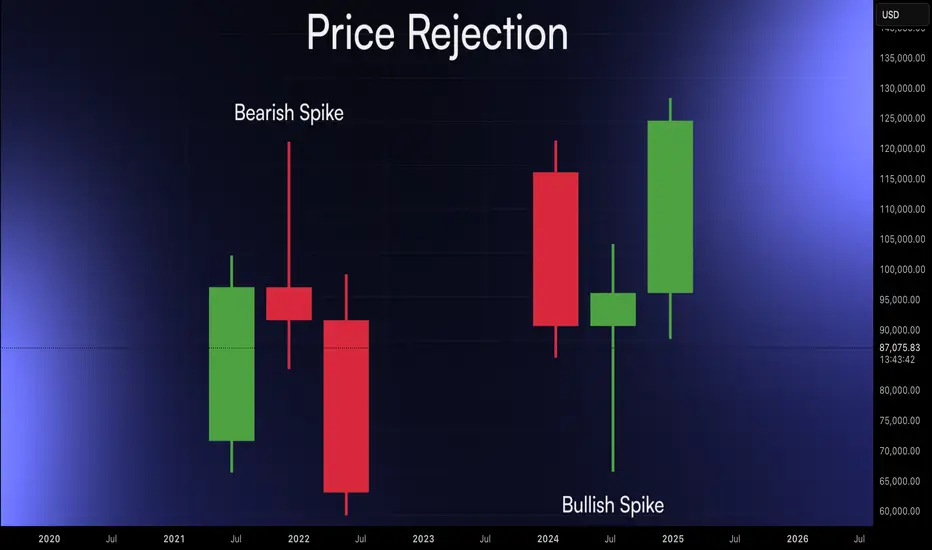
Candlestick Patterns That Actually MatterTraders often approach candlestick patterns by memorizing long lists instead of understanding the behaviour behind them. Crypto moves aggressively, hunts liquidity, and punishes textbook interpretations unless they occur at meaningful locations. The goal is not pattern collection. The goal is to recognize the few formations that consistently reveal intention when aligned with structure, liquidity, and context.
Engulfing Candles, Displacement and Control
What it shows: a clear shift where one side fully absorbs the other. This is participation, not random volatility.
When it matters: after impulses, at support or resistance, during liquidity sweeps, or when confirming a trend shift.
Why it’s valuable: engulfing candles often provide the first structural evidence that control has changed hands.
Rejection Wicks, Liquidity Taken, Pressure Reverses
What it shows: price tapped a high or low, triggered stops, and immediately met stronger opposing orders. This is how sweeps appear on a single candle.
When it matters: at equal highs/lows, session extremes, failed breakouts, and major swing points.
Why it’s valuable: wicks expose trapped traders and reveal where true supply or demand sits. They are early indicators of shifting intent.
Inside and Outside Bars, Compression and Expansion
Inside Bar: compression, tighter ranges, and reduced volatility ahead of expansion.
Outside Bar: immediate expansion where one side overwhelms both directions.
When they matter: at key levels before breakouts, during corrective legs, at consolidation boundaries, and after liquidity events.
Why they’re valuable: inside bars show preparation; outside bars show decision.
Treat these signals as behavioural information. Their value increases when combined with higher timeframe structure, liquidity mapping, momentum, volume, and session context.
How to Trade with MACD in TradingViewMaster the MACD indicator using TradingView’s charting tools in this comprehensive tutorial from Optimus Futures.
The Moving Average Convergence Divergence (MACD) is a momentum and trend-following indicator that helps traders identify shifts in market direction and momentum strength. It measures the relationship between two exponential moving averages (EMAs) to reveal when momentum may be building or fading.
What You’ll Learn:
Understanding MACD as a tool that tracks the convergence and divergence of moving averages
How the MACD line is calculated as the difference between the 12-period and 26-period EMAs
How the Signal line acts as a 9-period EMA of the MACD line and serves as a trigger for potential buy or sell signals
How the Histogram visualizes the distance between the MACD line and Signal line to show momentum strength
Recognizing bullish and bearish crossovers between the MACD and Signal lines
How to interpret the Zero Line as a momentum baseline — above zero suggests an uptrend, below zero suggests a downtrend
Identifying bullish and bearish divergences between MACD and price to anticipate potential reversals
Why crossovers and divergences should be confirmed with price action and trend structure, not used in isolation
How to add MACD to a TradingView chart via the Indicators menu
Understanding the default settings (12, 26, 9) and how adjusting them changes responsiveness
Practical examples on the E-mini S&P 500 futures chart to illustrate MACD signals in real market conditions
Applying MACD across multiple timeframes — daily, weekly, or intraday — for higher-confidence confirmations
This tutorial will benefit futures traders, swing traders, and technical analysts who want to incorporate MACD into their trading process.
The concepts covered may help you identify trend changes, momentum shifts, and potential entry or exit points across different markets and timeframes.
Learn more about futures trading with TradingView:
optimusfutures.com
Disclaimer
There is a substantial risk of loss in futures trading. Past performance is not indicative of future results. Please trade only with risk capital. We are not responsible for any third-party links, comments, or content shared on TradingView. Any opinions, links, or messages posted by users on TradingView do not represent our views or recommendations. Please exercise your own judgment and due diligence when engaging with any external content or user commentary.
This video represents the opinion of Optimus Futures and is intended for educational purposes only.
Chart interpretations are presented solely to illustrate objective technical concepts and should not be viewed as predictive of future market behavior. In our opinion, charts are analytical tools — not forecasting instruments.

NZDUSD downtrend continuation below falling resistanceThe NZDUSD currency pair continues to display a bearish outlook, in line with the prevailing downward trend. Recent price action suggests a corrective pullback, potentially setting up for another move lower if resistance holds.
Key Level: 0.5675
This zone, previously a consolidation area, now acts as a significant resistance level.
Bearish Scenario (rejection at 0.5675):
A failed test and rejection at 0.5675 would likely resume the bearish momentum.
Downside targets include:
0.5565 – Initial support
0.5540 – Intermediate support
0.5520 – Longer-term support level
Bullish Scenario (breakout above 0.5675):
A confirmed breakout and daily close above 0.5675 would invalidate the bearish setup.
In that case, potential upside resistance levels are:
0.5695 – First resistance
0.5715 – Further upside target
Conclusion
NZDUSD remains under bearish pressure, with the 0.5675 level acting as a key inflection point. As long as price remains below this level, the bias favours further downside. Traders should watch for price confirmation around that level to assess the next move.
This communication is for informational purposes only and should not be viewed as any form of recommendation as to a particular course of action or as investment advice. It is not intended as an offer or solicitation for the purchase or sale of any financial instrument or as an official confirmation of any transaction. Opinions, estimates and assumptions expressed herein are made as of the date of this communication and are subject to change without notice. This communication has been prepared based upon information, including market prices, data and other information, believed to be reliable; however, Trade Nation does not warrant its completeness or accuracy. All market prices and market data contained in or attached to this communication are indicative and subject to change without notice.

Your Playbook for Deep Corrections: Top Seven Things to KnowEvery trader hopes that whatever is happening with any pullback is healthy. “Just a healthy retreat, it’ll go back, it always does. R-r-right?”
While that’s true (obviously, markets had always shot up to records after deep losses), your job is to survive that lower leg and ideally come out stronger than before.
Because sometimes the market doesn’t correct immediately. It drops, turns around, drops some more and doesn’t ask you how you’re doing.
Where are we in the valuation cycle now? In the “Is this AI thing a bubble” talks.
With stocks stretched, AI valuations orbiting Saturn, and Nvidia NASDAQ:NVDA dictating the market’s fate, investors are starting to ask: What happens if this thing unwinds… fast?
A deep correction shakes your portfolio like nothing else, ultimately putting your strategy (and sanity) to a test. That's why you must know how to deal with correction ( if when it comes).
Here’s your playbook. Seven things every trader should know when markets get serious.
⚡️ 1. Know What’s Driving the Tempo
Right now, the tempo-setter isn't in the economic calendar (but good to keep an eye on it). It's not gold, the US dollar, oil prices, or consumer sentiment.
It’s Nvidia NASDAQ:NVDA
The stock has shot to stratospheric levels, climbing with such force that the entire market now reacts to its every earnings forecast, capex comment, and Jensen Huang metaphor about the "virtuous cycle of AI.”
When a single company starts steering the market’s mood, you know the stakes are high. Nvidia’s rise has been spectacular. Its potential fall could also be spectacular.
If there’s a crash in the current market, undoubtedly tech goes first, and AI-tied shares are poised to lead the plunge. Not because the companies are bad, but because valuations are sky-high, crowded, and pumped by shady-looking multi-billion-dollar deals.
🧨 2. Sky-High Valuations Fall the Hardest
AI has been the market’s darling. And like any hot market corner, the exit door gets crowded when the music stops.
These stocks work great in a liquidity-rich, momentum-heavy environment. But in a deep correction, they can drop first and fastest.
Why?
They’re relatively expensive.
They’re owned by institutions (by boatloads).
They’re deeply intertwined with leverage.
When selling starts, it spreads: chips, software, cloud. Really anything with “AI initiative” mentioned in the last five earnings calls.
If the correction deepens, correlations go to 1 , and “diversification” starts to feel like a theoretical concept.
🧺 3. Staples Can Survive. But Aren’t Safe.
What tends to hold up in a downturn?
Companies that produce things people buy every day.
Coca-Cola NYSE:KO , Procter & Gamble NYSE:PG , Walmart NYSE:WMT , Costco NASDAQ:COST . These are the boring giants who don’t need AI hype to sell toothpaste, detergent, and caffeine.
But here’s the catch.
When tech crashes, fund managers don’t just sell tech.
They sell everything with liquidity to buy the tech names they've been waiting to own at a discount.
That includes consumer staples. Even the defensive darlings can get dumped to fund someone’s impulsive “NVDA is finally cheap!” moment.
🧭 4. Corrections Have Phases. Know Which One You’re In.
Corrections tend to move in waves:
Denial: “This is just a dip.”
Realization: “This is not a dip.”
Capitulation: “Sell everything.”
Bargain hunting: “Wait… everything is on sale.”
Recovery: “We survived. Buy up!”
Don’t confuse early weakness with late-stage panic.
Ideally, you want to buy when everyone else is emotionally unavailable, not when they’re still debating if it’s a pullback or an opportunity.
📊 5. Liquidity Matters More Than Fundamentals
In a deep correction, fundamentals usually take a backseat.
Everything becomes about liquidity.
Who needs cash?
Who has margin calls?
Who needs to rotate?
Which institutions need to de-risk?
This is why great companies drop alongside mediocre ones.
Liquidity can trump logic.
Market structure can trump valuation.
And algos don’t care that you really like that stock long-term.
🧘♂️ 6. Your Mindset Is a Position Too
Corrections can provoke every trading impulse, especially if they're steep and you expect a quick rebound:
Revenge trades
Over-leveraged dip buying
Premature bottom-calling
The hardest thing during a deep correction isn’t predicting the bottom, but not losing your head (and cash) before the bottom arrives.
Pro traders work with a few rules that help them avoid emotional decision making:
Pre-set drawdown limits
Scaling entries
Non-negotiable stop-losses
Portfolio hedges
Cash as an asset
If you don’t have a playbook before the drop, you’ll be writing one during the drop.
🛒 7. Buy the Best, Not the Loudest
When markets crack, everything goes on sale, everyone knows that.
Before you go bargain hunting and deep discount shopping, prioritize:
Cash-generating giants
Companies with pricing power (and moat)
Firms selling essentials in whatever industry
Businesses that don’t rely on hype to survive
🧾 The Takeaway
A deep correction may not be the end of the world, but it could be the market’s way of redistributing opportunity.
Nvidia and the AI titans have been running the show. And they’ll likely lead any sharp selloff.
And yes, even your safe, boring consumer staples can get dragged into the downside.
But corrections create clarity. They separate narrative from value, hype from durability, and momentum from substance.
If you stay disciplined, patient, and unemotional, a correction becomes less of a threat and more of a roadmap, pointing you toward assets worth owning when the next bull run begins.
Off to you : What’s your take on the current market situation? Do you see a bubble in the works, ready to go pop? Or it’s all looking fine and dandy, no reason for caution?

PYPL USPayPal is a rare combination of value and growth.
The company demonstrates strong fundamentals, is strategically focused on the future, and trades at record-low multiples. The combination of financial discipline, capital return, and AI innovation makes it an attractive asset for long-term investors.
The most recent quarter confirmed the resilience of PayPal's business model.
Revenue: $8.42 billion (+7% y-o-y).
Adjusted earnings per share: $1.34, exceeding analyst expectations by $0.14.
Total payment volume (TPV): $458 billion (+8% y-o-y), demonstrating the platform's scale and activity.
Free cash flow (FCF): $2.3 billion for the quarter, and the FCF margin increased 7 percentage points to 27%. This demonstrates high efficiency and the ability to generate cash.
Key Growth Drivers
Paypal isn't dependent on a single product, but is developing several promising areas.
Venmo: The main growth driver. Revenue accelerated to +14% year-on-year. The service is not only growing, but also becoming more profitable.
Buy Now, Pay Later (BNPL): Growing by more than 20% annually, in line with changing consumer behavior.
Upward Guidance: Management raised its adjusted EPS guidance for 2025 to $5.35-$5.39, implying growth of 15-16% year-on-year.
Partnership with OpenAI
This isn't just marketing, but a strategic bet on the future of commerce.
Bottom Line: PayPal is becoming the default payment infrastructure within ChatGPT. Users can instantly transition from searching for a product through an AI-powered conversation to paying with PayPal without leaving the chat.
Meaning:
For PayPal: A new, massive sales channel—"AI commerce" (agentic commerce)—is opening. The company is becoming a "commerce bus" between millions of its merchants and AI users.
For merchants: They automatically gain access to the ChatGPT storefront without the need for complex integration.
For OpenAI: ChatGPT is evolving from an assistant into a full-fledged commerce platform.
The company declared its first-ever dividend of $0.14 per share.
There is also a $6 billion annual buyback program. Shares have declined by 6.25% over the past year.
The "Dividend + Buyback" combination is a powerful signal that the company believes its shares are undervalued.
Historically low valuation
This is a key element of the investment thesis. The market completely ignores positive developments.
Multiples: PayPal trades at only ~12x expected 2026 earnings. This is lower than many less profitable fintech competitors (SoFi, Block).
The investor is paying a price that assumes a complete lack of future growth, while the company is showing double-digit profit growth, generating record cash flow, and building the business of the future.
From a technical analysis perspective , we are in the accumulation zone.
The price is near an uptrend line.
The RSI also signals divergence🌎

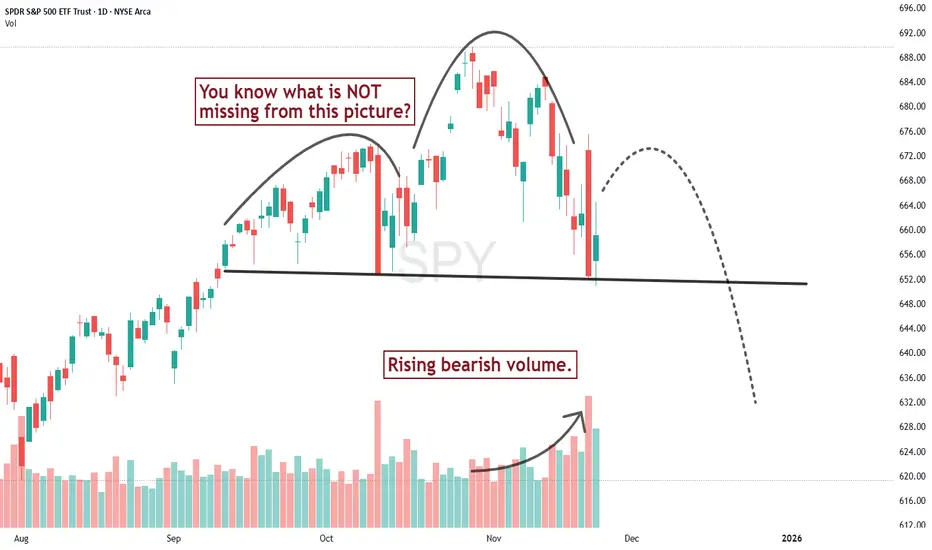
Oh what a difference a day makes!A couple days ago I thought there wasn't sufficient price pattern evidence to talk about a serious change in trend for the S&P 500, mostly because I didn't see the volume pattern confirming the downward slide of the recent high. But Thursday changed that. Redrawing the neckline, we get a chart that looks more like the textbooks drew it up.
Will the next swing high lead to a serious acceleration of downward trending prices? If so hold on tight, it could be a BIG drop.
Why This Time Is Not Different — BTC Could Still Drop >50%Bitcoin is moving into a phase where long-term cycles matter more than whatever the market narrative happens to be this week.
And if you look at those cycles, one thing becomes clear: BTC has never avoided a major drop after making a new ATH.
1. The timing keeps repeating — almost to the day
Every big drawdown in Bitcoin’s history has lasted almost exactly the same amount of time:
Cycle 1: 371 days
Cycle 2: 378 days
Cycle 3: 378 days again
That kind of symmetry doesn’t happen by accident.
It’s a pattern driven by liquidity, leverage, miner economics and investor behavior.
Right now, BINANCE:BTCUSDT is lining up with that same timing structure once more.
2. The size of corrections is falling… but still huge
Past drawdowns:
–83%
–77%
The market is more mature now — more liquidity, more derivatives depth, more institutional money — so the volatility is naturally lower.
But “lower volatility” in Bitcoin still means:
👉 –50% to –70% corrections
And a drop in that range would land BTC somewhere around $40k–$50k, which is consistent with the historical pattern.
3. Market maturity doesn’t erase Bitcoin’s cycles
Even with ETFs, institutional flows, and a stronger market structure, BTC still reacts to:
leverage resets
liquidity tightening
miner selling pressure
sentiment washouts
These things don’t disappear just because the market grows.
4. What the full cycle is pointing to
If the cycle keeps rhyming with the past:
Potential bottom: roughly late 2026, at the end of another ~370–380 day drawdown
Next peak: around 2028
Long-term target: $120k–$150k+
The rhythm remains the same:
big drop → long consolidation → explosive recovery.
Takeaway
This time isn’t different.
Even in a more “institutional” Bitcoin, the cycles still point to a >50% reset before the next major expansion.

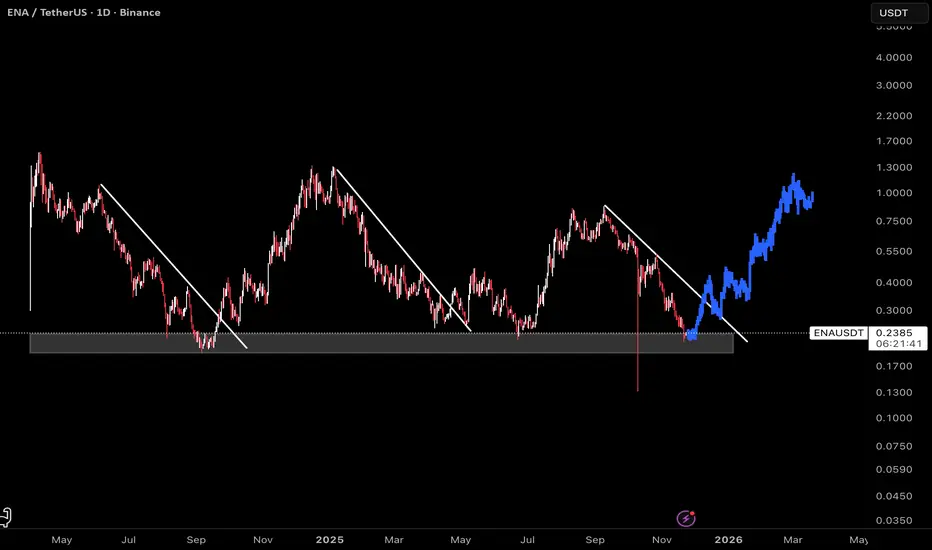
ENA: Bullish SetupThis chart displays ENA on a daily timeframe, with clear structure pointing to a favorable long entry. The current price action is trading within a major support zone, where previous trendline breaks have consistently marked the start of impulsive moves.
Historically, every time ENA breaks out above the descending trendline, the asset tends to retest the breakout level before accelerating higher.
A blue fractal shows past price evolution from October last year, highlighting the repeatable bullish pattern as price reverses trend, retests the breakout, and rallies to new highs.
As always, use prudent position sizing and stop-losses, particularly if support fails to hold.
This bullish setup is most likely to play out if the FED decides to cut interest rates in December.
It could serve as a strong macro catalyst to support the pattern shown here. Thus, watch for confirmation from the Fed policy easing may power the next leg up for ENA and similar assets.
Analysis for What’s Coming - AI Bubble Sentiment The US markets have been described as “on a rally” for quite some time. I would not agree if it is meant to describe the overall US market, but would agree if it refers specifically to AI or tech stocks. Why?
Among the four major US indices, the Russell—representing a much broader base of US-listed companies—continues to struggle to break above its high from last year, even though the others have far surpassed it. In fact, it has since corrected by 9.5% since its all-time high just last month.
After that, the other indices are also following suit only in the past few days, breaking below this uptrend that started in April.
Micro E-mini Russell 2000 Index
Ticker: M2K
Minimum fluctuation:
0.10 index points = $0.50
Disclaimer:
• What presented here is not a recommendation, please consult your licensed broker.
• Our mission is to create lateral thinking skills for every investor and trader, knowing when to take a calculated risk with market uncertainty and a bolder risk when opportunity arises.
CME Real-time Market Data help identify trading set-ups in real-time and express my market views. If you have futures in your trading portfolio, you can check out on CME Group data plans available that suit your trading needs www.tradingview.com

Nvidia Earnings Finally Ease Market Jitters. Are AI Bulls Back?It’s confirmed. This is Nvidia’s stock market and we all live in it.
Nvidia NASDAQ:NVDA reported yet another record-breaking quarter, instantly soothing market nerves after a week filled with talks of “AI bubble,” “valuation fever,” and “maybe Michael Burry is right again.” It was the cherry of the earnings season .
The chipmaking giant announced $57 billion in sales during the most recent quarter.
The figure is up 62% year-over-year and way above estimates. In other words, Nvidia didn’t just calm the market. It kicked the door open and shouted: “Get in losers, we’re going shopping.”
CEO Jensen Huang was even more enthusiastic, declaring that “AI is going everywhere, doing everything, all at once.” In classic Huang fashion, you could almost smell the leather jacket.
💽 Data Center Demand: Still Insatiable
Let’s cut to the headline number: $51.2 billion in data-center revenue. Analysts expected $49 billion. Nvidia delivered more.
The company’s new Blackwell GPUs, described by Huang as “off the charts” when it comes to demand, continue to fly off the production line the moment they’re made.
Quarterly net income hit a whopping $31.9 billion, up 65% from the year prior. At a time when most companies celebrate single-digit percentage growth, Nvidia is casually stacking double and triple digits.
📈 Markets Exhale, Futures Soar
The relief was immediate and widespread. You could say that Nvidia’s earnings are not just earnings anymore, but a macro signal.
Here’s what the picture looked like after the release:
CoreWeave NASDAQ:CRWV jumped 10%
Futures tied to the Nasdaq NASDAQ:IXIC climbed 2%
Every Magnificent Seven stock flashing green
Investors had been waiting for confirmation that the AI boom still had room. And Nvidia delivered enough reassurance to light up the entire tech complex.
“Okay. Maybe we don’t need to rotate into utilities just yet,” every tech bro, probably.
😬 The Stakes Were High. Really High.
The reaction, though, must be taken within the current context. Over the past few weeks, tech stocks were hit by deep selloffs as markets fretted over the same question: “Is AI too expensive?”
Between skyrocketing capital expenditures, absurdly ambitious data-center budgets, and the kind of spending plans that would make even sovereign wealth funds blush, investors wondered whether Big Tech was building an AI future or an AI money pit.
Even Michael Burry stepped in, revealing positions betting against Nvidia NASDAQ:NVDA and Palantir NASDAQ:PLTR . That move alone sent pockets of the market into a philosophical crisis.
After all, that’s the guy from “The Big Short” and he’s hedged against your favorite trade.
🤖 So… Are the Bulls Back?
Maybe. For now at least. But with conditions.
Nvidia’s stock more than doubled between April and late October, only to slide in recent weeks as bubble fears thickened. Year to date, the stock is still up about 30%.
Nvidia’s numbers prove that AI spending is still accelerating. But the broader question remains: Can companies actually turn those massive AI investments into profit?
Nvidia’s blowout quarter just reset the narrative:
AI demand is still real
Spending is justified
The cycle is still “virtuous,” in Huang’s words
After this earnings print, the bull case has something it desperately needed: momentum.
And momentum is a powerful thing, especially in a market that had started to doubt its favorite story.
Off to you : Do you still see room for growth in the AI space? Or is that rebound a short-term reflex? Share your views in the comments!

META now close to a critical trendlineMETA is approaching a significant technical region.
The trendline currently in focus originated on 31 October 2022, and it has remained relevant over time.
This same trendline was retested twice in April of this year, and price action is once again moving toward it after achieving a new all-time high.
At the moment, the asset is sitting at the Fibonacci 61.8% retracement level — a well-known zone where reversals often occur. Based on this structure, the asset may begin its upward move from the current region, or it may decline by an additional $10–$20 to retest the ascending trendline.
I have taken my initial positions in META during this pullback and may increase my exposure if price reaches the trendline.
Overall, my outlook remains bullish.
Trade responsibly.
Entry: RR is 1:3
Confidence: High

SOL — Deep Pullback Into Major SupportSOL has been in a steady freefall over the past weeks. On the higher timeframes the key support and resistance zones are very clearly defined. The $250 level acted as a big resistance area, with multiple rejections showing sellers were firmly in control up there.
On the downside, the $125 support zone has shown clear strength, with bulls defending this area and producing strong bounces each time price revisited it.
The swing low at $126 presents an attractive long opportunity, especially with the sell-side liquidity and the quarterly level at $124.54 sitting just below, adding further confluence. Additionally, the anchored VWAP from the $8 low lies around $114, aligning almost perfectly with the 0.886 Fibonacci retracement at $113.3, providing deeper support should price extend lower.
Long Entry Zones:
0.786 Fib: $129.13
0.886 Fib: $113.3
Why the 0.786–0.886 Zone Is a Major Reversal Area
The 0.786–0.886 Fib zone is one of the best spots to look for a reversal after a deep pullback. It’s where strong trends often take their final dip before bouncing.
Here’s why it works so well:
It’s the typical “deep correction” zone in strong trends.
Price usually sweeps sell-side liquidity here before reversing.
Many harmonic patterns use this exact area as their turning point.
It often lines up with anchored VWAPs or volume nodes, adding extra support.
It’s basically the capitulation zone where weak hands exit right before a bounce.
Overall, it’s a clean area with clear invalidation and great R:R → perfect for spotting high-probability reversal setups.
_________________________________
💬 If you found this helpful, drop a like and comment!

The Market is at 80°C. What Happens at 100°C?Greetings, everyone.
Today, I don't want to talk about the news. I want to talk about what truly matters: market structure. Many traders are currently looking for a news event to explain the current lull and predict Bitcoin's next move. They are looking in the wrong direction.
Remember this: the news is not the cause of a move. It's just a convenient explanation handed to you after the move has already happened. For me, the chart is primary. And right now, it's telling a story that most people are not going to like.
The Global Picture: An Economy of Bubbles and Boiling Water
We live in an era of bubbles. We had the dot-coms, the tulip mania, and now we are witnessing the AI bubble. Yes, AI is a game-changer, and I am actively integrating it into all my processes - it would be foolish to deny this trend. But that doesn't change the fact that the markets are overheated.
The entire global economy right now feels like water heated to 80 degrees Celsius. It’s not boiling yet, but the boiling point is near. Something is about to happen, and the steam is getting ready to burst out.
The Market's Pulse: Where the Crowd Goes Wrong
And what about the crowd? The crowd isn't in Bitcoin anymore. They are trapped in altcoins, having resigned themselves to being "forever waiters." They are praying for an altseason, not realizing that the brief 20-30% pump we saw - that was the altseason. It has already become a meme.
I see endless posts about liquidations on social media. The sentiment is desperate. Most have already lost their futures positions or will lose them soon. What reigns in the market right now isn't fear or greed, but rather a slow realization that the bear market never really left.
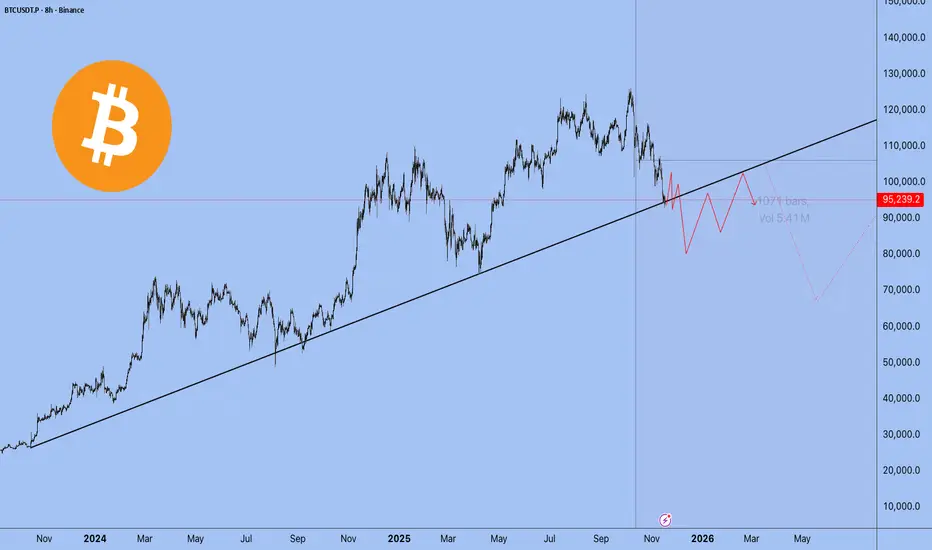
The Main Setup on the Chart: A Classic Liquidity Trap
Now for the most important part - what is happening on the Bitcoin chart?
As you can see, we are sitting on a critical trendline support. Everyone sees it. Novices and retail traders see this as a clear "buy the dip" signal. And that is part of the game.
A deliberate trap is being set:
Consolidation : The price is being intentionally held near the support line to create an illusion of strength and to accumulate buyers' positions.
Stacking Stop-Losses : Market makers know that the crowd places their stops just below this obvious line.
Execution : Once enough liquidity has been built up, a sharp breakdown will occur. This will trigger a cascade of stop-loss liquidations, which will only accelerate the fall.
I remain fully on the bearish side until we see a confident break of the all-time high. I view any bounce from the current levels as an opportunity for a better entry into a short position.
What's Next?
What is my advice to myself for the next 2-4 weeks? Wait.
The market is preparing for a great cleansing. A wave of delistings of junk projects and meme coins - which serve no one but the exchanges that use them for hype - is coming. After this cleanse, there will be incredible opportunities to buy at very attractive prices.
Now is the time for deep research into the projects you truly believe in. It's time to get your limit orders ready and wait for the market to come to your prices.
Thank you for your attention.
Regards,
Your EXCAVO.
XAUUSD Long: Buyers Eye Push Toward $4,100 ResistanceHello traders! XAUUSD is developing a clear technical structure after reacting multiple times to both the Supply and Demand zones, forming a well-defined pattern of price behavior. Recently, Gold rejected the Supply Line after creating a new Pivot Point near the $4,230 area — the same region where a previous strong rejection occurred. This confluence confirms that sellers remain active at the upper boundary of the market. Earlier, the market formed a Double Top pattern near the same Supply Zone, which triggered a strong bearish reversal. After the breakdown, price retested the $4,100 level several times, turning it into a meaningful local resistance. Multiple breakout attempts above this level failed, signaling strong selling pressure from the supply area.
Currently, XAUUSD is testing the Demand Line that has been respected consistently throughout the recent bullish leg. Each touch of this trendline resulted in a higher pivot point, confirming active buyers stepping into the market. This area aligns with the $4,000–$4,010 Demand Zone — a key support cluster where price has reacted with strong bullish impulses before.
My scenario as long as XAUUSD holds above the Demand Line and the $4,000–$4,010 support, the bullish structure remains valid. A rebound from this zone may initiate a fresh move toward the $4,100 Supply Zone (TP1), where the next important reaction is expected. A clean breakout above $4,100 would strengthen the bullish scenario and open the path toward $4,150–$4,170, aligning with the upper Supply Line. If Gold fails to hold above the Demand Zone, sellers may regain control and push the price lower toward the $3,960 support, signaling a deeper correction phase. For now, the market favors buying pullbacks near demand while monitoring price action closely around the $4,100 resistance. Manage your risk!

When Crypto Actually MovesCrypto trades around the clock, but the market doesn’t behave the same way at every hour. Volume, liquidity, and volatility cluster around predictable windows, and those windows shape how setups form and how price reacts. When you understand these shifts, you stop taking trades randomly and start aligning execution with the moments when the market truly moves.
Why Sessions Matter
Even though crypto never sleeps, human traders and institutional desks still operate in cycles. Liquidity providers adjust during business hours. Market makers re-balance at session opens. Macro news is released on a fixed schedule. These patterns create recurring volatility signatures.
Ignoring sessions means you treat every candle as equal. Understanding sessions means you add a layer of context that improves timing, risk control, and win rate.
Asia Session (00:00–06:00 UTC)
The Asia window tends to be slower and more range-bound.
Characteristics include:
– Moderate liquidity
– Clean consolidations
– Accumulation before Europe
– Fewer impulsive moves unless driven by news from Asia-Pacific regions
This period often sets the initial range of the day. Liquidity begins to cluster above highs and below lows, creating the conditions for later sweeps.
Europe Session (07:00–12:00 UTC)
Liquidity expands significantly as London opens. You often see the first engineered move of the day.
Key behaviors:
– Early sweeps of the Asia range
– Strong breakouts from overnight compression
– Directional push before New York volatility
This session frequently defines the directional bias into US hours. It’s a prime window for structured setups because market participation rises sharply.
US Session (13:00–20:00 UTC)
This is the most active window. The highest liquidity and most decisive moves occur here.
Typical features:
– Strong continuation or full reversal of the London move
– Reaction to economic news
– Trend acceleration during peak overlap hours
This is where major breakouts, deep liquidity hunts, and high-powered moves happen. If you trade momentum or breakout strategies, this session offers the cleanest conditions.
Weekend Behavior
Weekends operate on thin liquidity. Order books are lighter, market makers are less active, and volatility behaves differently.
Common outcomes:
– Sharp wicks that violate structure
– Sudden spikes without follow-through
– False breakouts with immediate reversals
Weekend moves often distort technicals. They can be useful for narrative-driven positions but carry higher risk for intraday traders.
How to Integrate Sessions Into Your Trading
Use sessions to filter when you participate and when you avoid noise.
Practical adjustments:
– Execute momentum setups during Europe or US hours.
– Treat Asia session as a range-building phase suitable for scouting zones.
– Avoid taking aggressive positions during weekend chop.
– Use session opens as key decision points for liquidity grabs.
When you layer session timing on top of structure, you refine entries and eliminate trades that lack the environment for follow-through.
The Strategic Advantage of Session Awareness
Session timing gives you clarity. You start anticipating where liquidity is likely to be engineered, where volume will enter, and when the market is likely to trend or stall.
This transforms your approach.
Instead of reacting to candles, you plan around expected volatility cycles.
Instead of forcing trades, you wait for session transitions that historically produce reliable movement.
