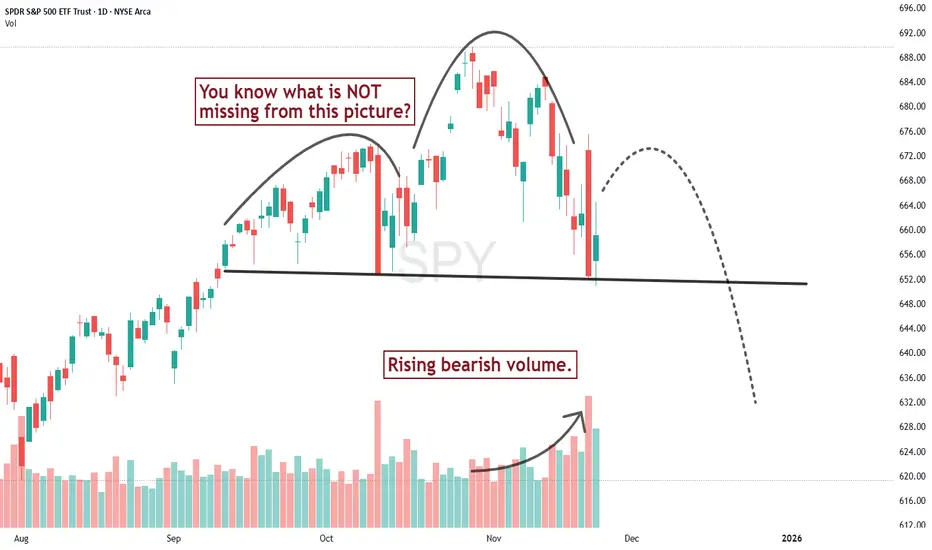
A couple days ago I thought there wasn't sufficient price pattern evidence to talk about a serious change in trend for the S&P 500, mostly because I didn't see the volume pattern confirming the downward slide of the recent high. But Thursday changed that. Redrawing the neckline, we get a chart that looks more like the textbooks drew it up.
Will the next swing high lead to a serious acceleration of downward trending prices? If so hold on tight, it could be a BIG drop.
Will the next swing high lead to a serious acceleration of downward trending prices? If so hold on tight, it could be a BIG drop.
Disclaimer
The information and publications are not meant to be, and do not constitute, financial, investment, trading, or other types of advice or recommendations supplied or endorsed by TradingView. Read more in the Terms of Use.
Disclaimer
The information and publications are not meant to be, and do not constitute, financial, investment, trading, or other types of advice or recommendations supplied or endorsed by TradingView. Read more in the Terms of Use.