The Trade You Don’t Take!Most traders focus on entries, strategies, indicators, patterns…
But the truth is: your biggest edge is avoiding low-quality trades.
The market rewards patience far more than prediction.
Here’s the framework professional traders use to filter noise from opportunity, something 90% of traders overlook:
1. The Market Must Be Aligned
Before placing any trade, ask one question:
“Is the market trending, ranging, or correcting?”
Your strategy only works in the right environment.
A breakout strategy fails in a choppy range. A mean-reversion setup dies in a strong trend.
Identify the environment first, then choose the setup.
2. Your Levels Must Be Significant
True opportunity comes from reaction points, not random prices.
Look for:
- Major swing highs and lows
- Weekly or monthly levels
- Clean trendlines with multiple touches
- Areas where price previously paused, reversed, or consolidated
If the market isn’t near one of these levels, you’re trading in the middle, where noise lives.
3. Your Risk Must Make Sense
A good setup with a bad risk-to-reward is a bad trade.
Professionals only act when:
- The stop-loss is logical (protected behind structure)
- The target is realistic
- The reward outweighs the risk
If the math doesn’t work, the trade doesn’t happen.
🧠 The Hidden Lesson
Great traders don’t trade more, they filter more.
Your account grows not by finding better entries,
but by avoiding the trades that drain your capital, energy, and confidence.
Master the art of waiting, and your strategy will finally start working the way it was designed to.
⚠️ Disclaimer: This is not financial advice. Always do your own research and manage risk properly.
📚 Stick to your trading plan regarding entries, risk, and management.
Good luck! 🍀
All Strategies Are Good; If Managed Properly!
~Richard Nasr
Community ideas

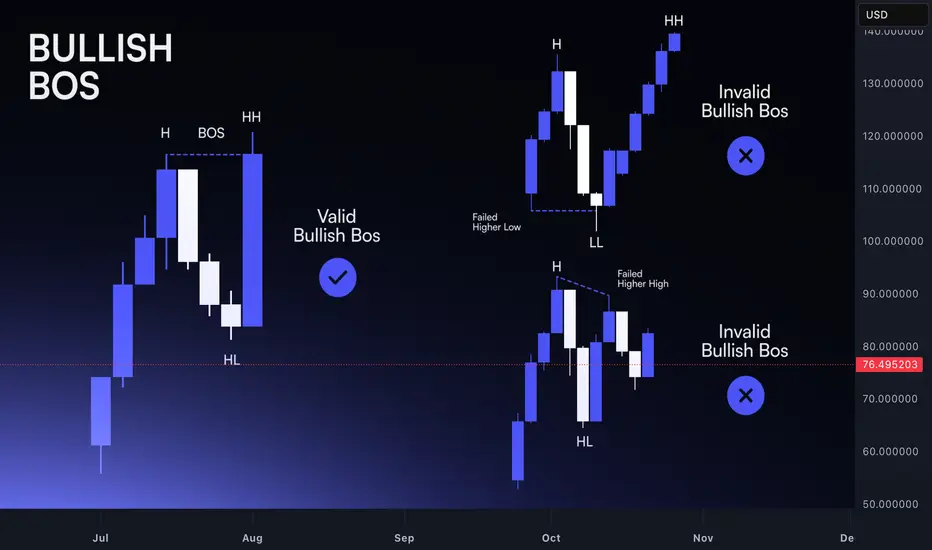
Break of Structure: Identifying Real Trend Shifts Markets move in phases, and structure is the clearest way to read those transitions. A trend doesn’t reverse because price slows down or because a candle looks different. It reverses when the underlying pattern of highs and lows breaks.
Understanding this sequence is what separates disciplined analysis from reactive guessing.
In an uptrend, buyers defend higher lows and push price into higher highs. As long as this structure holds, the trend is intact. Noise may create deep pullbacks or temporary hesitation, but the narrative remains unchanged.
The first sign of vulnerability appears when price fails to create a meaningful higher high. Momentum stalls, and the next push upward shows less conviction.
The real shift comes when a higher low is taken out. This is the break of structure. It shows that buyers no longer control the market, and sellers have absorbed enough liquidity to push through a prior defensive point.
This is not a prediction; it’s an objective change in the market’s behaviour. A single candle doesn’t define it. The sequence does.
For downtrends, the logic is the same in reverse. Lower highs and lower lows define control. When price fails to print a clean lower low and then breaks a prior lower high, the trend loses integrity. Structure reveals the turning point before sentiment catches up.
However, not every break is a real shift. Crypto produces countless intraday spikes that violate levels without altering the broader narrative.
The difference lies in context. A valid break is supported by:
– Clear momentum into the break
– Liquidity taken before the shift
– Follow-through after the level is broken
– A retest that confirms the new direction
These factors filter out noise and highlight genuine transitions. Watching price break structure is not enough; you must also assess whether the move fits within the larger story of the trend.
A break of structure doesn’t mean instant reversal. It means the previous trend has ended. The next phase might be consolidation, re-accumulation, or immediate reversal, but the bias shifts the moment structure changes.
Traders who read structure objectively adjust earlier and avoid fighting a direction that no longer has control.
Once you internalize how highs and lows interact, spotting real shifts becomes a structured process instead of an emotional reaction. Structure turns confusion into clarity and gives you a reliable framework for navigating both trends and transitions.
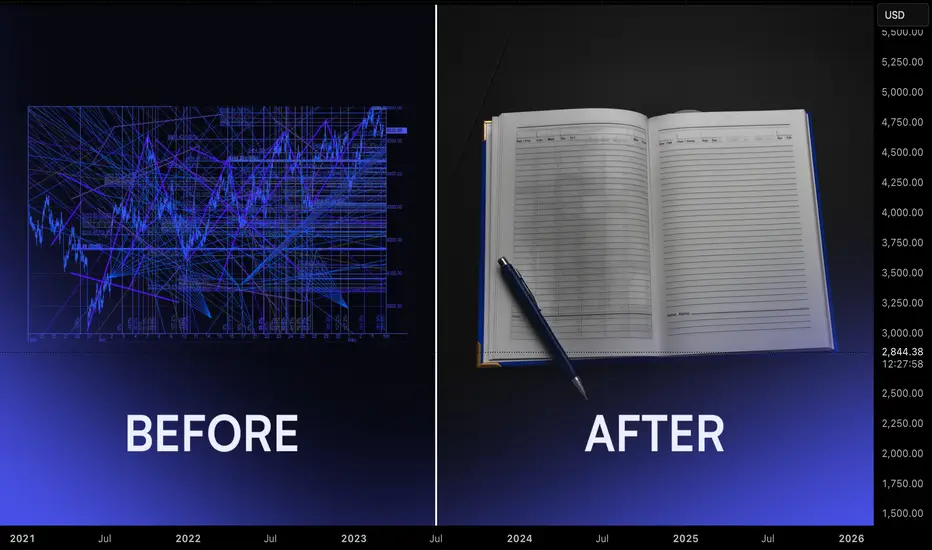
Journaling For Traders: Turning Random Results Into A Feedback Most traders spend years tweaking indicators and strategies while leaving their process undocumented. Without a journal, every trade feels new, every mistake repeats, and progress stays vague. A structured journal turns experience into data. It shows what you do well, what keeps failing, and which behaviours appear before your best and worst decisions.
The first step is simple: record every trade. Log the setup, market structure, entry reason, risk, and emotional state. Write whether you felt rushed, confident, bored, or frustrated. Do not only record wins or big losses. Incomplete data keeps blind spots alive.
The real value appears during weekly review. Set time aside after markets slow down and go through the trades as a batch. Look for recurring situations. You may notice that late-session entries perform poorly, that you increase size after wins, or that you cut trades early when size feels uncomfortable. These patterns are not visible inside a single session. They emerge only over a cluster of trades.
Next, extract insights. Group trades by setup, session, and emotional state. Identify your highest quality combinations. For example, trend continuation trades in London with fixed risk might show a strong performance profile while countertrend entries in low volume hours consistently underperform. This step separates what you think works from what actually delivers.
Finally, adjust strategy. Turn observations into rules. Reduce or remove the behaviours that repeatedly drain capital. Formalise the conditions that define your best trades. Add small process rules rather than full rewrites, then track the impact in the next review cycle. Over time, your playbook becomes evidence based rather than theoretical.
Journaling is not an extra task for perfectionists. It is the operating system behind professional execution. When you continuously record, review, extract, and adjust, your trading process compounds in quality even when individual weeks are difficult.
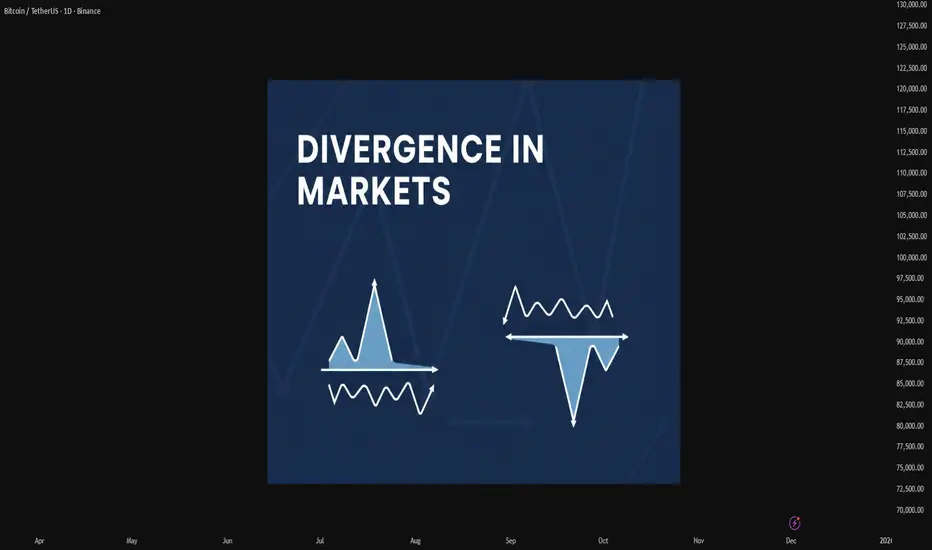
Mastering Divergence in Technical AnalysisIn technical analysis, a divergence (also called a “momentum divergence” or “price/indicator disagreement”) is one of the most powerful early warning signals available to traders. In simple terms, divergence occurs when price and a momentum indicator (such as RSI, MACD, or Awesome Oscillator etc.) move in opposite directions.
This disagreement often signals that the current trend is losing strength and that a pause, pullback, or full reversal may be approaching.
1. What Is Divergence?
Normally, in a healthy trend:
In an uptrend, price makes higher highs and momentum indicators also make higher highs.
In a downtrend, price makes lower lows and momentum indicators also make lower lows.
A divergence appears when this alignment breaks.
Typical example with RSI or MACD:
Price makes a higher high,
But the indicator makes a lower high.
This tells us that, although price has pushed to a new extreme, the underlying momentum is weaker. Smart money may be taking profits, and the late participants are driving the final leg of the move.
2. Types of Divergence
There are two main families of divergence:
Regular (classic) divergence – often associated with potential trend reversals.
Hidden divergence – often associated with trend continuation after a correction.
Within each family, we have bullish and bearish versions.
2.1 Regular Bullish Divergence – Potential Trend Reversal Up
This suggests that sellers are still pushing price to new lows, but momentum is no longer confirming the strength of this selling pressure. The downtrend is weakening and a bullish reversal may develop.
Context where it’s most powerful:
After a prolonged downtrend.
At or near a higher-timeframe support level (daily/weekly support, major demand zone, trendline, or Fibonacci confluence).
2.2 Regular Bearish Divergence – Potential Trend Reversal Down
This signals that buyers are still able to push price higher, but each new high is supported by less momentum. The uptrend is aging, and a bearish reversal or deeper correction becomes more likely.
Context where it’s most powerful:
After a strong, extended uptrend.
Around major resistance levels, supply zones, or upper trendlines.
2.3 Hidden Bullish Divergence – Trend Continuation Up
Here, price structure still shows an uptrend (higher lows), but the indicator has overshot to the downside. This often appears during pullbacks within an uptrend, suggesting that the correction is driven more by short-term emotion than by real structural weakness.
Interpretation:
Hidden bullish divergence indicates trend continuation. Bulls remain in control, and the pullback may provide an opportunity to join the uptrend at a better price.
2.4 Hidden Bearish Divergence – Trend Continuation Down
Price structure still favors the bears (lower highs), but the indicator has spiked higher, often due to a sharp counter-trend rally. This suggests that the bounce is corrective rather than the start of a new uptrend.
Interpretation:
Hidden bearish divergence favors continuation of the downtrend and often appears before the next impulsive bearish leg.
3. Which Indicators to Use?
Divergence can be spotted on many oscillators, but the most commonly used are:
RSI (Relative Strength Index) – very popular for spotting overbought/oversold zones and divergences.
MACD (and its histogram) – useful for trend and momentum, especially on higher timeframes.
Stochastic Oscillator – often used in range-bound environments.
Awesome Oscillator, CCI, etc. – alternative momentum tools, depending on your preference.
The concept is the same: price and indicator should generally confirm each other. If not, you have a divergence.
4. Timeframes and Reliability
Divergences can be found on all timeframes, but their reliability increases with higher timeframes:
On M5–M15, divergences are frequent but often short-lived. Better for scalpers.
On H1–H4, signals have more weight and can lead to multi-session moves.
On Daily/Weekly, divergences can mark major tops and bottoms, but they may take longer to play out.
A good practice is to:
Identify major divergences on higher timeframes (H4, Daily).
Refine entries on lower timeframes (M15, M30, H1) using structure and price action.
5. How to Trade Divergences (Practical Framework)
Divergence by itself is not a complete trading system. It is a signal of potential imbalance, which should be combined with:
Key levels (support, resistance, supply/demand zones).
Trend structure (higher highs/lows or lower highs/lows).
Price action confirmations (reversal candles, break of structure, etc.).
Risk management (position sizing, stop loss, invalidation level).
6. Common Mistakes When Using Divergences
- Trading every divergence blindly.
Not every divergence leads to a big reversal. Many will result in only minor pullbacks.
- Ignoring the trend.
Regular divergences against a strong trend can fail multiple times before a real top or bottom forms. Hidden divergences are often more reliable in trending markets.
- Forcing divergences where they don’t exist.
Only connect clear, obvious swing highs and lows on both price and indicator. If you have to “stretch” the lines, the signal is probably weak.
- No risk management.
A divergence is just a probability edge, not a guarantee. Always define invalidation and manage position size accordingly.
7. Best Practices
Combine divergence with market structure (trendlines, channels, higher highs/lows).
Use higher-timeframe context and drop to lower timeframes for refined entries.
Pay attention to confluence:
Divergence + key level + candlestick signal is stronger than any single factor.
Keep a trading journal of divergence setups, including screenshots from your charts. Over time, you will see which conditions work best for your style.
Divergences are not magic, but they are one of the cleanest ways to see when price and momentum disagree. Used correctly, they can:
Help you avoid entering late in a trend,
Alert you to potential reversals before they are obvious to the crowd, and
Provide high-probability continuation entries via hidden divergences within strong trends.
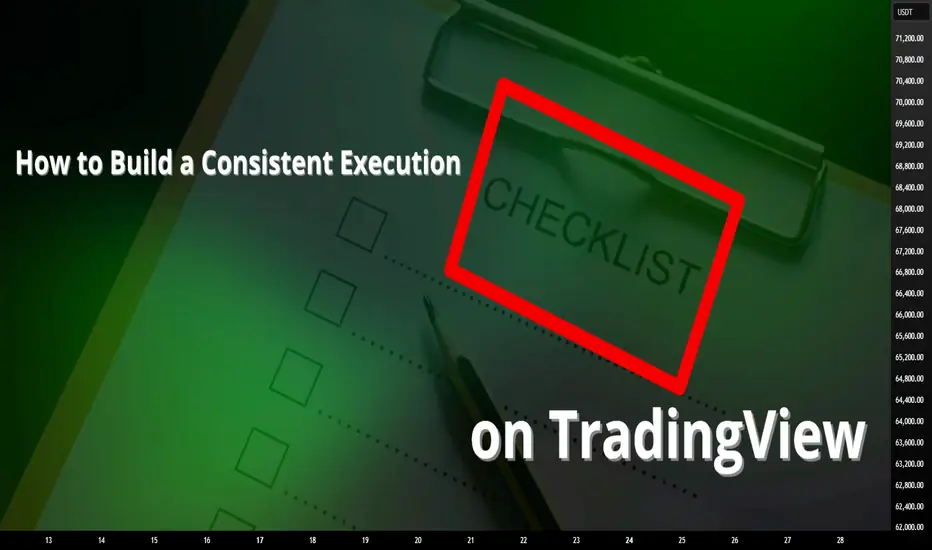
How to Build a Consistent Execution Checklist on TradingViewMost trading mistakes don’t come from bad strategy, they come from inconsistent execution.
An execution checklist removes guesswork and replaces it with structure.
When your actions follow a routine, your results stabilize.
TradingView gives you everything you need to build a checklist that stays visible, actionable, and tied directly to your chart.
1. Define Your Core Conditions
Before any trade, the bigger picture must be clear.
Start your checklist by answering three questions:
What is the higher-timeframe direction
Where is price relative to key levels
Is price approaching with strength or weakness
Use TradingView’s drawing tools to mark support, resistance, value zones, and session highs and lows.
Add a simple text note on the chart listing your core conditions so they are always visible.
If the market context fails this first screen, the trade is already invalid.
2. Build Confirmation Criteria
Once structure is confirmed, you move to evidence.
Mark confirmation areas directly on your chart:
Liquidity pools
Fair value zones or imbalances
Previous session highs and lows
Asian range or New York open
If your strategy uses indicators, document exact conditions:
Moving average position and slope
Volume behavior
VWAP location
Volatility expansion or contraction
Define rules that don’t change based on emotion.
Confirmation should prove your bias, not justify your urge to trade.
3. Validate Risk Before Execution
Every setup must survive a risk checkpoint before it’s allowed to go live.
Your checklist must answer:
Where is my invalidation level
How much capital am I risking
Does this violate any daily limits
Is the reward worth the risk
Use TradingView’s long or short position tool to visualize risk directly on the chart.
Save it as a template so your risk process stays uniform across all trades.
No trade is valid if risk isn’t clean.
4. Create a Pre-Execution Routine
A checklist only works if you actually follow it.
Add a short pre-trade process directly to your chart notes using checkboxes or bullet points:
Example execution checklist:
Market phase confirmed
Level identified
Confirmation present
Risk valid
Entry condition active
Walk through this list before clicking buy or sell.
If one item fails, the trade fails.
Over time, this routine removes emotional impulse completely.
5. Review and Refine Weekly
Your checklist isn’t static, it evolves.
Every week ask:
Where did I break my rules
What conditions led to losses
Which confirmations work best
What rules saved me from bad trades
Use TradingView’s trade replay and journaling features to review execution quality, not just profit.
Consistency improves when your system evolves with you.
Final Thought
A checklist doesn’t restrict your trading, it frees you from emotion.
When your process is clear, your confidence increases.
When your confidence increases, discipline follows.
Good traders make decisions.
Great traders execute procedures.
Stay Green!
5 Key Trading Tips for BeginnersWelcome back everyone to another post! In this article we will be explaining 5 key pointers (tips) for new individuals entering the trading space.
When it comes to trading first there is “ understanding ” before we begin the 5 keys steps. Let me assist you in understanding what will happen when you take on trading.
Trading is a challenge. Not a video game challenge, not a math test challenge – a * Challenge * One that will break you. Trading will break you mentally, physically, spiritually and financially. It is an eye-opening journey.
Trading will teach you a lot about yourself, and it will teach you a lot about discipline, patience and how you can analyze markets.
I saw a quote somewhere, it said trading: “ Trading is the hardest way, to make easy money ” and they are right.
You will be learning how to manage risk, control your emotions, understand your own decision-making patterns. These are all invaluable lessons for life, as well as trading.
Sounds great! But then there are the losses, what you lose to gain all this. Trading isn’t something that you can learn overnight – all those posts you see about a young 17-year-old “ cracking the code ” is rubbish. Why? Because they haven’t learnt life lessons.
You can make money fast, but you will lose it faster if you don’t know how to manage it.
Trading will drain every bit of energy out of you. You will feel like you’re falling behind, you will eventually collapse at every loss and become frustrated. The market will test you; the market doesn’t give a damn about you – you accept the risk when you take on trading and since you’re the one making the trades, it’s you VS you.
You’re testing yourself. You agree to test your patience, your confidence, your mindset. Doing so will make progress feel nonexistent or slow.
Every day, and every trade you will question yourself, wondering if “trading” is even for you. Sometimes it will feel like you’re going in circles. You will continue to make mistakes repeatedly. It will become exhausting but remember – only experience and your own strengths will allow you to succeed. Only those who can endure the grind without giving up will make it.
So, let’s start off the 5 key pointers that will prepare you.
1) Prioritize Risk Management Over Profits:
Most newbies focus first on “ making money ” rather than safeguarding capital. The reality is that surviving in the market is way more important than winning every trade you see or come across.
Key Points:
Determine risk per trade: A common rule is risking no more than 1-2% of your trading account on a single trade. This way even a string of losses will not wipe you out.
Always use stoploss: A defined maximum loss per trade enforces discipline and emotions to stay in check.
Position sizing: Your sizing should be proportional to what you’re willing to lose on each trade. Bigger trades amplify the losses, but they also amplify the profits.
Why it matters:
Without strong risk management, even a high win-rate strategy can fail. Protecting capital ensures you’re still in the game when opportunities arise.
2) Develop a trading plan and stick to it .
Random reactive trading is the best way to lose money. Build your plan overtime.
Key points:
Define your strategy: Building your strategy is the longest part, constant back testing and forward testing, refining and rebuilding. You’re not “switching” your strategy if you’re adding something small to it, you’re changing it if you eliminate the whole thing.
Identify your form of trades, short, mid, long term or swing trades.
Set clear rules: Don’t leave anything to chance, for example “I only enter trades if price closes above the 50ema and RSI is above 50”
Journalling trades: Ensure to journal all your trades, “How do I journal” Easy. Record the time, date, symbol, pair, what model/system you used, images, your entry, tp and exit, why and for how long you’ll have it open.
Why it matters:
Consistency is a key, it pairs with discipline, psychology and lingers with risk management. Traders who follow a disciplined system perform better than those to trade off an impulsive feeling. Other words “Gamble”
3) Master one market and one system first:
Beginners usually spread themselves too thin, trying forex, crypto, stocks and commodities all at once – Unfortunately for me I made this mistake at the start which made it very difficult! – Don’t do this. Stick to one market.
Key points:
Pick one market: Each market has its own rhythm, volatility, and liquidity. Teaching one thoroughly allows you to understand everything about it.
Focus on one system: Instead of trying every new system from you tubes or forums, master one approach and refine it onwards e.g. – you trade FVGs, Win rate is 50% once you add Fibonacci it might be e.g. 65%
Avoid information overload: Social media and trading forums are filled with conflicting advice, stick to your chosen approach and refine it. People say you need to have 12-hour trading days. If you do this, you will FAIL. You will grind yourself into the ground and face burnout making it very difficult to get back up again. Limit yourself to how much trading and trading study you do a day. Eg 10 back test trades, 3 real trades, 3 journaled trades, 1 hour of studying and researching the market.
Without strong risk management, even a high win-rate strategy can fail. Protecting capital ensures you’re still in the game when opportunities arise.
Why it matters
Depth beats breadth early on. Mastering a single market and system will allow you to build confidence and improve your edge.
4) Understand the Psychology of trading.
Trading isn’t just numbers: as mentioned in “understanding” it’s a test of emotional control, fear, greed and impatience.
Key points:
Emotions vs logic: ensure you recognize emotional reactions like FOMO (Fear of missing out) or revenge trading. Pause before reacting to a trade that will go against you.
Set realistic expectations : Markets move slowly. Sometimes for months, don’t expect huge gains overnight. Just like DCA focus on compounding. Compound your knowledge and skill set.
Mindset training: Techniques like medication and journaling as well as visualization can help reduce stress and maintain discipline.
Why it matters:
Even a diamond system can still fail if emotions drive your actions. Psychology often determines long term success, more than technical skill.
5) Prioritize learning. Then earning.
Beginners fall into the trap of trading being a “get rich quick” scheme. But the real investment is learning how the market works.
Key points:
Paper and demo trade first: Practice on demo accounts before you use real money – you will be surprised how many times you will fail. It’s better to fail with simulation money than your McDonalds weekly wage.
Review every trade: Analyze your losing trades, but also your winning trades. Find patterns and areas to improve.
Continuously educate yourself: Read books about the mind, about habits, watch market analysis but critically, apply what you learn and don’t just collect information and not use it.
Why it matters:
Earnings are just the byproduct trading. The faster you learn and adapt, the sooner your profits will appear. Treat early losses as tuition. Not failure.
Thank you all so much for reading.
I hope this benefits all those who are starting off their trading journey. If you have any questions, let me know in the comments below!

The Most Underrated Skill: Reading the Market Without Bias!Most traders focus on indicators, patterns, and strategies…
But very few focus on the skill that actually moves the needle:
Learning to read the market without forcing your bias onto the chart.
Here’s the truth 👇
When you zoom out and remove the noise, the market is always telling one of only three stories:
📘 1. Impulse → Market is moving with strength
An impulse leg is a clear, strong movement in one direction.
Candles are decisive. Pullbacks are shallow. Speed is visible.
When you identify an impulse, the message is simple:
“Don’t fight me, follow me.”
This is where continuation trades thrive.
📔 2. Correction → Market is taking a breath
A correction is messy, slow, overlapping price action.
The market is not reversing; it’s reloading.
Most beginners confuse corrections with trend reversals… Professionals don’t.
The key question becomes: “Where will this correction end?”
Because that’s where the next impulse usually begins.
📕 3. Reversal → Structure shifts, and momentum dies
A reversal is structural.
You see new lower lows in an uptrend, or new higher highs in a downtrend.
Momentum slows. Failed impulses appear. Trendlines break.
A true reversal is never a single candle; It’s a story told over multiple chapters.
🔑 The Skill: Listening Instead of Predicting
Most traders lose because they try to predict what comes next.
Professionals focus on reading what’s happening now.
Ask these questions every time you open a chart:
- Is momentum increasing or decreasing?
- Are corrections getting deeper or shallower?
- Is structure still intact?
- Which key level holds all the power?
Master these, and you’ll start seeing the market in HD.
💡 Why This Matters
Your entries, exits, and risk management improve automatically when you can answer one simple question:
“Is the market impulsive, corrective, or reversing?”
This removes emotional trading, kills hesitation, and builds confidence, because you’re no longer guessing... You're listening.
🤔 Final Thought
Strategies don’t fail because they’re bad.
Strategies fail because traders apply them at the wrong time.
Read the market first. Trade second.
⚠️ Disclaimer: This is not financial advice. Always do your own research and manage risk properly.
📚 Stick to your trading plan regarding entries, risk, and management.
Good luck! 🍀
All Strategies Are Good; If Managed Properly!
~Richard Nasr

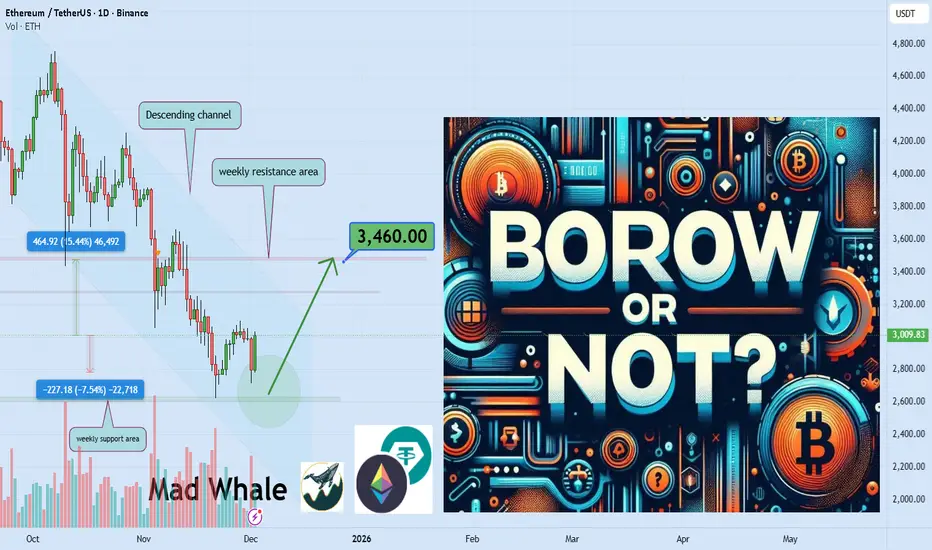
to borrow or not to borrow? why do billionaires borrow so much?Since childhood we were told if you want to sleep peacefully at night never take a loan and always stay debt free but the wealthy seem to follow a completely different rulebook.
How is it that debt creates stress for some people but becomes a growth engine for others.
Hello✌️
Spend 3 minutes ⏰ reading this educational material.
🎯 Analytical Insight on BINANCE:ETHUSDT :
I expect a much bigger rise for ethusdt than what I have shown on the chart. But we should remember that every year when the New Year approaches the market usually goes bearish. We need to wait and pass through that period to see what the final result will be.
Now , let's dive into the educationa l section,
The Basic View of Debt 🧠
Borrowing becomes scary only when it is used for spending not for building value and this is exactly what separates people into two groups.
Why Debt Works for Successful People 💡
Successful individuals turn debt into leverage rather than a burden because compound growth quietly pays the installments while the asset grows larger.
Bad Debt and Short Term Pleasure 🔥
But if you use borrowed money to buy the latest phone take a luxury trip or upgrade your car you only enjoy a short moment before the real pressure begins.
Leverage Behavior in the Market 🧩
The market follows the same rule anyone who enters a position for excitement eventually pays the price but those who seek value creation don’t fear volatility.
The Wealthy Mindset 💬
For the wealthy debt is a mental framework they spread risk instead of running from it which makes their decisions calmer and more precise.
Psychological Pressure on Traders 📉
Traders who always trade only with personal capital often face heavy mental pressure because every price movement equals worry and worry creates mistakes.
The Difference Between Good and Bad Debt 🚀
Once you understand the difference between good debt and bad debt your market view changes good debt builds the future bad debt sells it.
Following the Money and Big Player Logic 🌫
This difference helps you read large investors because they also pull liquidity from places with the lowest psychological and financial cost.
Emotions and Debt in Crypto 🌋
The crypto market reacts deeply to emotions and a trader under stress enters the wrong game but one with the mindset of the wealthy stays steady.
Value Creation Over Time 🌱
Value creation means moving toward things that grow over time and the market reflects this through the behavior of big capital you only need to follow the money trail.
Good Debt and Analytical Structure 🌀
Bad debt makes a trader nervous and impulsive while good debt works like a quiet engine building long term vision and charts teach the same lesson.
📊 TradingView Tools
In this journey there are tools that sharpen your perspective such as the money flow indicator which helps you see when major liquidity enters or exits the market.
Another feature is volume ranges which reveal where decision density is highest crucial for understanding leveraged behavior in price action.
A third useful tool is momentum indicators showing whether a trend moves with real strength or just a short emotional spike.
Combining these tools resembles the wealthy approach to debt using multiple signals to build a logical decision so risk is managed not removed.
Summary 🎯
If you start viewing debt as a tool rather than a fear your market decisions will become clearer and more rational.
Golden Recommendations ⭐
Learn to distinguish spending from investing because the market also recognizes this difference with sharp precision.
Question any move that does not create long term peace because psychological pressure is the biggest hidden debt.
Before making any decision ask whether it builds value or just offers a momentary thrill because the future grows from value not excitement.
✨ Need a little love!
We pour love into every post your support keeps us inspired! 💛 Don’t be shy, we’d love to hear from you on comments. Big thanks , Mad Whale 🐋
📜Please make sure to do your own research before investing, and review the disclaimer provided at the end of each post.
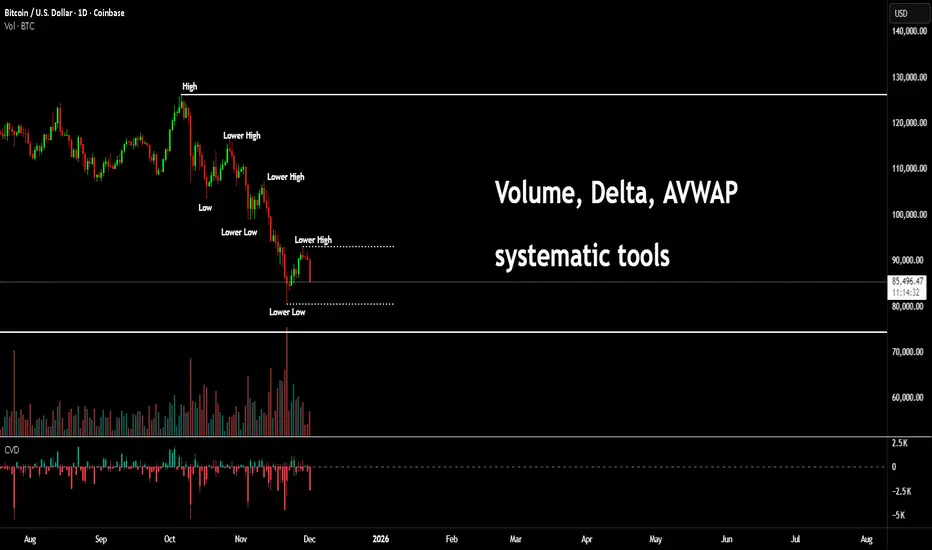
Don't make it complicated for yourself - Volume & Delta toolsOk, don't think this is about Bitcoin. This is just a good use case for these types of tools. All of which you can find for free here on @TradingView
People tend to not really understand some of these tools, maybe they get the idea but not the real value.
For a long time, I used to trade footprint charts, volume delta and seeking more and more info. Now if you don't know what a footprint chart is, don't stress. Footprints are like looking inside a candlestick, it gives you both the buys and sells of each candle. That's about as much as you need to know.
So why don't everyone use them? that is a complex question to answer, but in simple terms. There is no need.
By following rule based techniques such as the mechanical trading system I shared in recent posts;
Ok, so let me show you something.
Take the simple volume tool (I have also added a CVD) more on this later. But with a quick glance, we can spot the price rising and volume dropping off. This is called Divergence.
As you can see price then carries on up and the volume and CVD tools start printing a different story.
Again, not an attack on Bitcoin (I know how precious and defensive some of you get).
This is for any instrument.
Here's another little technique; there is a pattern known as a master pattern. It's a dumbed down Wyckoff. But basically after accumulation or distribution, you see an expansion phase. This is often called a UTAD or a spring (depending on the direction)
I have shown this with the PoC as the main auction area. The consolidation - also known as fair value is an area where a lot of buying and selling took place.
After expanding to roughly equal distances either side of the consolidation. The price will test the PoC or middle of the auction zone again.
However, where people fail to see the obvious. IS as simple as understanding the CVD and volume story.
We could add other tools such as the AVWAP.
You can see price rotates around the auction area. Zoom out;
Here we see price drop below the blue "Value area" meaning it has dropped and is likely to rotate back to the underside of the above auction area. This we can say is a re-test.
So, let's assume we rise - obviously buyers will be buying the dip. After a retest. There are even more clues as to where price will seek liquidity. For this, see the volume profile.
Now, lets add another technique. This is known as internal and external liquidity. We took out prior bullish liquidity (external) then moved back internal. Price will likely seek the next leg higher, but remain internal. All before seeking external, Bearish liquidity.
Here's a simple picture of highs and lows that turn into lower highs and lower lows.
To get a clear read on this; we will need the price to break one of these two levels. Once we do, we have confirmation and a bias as to what pool of liquidity will go after next.
But...
Is there something that gives an early clue?
Well yes. Look at the CVD.
You see, this doesn't have to be all that complicated. Market will seek liquidity, markets don't push up and up forever. There's a saying in this space, if you can't spot liquidity, then you are the liquidity.
Stay safe all!
Disclaimer
This idea does not constitute as financial advice. It is for educational purposes only, our principal trader has over 25 years' experience in stocks, ETF's, and Forex. Hence each trade setup might have different hold times, entry or exit conditions, and will vary from the post/idea shared here. You can use the information from this post to make your own trading plan for the instrument discussed. Trading carries a risk; a high percentage of retail traders lose money. Please keep this in mind when entering any trade. Stay safe.
End of the Yen Carry Trade: What Risk for the Stock Market?For more than two decades, the “yen carry trade” has been a discreet yet powerful pillar of global finance. This mechanism relies on borrowing at low cost in yen—thanks to the ultra-low rates set by the Bank of Japan (BoJ)—and investing those funds in higher-yielding foreign assets (equities, bonds, emerging markets, etc.). The logic was appealing: low financing costs + high returns = profit.
But estimating the size of this phenomenon is challenging. The transactions span loans, bonds, derivatives, and diverse institutions, and the data is fragmented. Depending on the source, the active global carry trade could represent a few hundred billion dollars (200–300 billion in a conservative estimate), while broader calculations including debt, funding structures, and derivative exposures point to volumes reaching 500–800 billion dollars, or even more in some assessments.
What makes it worrying is that this cheap-liquidity flow has functioned as a global engine for risk-asset investment, supporting equity markets, debt markets, and emerging economies that depended on capital “imported” through the yen.
But this engine is fading. The BoJ has begun raising rates, and the yen has strengthened, increasing the cost of yen borrowing and reducing carry-trade margins. In this environment, many investors have already started unwinding their positions, as Japan’s bond yields have been rising sharply since 2024, as shown in the chart below.
A halt or significant slowdown of the carry trade can have several consequences: reduced flows toward risk assets, forced selling, volatility, tightening global liquidity, and higher financing costs for regions or actors dependent on foreign capital. If 300 to 500 billion dollars were to exit, it would represent a substantial withdrawal relative to typical investment flows, potentially triggering notable corrections in risk assets.
However, this scenario does not necessarily imply a “crash.” It is more of a global adjustment: normalization of funding conditions, redefinition of valuations, and possible market stabilization after the purge of the most fragile positions. Moreover, even though Japanese interest rates are rising, they remain significantly lower than U.S. or European rates.
In short: the yen carry trade has acted as a buffer—and even a stimulant—for global markets. Its unwinding signals a transition. It is a structural shift, not a systemic risk, because the amounts remain relatively contained. In any case, the future monetary policy of the Bank of Japan, especially the policy decision expected on Friday, December 19, will influence stock-market risk assets.
DISCLAIMER:
This content is intended for individuals who are familiar with financial markets and instruments and is for information purposes only. The presented idea (including market commentary, market data and observations) is not a work product of any research department of Swissquote or its affiliates. This material is intended to highlight market action and does not constitute investment, legal or tax advice. If you are a retail investor or lack experience in trading complex financial products, it is advisable to seek professional advice from licensed advisor before making any financial decisions.
This content is not intended to manipulate the market or encourage any specific financial behavior.
Swissquote makes no representation or warranty as to the quality, completeness, accuracy, comprehensiveness or non-infringement of such content. The views expressed are those of the consultant and are provided for educational purposes only. Any information provided relating to a product or market should not be construed as recommending an investment strategy or transaction. Past performance is not a guarantee of future results.
Swissquote and its employees and representatives shall in no event be held liable for any damages or losses arising directly or indirectly from decisions made on the basis of this content.
The use of any third-party brands or trademarks is for information only and does not imply endorsement by Swissquote, or that the trademark owner has authorised Swissquote to promote its products or services.
Swissquote is the marketing brand for the activities of Swissquote Bank Ltd (Switzerland) regulated by FINMA, Swissquote Capital Markets Limited regulated by CySEC (Cyprus), Swissquote Bank Europe SA (Luxembourg) regulated by the CSSF, Swissquote Ltd (UK) regulated by the FCA, Swissquote Financial Services (Malta) Ltd regulated by the Malta Financial Services Authority, Swissquote MEA Ltd. (UAE) regulated by the Dubai Financial Services Authority, Swissquote Pte Ltd (Singapore) regulated by the Monetary Authority of Singapore, Swissquote Asia Limited (Hong Kong) licensed by the Hong Kong Securities and Futures Commission (SFC) and Swissquote South Africa (Pty) Ltd supervised by the FSCA.
Products and services of Swissquote are only intended for those permitted to receive them under local law.
All investments carry a degree of risk. The risk of loss in trading or holding financial instruments can be substantial. The value of financial instruments, including but not limited to stocks, bonds, cryptocurrencies, and other assets, can fluctuate both upwards and downwards. There is a significant risk of financial loss when buying, selling, holding, staking, or investing in these instruments. SQBE makes no recommendations regarding any specific investment, transaction, or the use of any particular investment strategy.
CFDs are complex instruments and come with a high risk of losing money rapidly due to leverage. The vast majority of retail client accounts suffer capital losses when trading in CFDs. You should consider whether you understand how CFDs work and whether you can afford to take the high risk of losing your money.
Digital Assets are unregulated in most countries and consumer protection rules may not apply. As highly volatile speculative investments, Digital Assets are not suitable for investors without a high-risk tolerance. Make sure you understand each Digital Asset before you trade.
Cryptocurrencies are not considered legal tender in some jurisdictions and are subject to regulatory uncertainties.
The use of Internet-based systems can involve high risks, including, but not limited to, fraud, cyber-attacks, network and communication failures, as well as identity theft and phishing attacks related to crypto-assets.

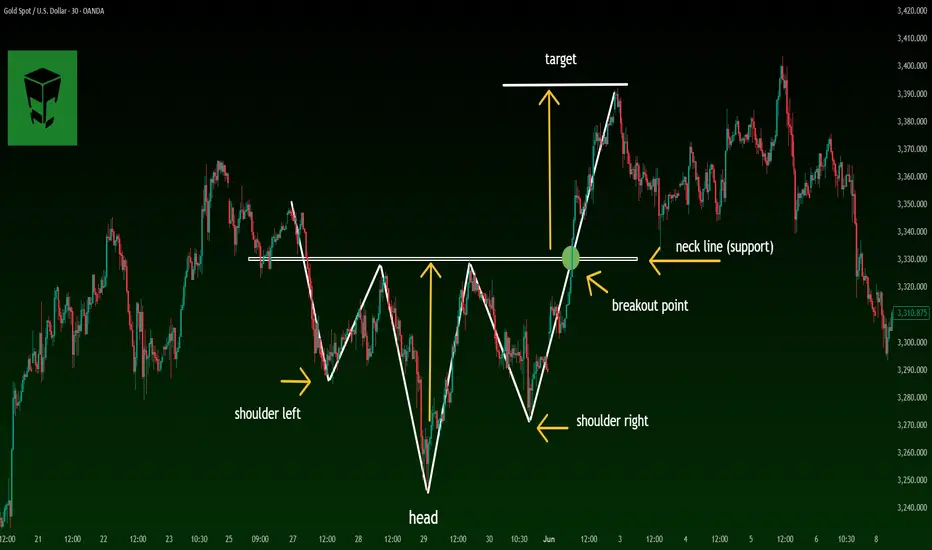
Secrets of the Head & Shoulders Pattern for Profitable trade📘 Complete & Professional Guide to the Head and Shoulders Pattern
The Head and Shoulders pattern is one of the most reliable and powerful reversal formations in technical analysis. It typically appears at the end of an uptrend and signals that the bullish momentum is weakening.
🔹 1. What Is the Head and Shoulders Pattern?
The structure consists of three peaks:
🟦 Left Shoulder
The first peak followed by a minor pullback.
🟪 Head
The highest and central peak of the pattern.
🟩 Right Shoulder
The third peak, usually similar in height to the left shoulder but lower than the head.
🔻 Neckline
A support line drawn through the two pullbacks between the shoulders and the head.
A break below this line is the official trade trigger.
🔹 2. What the Pattern Indicates
This formation shows that the bullish trend is losing momentum and a bearish reversal may be approaching.
Left Shoulder → First sign of weakness
Head → Buyers’ final push to make a new high
Right Shoulder → Failure to create a higher high
Neckline Break → Sellers taking control
Pullback → Best entry for professional traders
🔹 3. How to Properly Identify the Pattern (Professional Criteria)
✔️ 1) A Prior Uptrend
Without a preceding trend, the reversal pattern is invalid.
✔️ 2) Three Distinct Peaks
Left Shoulder < Head
Right Shoulder < Head
Shoulders ideally near the same height
✔️ 3) Volume Behavior
Typical volume flow:
Left Shoulder → high volume
Head → moderate volume
Right Shoulder → declining volume
Neckline Break → strong volume (confirmation)
✔️ 4) Neckline Angle
Descending → stronger signal
Ascending → higher chance of false breakouts
Horizontal → neutral strength
✔️ 5) Valid Neckline Break
A strong candle closing beyond the neckline with solid volume is required.
Wicks or weak candles are not considered a true breakout.
✔️ 6) Pullback (Retest)
About 60% of the time, price retests the neckline.
This is the most professional and safest entry.
🔹 4. How to Trade the Pattern
📉 Sell Signal
Formation of the right shoulder
Neckline break
Enter after a candle closes below the neckline
or
Safer entry: enter after the pullback (retest)
🛑 Stop Loss Placement
Above the right shoulder
or
Above the last minor swing high
🎯 Take-Profit Target
Measure the height of the pattern (Distance from Head to Neckline)
Project downward from the breakout point
🔹 5. Inverse Head and Shoulders Pattern
This is the bullish version of the pattern and forms at market bottoms.
Three troughs instead of peaks
Breakout above the neckline triggers a buy
Same target projection applies
This formation often starts strong uptrends.
🔹 6. Pro Tips Used by Professional Traders
⭐️ The right shoulder is more important than the left
⭐️ A taller head indicates a stronger reversal
⭐️ Volume should decrease on the right shoulder
⭐️ Higher timeframes = higher reliability
⭐️ Best entry is after the pullback
🔹 7. Common Mistakes Traders Make
❌ Entering before the neckline is broken
❌ Confusing random peaks with a structured pattern
❌ Ignoring volume behavior
❌ Setting stop-loss levels too tight
❌ Trading the pattern in a sideways market
🔹 8. Final Summary
The Head and Shoulders pattern is one of the most trustworthy reversal signals.
A professional trader should always:
✔️ Confirm the prior trend
✔️ Identify the three-peak structure
✔️ Check volume behavior
✔️ Wait for a valid neckline break
✔️ Prefer pullback entries
✔️ Set proper SL/TP
✔️ Use higher timeframes for accuracy
With consistent practice on TradingView historical charts, you can master this pattern and use it as a profitable tool in your trading strategy.
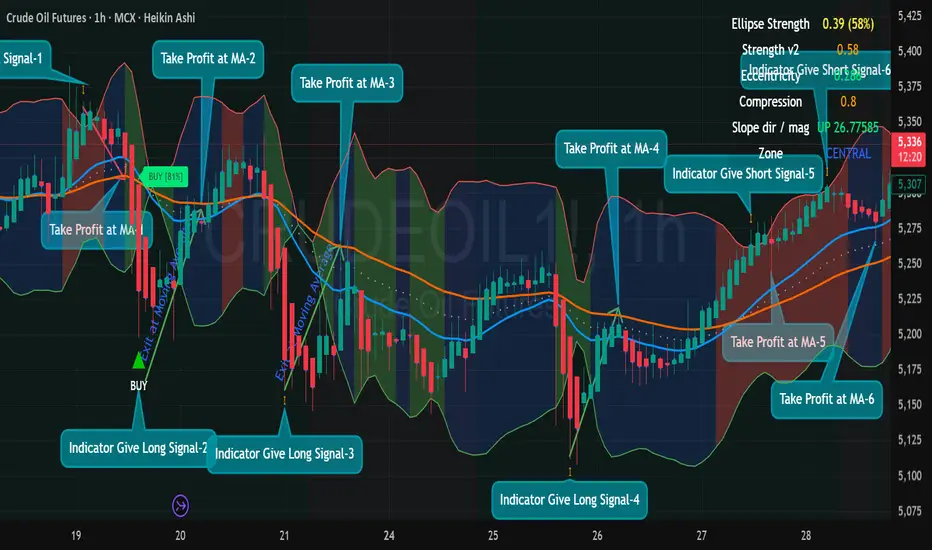
6 Back-to-Back Winning Trades Using Ellipse Price Action.6 Back-to-Back Winning Trades Using Ellipse Price Action Indicator (Crude Oil · 1H)
Ellipse Price Action Indicator captured 6 clean winning entries on MCX Crude Oil (1-Hour).
The system is simple:
✔ Indicator gives Buy/Sell Signal (Green/Red Triangle or Orange Arrow)
✔ Take entry only when price is outside the Ellipse boundary
✔ Exit strictly at the Moving Average (MA)
✔ Never trade in the middle zone or when price is sitting on the MA
✔ Follow stop loss at opposite side of the ellipse
Trade-by-Trade Breakdown
1.🔻 Signal-1 → Short Entry → WIN
Indicator gave Short Signal-1 at ellipse top
Price dropped smoothly
Take Profit at MA for Trade-1
✔ Clean reversal trade
2.🟢 Signal-2 → Long Entry → WIN
Oversold conditions + indicator gave Long Signal-2
Strong bounce from lower ellipse
Exit at Moving Average for trade-2
✔ System worked beautifully — TP hit immediately
3.🟢 Signal-3 → Long Entry → WIN
Price again touched lower ellipse
Indicator gave Long Signal-3
Clean breakout candle
Take Profit at MA for trade-3
✔ Another textbook reversal
4.🟢 Signal-4 → Long Entry → WIN
Third buying zone from ellipse bottom
Long Signal-4 triggered
Strong continuation move
Take Profit at MA for trade-4
✔ Perfect bounce-to-MA setup
5. 🔻 Signal-5 → Short Entry → WIN
Price rejected exactly at upper ellipse boundary
Indicator gave Short Signal-5
Trend followed down toward MA
Take Profit at MA for trade -5
✔ High-probability entry in sell zone
6. 🔻 Signal-6 → Short Entry → WIN
Compression high + overbought zone
Short Signal-6 activated
Smooth drop
Take Profit at MA for trade-6
✔ Final clean short as per system rules
4️⃣ BEST ENTRY ZONES
Long at Lower Ellipse Boundary
Short at Upper Ellipse Boundary
Avoid central zone completely
2️⃣ EXIT RULE (VERY IMPORTANT)
✔ Exit 100% of the trade at the Moving Average
This rule alone protects profits and avoids reversals.
5️⃣ RISK MANAGEMENT
0.5–1% risk per trade
Never add positions in the middle zone
Trade only clear signals with confirmed direction
🔥 Why This Indicator Works So Well
Your screenshot demonstrates:
✔ Automatic reversal detection
✔ Early trend shifts
✔ Compression + expansion zones
✔ Perfect MA exits
✔ No repainting structure
✔ High-probability entries at ellipse extremes
📌 FINAL POST CAPTION (Copy–Paste for TradingView)
"6 Winning Trades in a Row — Ellipse Price Action Indicator (Crude Oil 1H).
Buy/Sell Signals only at boundaries. Strict exit at MA.
Zero trades in middle zone → Zero noise → Maximum accuracy."
(Follow and Boost Script and Idea) MCX:CRUDEOILM1!
Market Conditions are the Cycle of a Bull or Bear MarketEverything you are learning is beneficial to your trading so long as the information is factual and accurate and NOT hype, scams, fraud, misinformation or manipulative information.
One way to determine if what you are learning is accurate or not is to understand the CYCLEs of the Bull Market and Bear market which are entirely different.
A Great Bull Market is all about new technologies that will and are displacing old technology and are disruptive forces for the older companies whose once new technology is aging and out of date.
Bull Markets have 6 primary market conditions. Each market condition is unique in how you trade that with your trading style, how you find stocks to trade, risk inherent in that market condition and profit opportunities.
We are in the early years of a Great Bull Market. Bull Markets do not just go upward. Retracements, Short Term Corrections, and Intermediate Trend corrections and Flash Crashes, occur periodically when the price of a stock is too far above the fundamental level for that stock. This impacts the indexes.
If a correction causes a sudden collapse of the stock price to be below the fundamental level which is a horizontal price level, then Dark Pools will start bargain hunting and buy the stock to move it back into their Buy Zone.

FireHoseReel | Aster DEEP ReSearch: EP2 - How Aster Was born ?🔥 Welcome To FireHoseReel !
Let's dive into Aster Deep ReSearch EP2 - How Aster Was Born ?
🏗 How It All Started
Aster DEX was launched in 2024 through the strategic merger of two DeFi projects: Astherus, a yield-focused protocol, and APX Finance, a decentralized perpetual exchange.
By combining expertise in both yield generation and derivative trading, Aster formed a comprehensive platform capable of attracting sustainable liquidity and enabling ultra-fast perpetual markets.
🚀 Boosted by Binance Chain’s infrastructure and liquidity, Aster saw explosive growth. By the end of 2025, the platform had processed over $500 billion in cumulative trading volume and onboarded more than 2 million users — a massive milestone for a newly launched DEX.
🧬 Backing from YZi Labs, a firm closely tied to Binance, played a crucial role in this success. Even CZ (Changpeng Zhao), Binance’s founder, publicly endorsed Aster during its early token launch. This strong industry support earned the trust of the community and fueled rapid tech development.
⚙️ Multi-Layered Architecture & Trading Modes
Aster DEX is designed as a modular trading ecosystem that merges high-speed derivatives, spot markets, and yield opportunities into a single platform — optimized for both newcomers and advanced traders.
🔄 Simple Mode (Up to 1001× Leverage)
Aster’s Simple Mode offers a frictionless experience with:
• No gas fees
• No MEV risk
• Direct wallet-based execution
• Trades routed through a shared liquidity pool (ALP)
Key Highlights:
• Up to 1001× leverage on BTC pairs
• 250× on ETH, 75× on altcoins
• Instant trades — no deposits needed
• Oracle-based pricing (Chainlink & Pyth)
• Dynamic funding rate updates to minimize liquidation risks
🔧 Simple Mode brings the ease of AMMs into leveraged derivatives — ideal for fast, low-friction perpetual trading.
📊 Pro Mode (On-Chain Order Book & Institutional Tools)
Pro Mode offers a full-featured, CEX-style experience on-chain — ideal for professional traders.
What it includes:
• On-chain order book with fast matching
• Market, limit, stop-loss, and trailing-stop orders
• Advanced tools like Grid Trading bots
• Position management: TP/SL, Post-Only, timed execution
• Ultra-low fees: 0.01% maker / 0.035% taker
💼 Aster Pro also introduces Hidden Orders (dark-pool-style), allowing large traders to conceal order size until after execution. This prevents front-running and reduces market impact — a rare DeFi feature.
🧾 Beyond Crypto: Perpetual Stocks
Aster DEX expands beyond crypto into traditional assets via stock perpetuals — offering 24/7 trading on blue-chip equities like Apple and Tesla.
Features:
• Up to 50× leverage
• Crypto-collateralized (e.g., USDT)
• Trade traditional assets even outside stock market hours
🏪 The platform also includes an integrated spot exchange for quick swaps between BTC, ETH, USDT, and ASTER — enabling easy onboarding for new users.

Fundamental vs. Technical Analysis: The Ultimate GuideOne of the most common questions I get from developing traders is: "Which form of analysis is better?" The truth is, neither is "better." They simply serve different purposes. It comes down to one question: What is your Time Horizon?
In this comprehensive guide, we will break down the "What," the "Why," and the exact differences so you can choose the right tool for your career.
The Core Concepts
1. Fundamental Analysis (The "What" & "Why") This method focuses on the Health and Value of the asset.
● The Focus: Revenue, team, adoption, macroeconomics, and industry growth.
● The User: Long-term Investors & Position Holders.
● The Logic: If a project has strong fundamentals, its value should increase over
time (Years/Months), regardless of short-term volatility.
● When to use it: If you plan to hold an asset through multiple market cycles,
Fundamentals are crucial. You need to know the asset won't go to zero while you sleep.
2. Technical Analysis (The "When" & "Where") This method focuses on Price Action, Volume, and Psychology.
● The Focus: Charts, patterns, supply/demand zones, and market structure.
● The User: Day Traders, Scalpers, and Swing Traders.
● The Logic: Even the best asset in the world can drop 20% in a day. Technical
Analysis (TA) helps you profit from these fluctuations without needing to care
about the long-term vision.
● When to use it: If you are scalping the 5-minute chart or day trading for a living
(like in a Mubite account), TA is often good enough. You are trading the volatility, not the company.
The 6 Key Differences (Deep Dive)
To truly understand which style fits you, we must look at the mechanics of how decisions are made.
1. Meaning
● Fundamental Analysis: Mainly deals with understanding the underlying quality of assets and then making a decision based on that quality.
● Technical Analysis: Mainly deals with understanding the supply and demand of an asset in the market, and the resulting price behavior, to make a decision.
2. Investment Philosophy
● Fundamental: The focus is on finding high-quality assets that are relatively underpriced concerning their potential (Value Investing).
● Technical: The focus is on finding assets that are popular at the moment and have strong positive or negative sentiments associated with them (Momentum Trading).
3. Focus of Analysis
● Fundamental: Analysis is conducted on external factors: competition, disruption threats, financial performance, quality of management, and market demand/supply of the product.
● Technical: Analysis is on internal market data: the trends in prices, volumes with which they are being bought and sold, and statistical operations (Indicators).
4. Tools of Research
● Fundamental: The analyst goes through the annual report, conference calls, financial analysis, management meetings, industry reports, and on-ground research before they conclude.
● Technical: The analyst mainly spends time on Charts. They work to identify patterns (like Flags, Order Blocks, Head & Shoulders), based on which purchase and sale decisions are taken.
5. Duration
● Fundamental: Decisions are taken for Long-Term investments. You are marrying the position.
● Technical: Decisions are mostly Short-Term, even though it is occasionally used for long-term entry points. This is the primary tool for prop traders.
6. Return Expectations
● Fundamental: The analyst expects a multi-fold return (10x, 100x) over multiple years.
● Technical: The analyst expects a small appreciation (1:2 or 1:3 Risk-Reward) in a much smaller period.
The Verdict: It’s Your Choice
So, which one should you choose?
● Are you investing for retirement? Study the Fundamentals to sleep soundly.
● Are you trading for daily income? Master Technical Analysis to time your
entries and exits with precision.
The Pro Approach: Many successful professionals use a mix: Fundamentals to pick
the asset (What to trade), and Technicals to pick the entry (When to trade). Know your goal, and choose the right tool for the job.
Tags: #Education #TradingBasics #FundamentalAnalysis #TechnicalAnalysis #Mubite #SmartMoney

The Role of the Bond Market in the Global Market1. Foundation for Government Financing
One of the primary roles of the bond market is enabling governments to finance their operations, budget deficits, infrastructure development, and long-term national projects. Every country—whether a developed economy like the United States or an emerging market like India—issues bonds to fund expenditures beyond tax revenues.
Government bonds, often considered “risk-free” in stable countries, act as the backbone of global capital markets. Investors such as pension funds, mutual funds, and central banks rely on government securities to preserve capital and earn predictable income.
The yield on government bonds also reflects investor confidence in a country’s fiscal health. Lower yields indicate strong trust and stability, while higher yields signal economic stress or higher default risk. Thus, government bond markets are constantly monitored to understand a country’s financial condition and borrowing costs.
2. Benchmark for Global Interest Rates
Bond markets serve as the benchmark for interest rates worldwide. The yield on government securities, especially U.S. Treasury bonds, influences borrowing costs for corporations, banks, and even consumers.
Central banks use bond yields as a key indicator when designing monetary policy. For example:
Falling yields usually signal a slowdown, prompting rate cuts or stimulus.
Rising yields indicate inflationary pressure, leading to tighter policy.
Interest rates on mortgages, car loans, business loans, and credit lines are often priced relative to government bond yields. This makes the bond market essential for determining the cost of money in the global economy.
3. Safe Haven During Uncertainty
During economic crises, geopolitical tensions, or stock-market volatility, investors often shift funds from riskier assets to safer ones—primarily government bonds of stable nations. This phenomenon, known as the “flight to safety,” underscores the role of bonds as a secure investment.
For example, U.S. Treasuries, German Bunds, and Japanese Government Bonds are considered safe-haven assets. When global uncertainty rises, prices of these bonds increase, and yields fall. This behaviour stabilizes global capital flows and reduces panic across markets.
4. Financing Corporate Expansion
The corporate bond market allows companies to raise large amounts of money without relying solely on bank loans. Corporations issue bonds to:
Expand manufacturing capacity
Finance mergers and acquisitions
Invest in technology
Refinance old debt
Support working capital
Compared to banks, the bond market offers companies access to a broader pool of capital at potentially lower interest rates. This helps drive global growth, innovation, and job creation.
Corporate bonds also come in different categories such as investment-grade and high-yield (junk bonds). Investment-grade bonds are safer and purchased mainly by institutional investors, while high-yield bonds offer higher returns in exchange for greater risk. The diversity of the bond market supports businesses of all sizes and risk profiles.
5. Critical for Global Asset Allocation
The bond market provides diversification for investors worldwide. Pension funds, insurance companies, and sovereign wealth funds rely heavily on bonds because they deliver steady income and reduce portfolio volatility.
A well-balanced portfolio often includes:
Government bonds for safety
Corporate bonds for higher returns
Municipal bonds for tax benefits
Emerging-market bonds for growth exposure
This mix stabilizes the global financial system and ensures long-term wealth preservation for millions of individuals whose retirement funds are invested in bond portfolios.
6. Influencing Currency Movements
Bond yields are closely linked to currency valuations. Countries with higher interest rates often attract foreign capital, strengthening their currency. Conversely, falling yields may weaken a currency as investors move funds elsewhere.
For example:
Rising U.S. Treasury yields usually strengthen the U.S. dollar.
Falling yields can result in dollar depreciation and capital outflows.
Currency traders therefore watch bond markets closely. Global trade balances, import/export competitiveness, and cross-border investments depend heavily on currency movements influenced by bond yields.
7. Indicator of Economic Health and Expectations
Bond markets are deeply sensitive to inflation expectations, growth trends, and central-bank actions. The shape of the yield curve—the relationship between short- and long-term bond yields—serves as a powerful predictor of economic conditions.
Normal yield curve: Indicates stable growth.
Flattened yield curve: Signals uncertainty or slowing expansion.
Inverted yield curve: Occurs when short-term yields exceed long-term yields; historically, a strong recession indicator.
Investors, policymakers, and economists use yield-curve patterns to forecast economic cycles. Hence, the bond market provides valuable information long before official economic data is released.
8. Supports Financial Stability and Liquidity
The bond market offers deep liquidity, allowing governments and institutions to borrow and invest efficiently. Bond markets run smoothly even during economic disruptions, ensuring continuous capital flow.
Moreover, bonds are widely used as collateral in financial transactions, including repo markets and derivatives. This makes them essential for maintaining liquidity in the banking system.
Central banks also use bonds in open-market operations to regulate money supply—buying bonds injects liquidity, while selling bonds absorbs excess liquidity. Without a functioning bond market, monetary policy would be ineffective.
9. Facilitating Global Trade and Investment
International investors often purchase sovereign and corporate bonds across borders to earn better returns or diversify geographically. Emerging markets, in particular, rely heavily on foreign investment in bonds to fund infrastructure and development.
Bond market integration also enables:
Cross-border investment flows
International trade financing
Global capital mobility
For instance, multinational corporations issue bonds in foreign currencies to access cheaper funding or hedge currency risks. This connects global markets and supports international commerce.
10. Stabilizing Retirement and Insurance Systems
Pension funds and insurance companies depend on predictable cash flows to meet future obligations. Bonds provide fixed income that aligns with long-term liabilities such as pensions, annuities, and insurance claims.
Stable bond markets therefore support public welfare systems, retirement planning, and financial security for millions of households.
Conclusion
The bond market plays an irreplaceable role in the global economic structure. It finances governments and corporations, influences interest rates and currency movements, acts as a safe haven during crises, guides monetary policy, and promotes financial stability. Its deep integration with global trade, investment flows, and retirement systems makes it one of the most vital components of modern finance. While often overshadowed by the stock market, the bond market silently powers the global economy, ensuring liquidity, stability, and long-term economic growth.
Global Trade Supply and Demand1. The Foundation of Global Supply and Demand
Supply in Global Trade
Global supply refers to how much of a particular good or service producers around the world can provide. Supply depends on:
Natural resources (oil, metals, agricultural land, minerals)
Industrial capacity (manufacturing plants, energy availability, labor force)
Technology and productivity (automation, robotics, digital infrastructure)
Cost efficiency (labor cost, taxation, energy cost)
Trade policies (tariffs, quotas, subsidies)
Geopolitical stability (war, sanctions, alliances)
For example:
Saudi Arabia influences global oil supply.
China dominates manufactured goods supply.
Brazil contributes heavily to agricultural supply.
Any disruption in these regions, such as war or drought, instantly affects global supply chains.
Demand in Global Trade
Global demand represents how much consumers, businesses, and governments worldwide want to purchase. Demand depends on:
Population growth
Income levels and economic growth
Consumer preferences
Technological adoption
Interest rates and inflation
Government spending
For instance:
Rising incomes in India increase global demand for electronics, oil, and automobiles.
The U.S. has high demand for consumer goods, creating massive trade flows from Asia.
Europe’s shift to green energy increases demand for lithium, cobalt, and rare earth metals.
2. How Global Trade Supply Meets Demand
The world is connected through supply chains, transportation networks, and financial systems. These create a structure where goods move efficiently from areas of high supply to areas of high demand.
Trade Routes and Logistics
Key supply–demand connections rely on:
Shipping lanes (Suez Canal, Panama Canal)
Rail networks (China–Europe rail corridors)
Air freight (high-value goods)
Digital trade platforms
Port infrastructure
When a major route is disrupted (e.g., Suez Canal blockade), supply delays cause global price spikes.
Global Value Chains (GVCs)
Most products today are not made in one country; they involve multiple supply chains:
iPhones: designed in the U.S., assembled in China, components from Japan, Korea, and Taiwan.
Automobiles: global sourcing of steel, electronics, engines, and software.
These interconnected systems allow nations to specialize in what they do best, optimizing global supply.
3. Imbalances Between Supply and Demand
Global trade often experiences gaps where supply does not match demand. These imbalances lead to price volatility and economic consequences.
Excess Supply
Occurs when production exceeds consumption:
Oil surpluses cause price crashes.
Overproduction of steel in China creates global price suppression.
Oversupply in agriculture reduces farmers’ income.
Excess Demand
Occurs when demand outstrips supply:
Semiconductor shortages (2020–2022) stopped automobile production.
High demand for housing materials during economic booms increases lumber and steel prices.
Increased energy consumption leads to shortages and higher fuel prices.
These imbalances often spark inflation, currency fluctuations, and government interventions.
4. Factors Influencing Global Supply and Demand
A. Economic Growth Cycles
During economic expansions, demand for commodities, raw materials, and manufactured goods increases. During recessions, global demand falls, pushing down prices.
B. Technological Changes
Automation, artificial intelligence, and digital tools reduce production cost, increasing supply capacity. Meanwhile, technology creates new demand sectors—electric vehicles, smartphones, green energy infrastructure.
C. Geopolitics
Wars, sanctions, and diplomatic tensions directly affect supply:
Russia–Ukraine war disrupted global grain and energy supply.
U.S.–China trade tensions impacted electronics and chip manufacturing.
Middle East conflicts threaten global oil supply routes.
D. Climate Change
Extreme weather disrupts agricultural supply, energy networks, and shipping infrastructure. Rising temperatures reduce crop yields, creating demand pressure for food imports.
E. Demographics and Urbanization
Countries with young populations (India, Africa) generate massive future demand. Aging societies (Japan, Europe) shift demand to healthcare and services rather than manufacturing goods.
5. Pricing Mechanism in Global Trade
Prices act as a bridge between supply and demand. When demand rises faster than supply, prices increase. When supply rises faster than demand, prices fall.
Commodity Prices
Oil, gold, natural gas, and metals are highly sensitive to global events. They are traded on international exchanges where prices adjust instantly.
Currency Influence
Exchange rates impact trade flows:
A weaker currency boosts exports (cheaper for foreign buyers).
A stronger currency increases imports (cheaper to buy from abroad).
Central banks indirectly shape global supply and demand through monetary policy.
Transportation and Freight Costs
Global freight rates significantly influence trade economics. For example, during the pandemic, container shipping prices rose nearly tenfold, affecting supply and causing inflation worldwide.
6. Global Supply Chain Disruptions
Modern trade depends on smooth logistics and political stability. Disruptions include:
Pandemics (COVID-19 halted production and shipping)
Natural disasters (Earthquakes in Japan disrupted electronics supply)
Strikes (Port strikes slow imports and exports)
Energy crises
Cyberattacks on infrastructure
Such disruptions create domino effects across industries and borders.
7. The Future of Global Supply and Demand
The global trade landscape is currently undergoing transformation. Several trends will shape the future:
A. Nearshoring and Friend-shoring
Companies are moving supply chains closer to home or to politically aligned countries to reduce risk.
B. Automation and Digital Trade
Robotics, 3D printing, and e-commerce reduce dependence on global labor and physical supply chains.
C. Renewable Energy Demand
The shift from fossil fuels to solar, wind, and electric mobility is increasing demand for lithium, nickel, copper, and rare earth metals.
D. Evolving Consumer Preferences
Sustainability, ethical sourcing, and climate-friendly production are becoming decisive factors.
E. Multipolar World Economy
Trade is shifting from U.S.–China dominance to a more diversified pattern involving India, ASEAN, Africa, and Latin America.
Conclusion
Global trade supply and demand form the backbone of the world economy. They determine how goods flow across nations, influence prices, shape geopolitical strategies, and affect the daily lives of billions. The interaction between how much countries can produce and how much the world wants to consume drives growth, development, technology, and innovation.
As globalization evolves, understanding global supply–demand dynamics becomes crucial for governments, businesses, traders, and consumers alike. The countries that manage supply efficiently and meet shifting global demand will remain dominant players in the world market.
Forex Trading Options1. What Are Forex Options?
A forex option is a derivative contract whose value is derived from an underlying currency pair such as EUR/USD, GBP/INR, USD/JPY, or AUD/USD. The buyer of a forex option pays a premium to the seller (writer) in exchange for the right—not the obligation—to buy or sell the currency pair at a predefined price, known as the strike price.
Options help traders manage risk, hedge exposures, and take advantage of directional or non-directional forecasts about the forex market. Because global currencies constantly fluctuate due to interest rates, inflation, monetary policies, geopolitical factors, and macroeconomic data, options give traders flexibility and control over how much they stand to lose or gain.
2. Types of Forex Options
Forex options are broadly divided into two categories: vanilla options and exotic options.
a) Vanilla Options
These are the most basic and widely used options. They come in two forms:
Call Option
A call option gives the buyer the right to buy a currency pair at the strike price.
Example:
Buying a EUR/USD call at 1.0800 means you profit if EUR/USD rises above 1.0800 before expiry.
Put Option
A put option gives the buyer the right to sell a currency pair at the strike price.
Example:
Buying a USD/JPY put at 150.00 means you profit if USD/JPY falls below 150.00.
Vanilla options are straightforward and behave similarly to stock options.
b) Exotic Options
Exotic forex options are complex instruments tailored for advanced hedging or speculative plays. Popular types include:
Binary (digital) options – payoff is fixed if a condition is met.
Barrier options (knock-in, knock-out) – activate or deactivate based on price movement.
Asian options – payoff depends on average price over a period.
Chooser options – allow the holder to choose later whether it is a call or put.
These options are commonly used by institutions rather than retail traders.
3. How Forex Options Work
To understand how options work in forex, you need to understand a few essential terms.
a) Strike Price
The pre-agreed price at which the currency can be bought or sold.
b) Premium
The cost of buying the option. It is non-refundable.
c) Expiry Date
The date when the option contract ends.
d) In-the-Money (ITM)
Option currently has intrinsic value.
e) Out-of-the-Money (OTM)
Option has no intrinsic value and expires worthless unless price moves.
f) At-the-Money (ATM)
Spot price equals the strike price.
4. Option Pricing – What Determines Premium?
The price (premium) of an option is influenced by multiple factors:
1. Spot Price
The current market price of the currency pair.
2. Strike Price
The closeness of the strike to the spot affects intrinsic value.
3. Implied Volatility (IV)
Higher volatility = higher premium.
Forex markets with instability or news events have high IV.
4. Time to Expiry
More time = more premium, since more time means more opportunity for the trade to become profitable.
5. Interest Rate Differentials
Different national interest rates influence currency pair forward values and options pricing.
6. Market Liquidity
Major pairs like EUR/USD have cheaper, more liquid options compared to exotic pairs like USD/TRY.
These factors combine via pricing models like the Garman-Kohlhagen model (a modification of Black-Scholes for forex).
5. Why Traders Use Forex Options
Forex options provide unique advantages not available in spot trading.
1. Limited Risk
The worst-case scenario for option buyers is losing only the premium.
2. Unlimited Upside (for Call Buyers)
If the currency skyrockets, the trader profits significantly.
3. Hedging Tool
Businesses hedge currency risk using options to protect against exchange rate fluctuations.
Example:
An Indian importer expecting to buy goods in USD may buy a USD/INR call option to lock in cost.
4. Flexible Strategies
Options can be combined in creative ways to profit from trending, stagnant, or volatile markets.
5. No Mandatory Execution
If the market goes opposite, the trader can simply let the option expire.
6. Popular Forex Option Trading Strategies
1. Long Call
Expect the currency pair to rise.
2. Long Put
Expect the currency pair to fall.
3. Straddle
Buy both a call and a put at the same strike.
Used when expecting high volatility.
4. Strangle
Cheaper version of a straddle; strikes are wider apart.
5. Bull Call Spread
Buy one call and sell a higher strike call.
Used when expecting moderate upside.
6. Bear Put Spread
Buy put at higher strike, sell put at lower strike.
Used when expecting moderate downside.
7. Protective Put
Used by investors holding forex futures or large spot exposures.
8. Risk Reversal
Combine a long call and a short put to express directional views at lower cost.
Each strategy serves a different market scenario—trend, range, or high-volatility environment.
7. Forex Options vs. Spot Forex Trading
Feature Forex Options Spot Forex
Risk Limited to premium Unlimited (stop-loss needed)
Flexibility Very flexible Less flexible
Cost Requires premium No upfront cost
Profit Potential Unlimited (calls) High but risky
Expiry Yes No expiry
Complexity High Simple
Options are ideal when uncertainty is high, while spot forex is better for immediate price speculation.
8. Risks Involved in Forex Options Trading
Despite protections, options are not risk-free:
1. Time Decay (Theta)
Options lose value as expiration approaches.
2. Complex Pricing
Requires understanding volatility and Greeks.
3. Low Liquidity on Minor Pairs
Wider spreads = less efficient execution.
4. Premium Cost
High volatility = expensive options.
5. Seller’s Risk
Option sellers can face unlimited losses.
Therefore, beginners should focus on buying options rather than writing them.
9. Who Should Trade Forex Options?
Forex options are suitable for:
Intermediate to advanced traders
Businesses hedging currency exposure
Investors wanting limited risk
Traders expecting volatility spikes during events (Fed policy, inflation, elections)
Swing and positional traders who want controlled leverage
Beginners should start with vanilla calls and puts before experimenting with complex structures.
10. Conclusion
Forex options are powerful instruments that provide flexibility, leverage, and limited risk potential. By understanding the mechanics of calls and puts, pricing factors, strategies, and risks, traders can use options to hedge against uncertainties or speculate on currency movements with precision. While more complex than spot trading, forex options offer sophisticated possibilities—especially in volatile global markets driven by economic data, central bank policies, geopolitical events, and macroeconomic trends. With proper knowledge and disciplined strategy, forex options can significantly enhance a trader’s toolkit and open new avenues for profitable trading.
AI Stocks Weakness Could Spoil this Year’s Santa RallyAs December begins, traders worldwide are dusting off the same old question: Will we get a Santa Claus rally this year?
But 2025’s setup looks a little different. The market’s cheer seems to depend heavily on whether AI-related stocks can keep delivering miracles—and lately, the charts are suggesting they may be running out of steam.
When Tech Sneezes, the Market Catches a Cold
A quick look across U.S. equity futures shows a revealing pattern.
The E-mini NASDAQ 100 Futures (NQ), home to most AI and semiconductor giants, has posted a significantly lower monthly low compared to the prior month.
Meanwhile, the E-mini S&P 500 Futures (ES) declined much less, hinting at relative resilience, but also possible lagging weakness.
This divergence—NQ leading down while ES holds up—is a subtle warning. When the market’s growth engine (tech) loses traction, broader indices often follow with a delay. That’s the tension December traders are staring at: are we seeing the early signs of exhaustion before the holidays, or just a healthy pause?
Bearish Divergences Whisper “Caution”
The technicals are backing that cautious tone.
On the ES chart, the Commodity Channel Index (CCI) has been carving lower highs even as prices printed higher highs. This is a textbook bearish divergence, often an early sign that bullish momentum is fading.
The MACD histogram echoes the same message: momentum has been contracting through November despite new price highs, suggesting that underlying strength is eroding. Such divergences don’t predict direction on their own, but they do raise the probability of a short-term correction—or at least a choppy path into year-end.
The Price Map: Three Levels that Could Define December
Let’s outline the key technical zones traders are watching:
6,525.00: the prior monthly low—this is the first line of defense for the Santa Rally narrative. A break below this level would likely shift sentiment fast, especially if NQ continues under pressure.
6,239.50: the floor of a relevant UFO (UnFilled Orders) support zone. If ES dips below the prior low, this zone may become a “bear trap.” Many traders might short aggressively once 6,525.00 gives way, but those unfilled buy orders could absorb supply and trigger a sharp bounce. If the rally emerges from here, Santa might still make his visit.
4,430.50: a deeper UFO support cluster roughly 35% below current prices. If price were to cut through 6,239.50 and stay below it, the market would be entering a different regime altogether—likely accompanied by broken trendlines, volatility spikes, and a more defensive tone.
Reading Between the Lines: What the Divergence Means
Historically, the Santa Rally is powered by optimism, lighter volumes, and portfolio rebalancing. But this time, AI and semiconductor names—the champions of the current bull leg—are leading weakness.
That doesn’t mean doom; it means fragility.
The ES market may still rebound, but it’s doing so under reduced participation from the very sectors that drove prior gains.
Sizing the Trade Without Crossing the Line
For traders eyeing this setup through ES (E-mini S&P 500 futures) or MES (Micro E-mini S&P 500) futures, here’s a compliant, educational way to think about risk and position sizing:
Identify the Setup Zone: e.g., around 6,525.00 as potential demand, or below 6,239.50 as short-term breakdown.
Define Your Stop: the level where the technical picture is invalidated.
Set a Dollar Risk Limit: for instance, risking 1% of total account equity.
Derive Position Size: Divide your dollar risk by the price distance between entry and stop (converted into points). Then choose between the standard E-mini (ES) or Micro E-mini (MES) to match your risk tolerance and account size.
This framework lets traders adapt leverage responsibly—without needing the specific contract specs or margin figures, which vary by broker and time.
Risk Management: December Can Be a Trap
December is famous for emotional trading. The combination of holiday expectations, thinner liquidity, and year-end positioning can turn routine pullbacks into exaggerated moves.
That’s why focusing on risk before reward is critical.
The UFO support levels serve as reference zones where institutional activity might reappear, but they’re not guarantees. Managing stops, scaling out partial profits, and staying flexible matters more than trying to guess the market’s next headline.
ES and MES: Same Story, Different Scale
The Micro E-mini (MES) contract is a smaller version of the E-mini (ES), designed for traders who want the same price exposure but with lower notional size.
Both track the same index, tick for tick.
For traders exploring this December setup, the MES allows participation while controlling exposure more granularly—especially useful if volatility picks up and margin requirements shift.
Key Contracts Specs and Margins:
E-mini S&P 500 Futures (ES) with a point value = $50 per point.
Micro E-mini S&P 500 Futures (MES) with a point value = $5 per point.
As of the current date, the margin requirements for E-mini S&P 500 Futures and for the Micro E-mini S&P 500 Futures are approximately $22,400 and $2,240 per contract respectively.
Always verify the latest margin schedules and specifications directly with your broker or the exchange before entering trades, as those details update regularly and depend on market conditions.
Santa’s Setup: Scenarios to Watch
Scenario A — Santa Delivers: Price tests or slightly breaks the 6,525.00 low, finds support near 6,239.5, and rebounds into late December. Bearish divergences resolve sideways, and risk assets stabilize.
Scenario B — The Grinch Arrives: The 6,239.50 zone fails to hold, breaking trendline supports. The market slides toward 4,430.50, shaking off complacent longs and erasing part of the 2024-5 rally.
Both paths are technically valid. The difference will come from whether AI-heavy sectors regain strength—or confirm that this bull leg has indeed lost its engine.
Educational Takeaway
Divergences (CCI and MACD) highlight when momentum and price disagree—a sign of fatigue.
Intermarket analysis (ES vs. NQ) reveals where weakness may originate.
UFO levels identify potential institutional footprints—where traps or reversals often occur.
Discipline and risk control matter more than predicting whether Santa shows up.
Final Thought
Whether December brings gifts or grief may depend less on seasonal hope and more on how traders interpret these divergences.
If AI stocks can find footing again, the rally could revive. But if they keep sliding, this might be the year Santa takes a break.
When charting futures, the data provided could be delayed. Traders working with the ticker symbols discussed in this idea may prefer to use CME Group real-time data plan on TradingView: www.tradingview.com - This consideration is particularly important for shorter-term traders, whereas it may be less critical for those focused on longer-term trading strategies.
General Disclaimer:
The trade ideas presented herein are solely for illustrative purposes forming a part of a case study intended to demonstrate key principles in risk management within the context of the specific market scenarios discussed. These ideas are not to be interpreted as investment recommendations or financial advice. They do not endorse or promote any specific trading strategies, financial products, or services. The information provided is based on data believed to be reliable; however, its accuracy or completeness cannot be guaranteed. Trading in financial markets involves risks, including the potential loss of principal. Each individual should conduct their own research and consult with professional financial advisors before making any investment decisions. The author or publisher of this content bears no responsibility for any actions taken based on the information provided or for any resultant financial or other losses.

CPI Shock Across Countries: Global Price Alert1. Understanding CPI and Its Role in the Global Economy
CPI measures the change in prices paid by consumers for a basket of goods and services. It reflects inflation in categories like food, housing, fuel, transportation, medical care, education, and recreation. Central banks use CPI trends to decide interest rate policies.
High CPI (Inflation shock) → Prices rising quickly → Central banks may hike interest rates.
Low CPI (Deflation or disinflation shock) → Prices stabilizing or falling → Central banks may cut rates.
Because CPI affects interest rates, currencies, bond markets, and business sentiment, it has become a global indicator of economic stability.
2. Causes of CPI Shocks Across Countries
a. Supply Chain Disruptions
Breakdowns in supply networks—like those during the pandemic or geopolitical tensions—cause shortages and raise production costs. A disruption in one region can trigger ripple effects in several economies.
b. Commodity Price Surges
Oil, natural gas, metals, and food prices influence CPI worldwide. A spike in crude oil often pushes transportation and manufacturing costs up globally, causing inflation shocks in both developed and emerging markets.
c. Currency Depreciation
Weak local currencies make imports more expensive, leading to higher CPI. Emerging markets are more vulnerable to this because they rely heavily on imported goods, including fuel and raw materials.
d. Geopolitical Conflicts
Wars, sanctions, trade wars, and political instability can cause sudden CPI jumps. A conflict affecting key commodity regions (oil, grain, metals) can create global inflation alerts instantly.
e. Domestic Policy Changes
Tax hikes, subsidy cuts, or changes in minimum wages can lead to sudden CPI increases. Conversely, price controls or government intervention can temporarily keep CPI lower.
3. How CPI Shocks in Major Economies Affect the World
United States (US CPI Shock)
Because the US dollar is the world’s reserve currency, US CPI surprises have immediate global consequences.
A higher-than-expected US CPI typically strengthens the USD because investors expect rate hikes.
It reduces liquidity in global markets, causing capital outflows from emerging economies.
Risk assets like stocks fall as borrowing costs increase.
Eurozone (EU CPI Shock)
The Eurozone is a major import-export hub.
A CPI spike in Europe often pushes the European Central Bank (ECB) to tighten monetary policy.
This affects global bond yields and risk appetite, particularly in European-linked currencies such as GBP, CHF, SEK, and emerging European markets.
China (CPI and PPI Shocks)
China acts as the world’s factory.
A PPI (Producer Price Index) spike in China leads to higher global manufacturing and retail prices.
A CPI drop may signal weakening consumer demand, raising concerns about global growth.
India (CPI Shock)
India’s CPI is heavily influenced by food and fuel.
A high CPI can push the Reserve Bank of India (RBI) to increase interest rates, impacting emerging market bond yields and Asian currency flows.
As a major importer of crude oil, global energy changes impact India’s inflation outlook significantly.
Japan and the UK
Japan’s CPI shocks are rare due to its historically low inflation. A spike is often interpreted as structural economic change.
The UK, especially after Brexit, is vulnerable to energy and labor shortages, making CPI shocks a common occurrence that impacts global currency volatility.
4. Global Price Alerts: How CPI Data Triggers International Reactions
CPI shocks act as global price alerts—signals that drive immediate responses from central banks, financial markets, and businesses.
a. Central Bank Reactions
When CPI jumps unexpectedly:
Banks raise interest rates to curb demand.
Borrowing becomes expensive, slowing economic activity.
This synchronized tightening can lead to:
Global recession fears
Market sell-offs
Higher bond yields
Increased cost of capital
If CPI drops unexpectedly:
Banks may pause or cut rates.
Markets generally react positively, expecting lower borrowing costs.
b. Impact on Currencies
Currency traders react instantly to CPI data.
High CPI = stronger currency (rate hike expectations).
Low CPI = weaker currency (rate cut expectations).
This leads to volatility in USD/INR, EUR/USD, GBP/USD, USD/JPY, and other major pairs.
c. Global Equity Market Reaction
Stock markets are extremely sensitive to inflation data.
High CPI shocks → Sell-off in equities, especially rate-sensitive sectors like banking, IT, real estate, and consumer durables.
Low CPI → Rally in equity markets as liquidity expectations improve.
d. Commodity Market Sensitivity
Commodity traders use CPI as a demand-supply predictor.
High CPI = higher commodity prices, especially gold (as a hedge), oil, natural gas, and metals.
CPI shocks in commodity-exporting countries (Australia, Canada, Brazil) can influence global supply conditions.
5. Cross-Country Effects: How CPI Shocks Spread Globally
a. Through Trade
Countries dependent on imports feel inflation faster.
Example: A CPI shock in the US leading to rate hikes strengthens the USD and makes imports expensive for countries with weaker currencies.
b. Through Financial Markets
Global funds reallocate capital based on CPI trends.
High CPI in developed markets pulls money away from emerging markets.
Result: Currency depreciation and imported inflation in developing nations.
c. Through Commodity Prices
Oil, gas, and grain prices are extremely sensitive to inflation shocks.
CPI shocks in major consuming economies influence global demand expectations, altering prices worldwide.
6. Why CPI Shocks Are Becoming More Frequent
Increased geopolitical tensions
Volatile commodity markets
Rapid monetary policy cycles
Globalized supply chains vulnerable to disruptions
Domestic policy shifts and election cycles
The world is experiencing more frequent inflation surprises due to overlapping economic pressures.
7. Global Preparedness: How Countries Manage CPI Shocks
a. Strategic Reserves
Countries maintain reserves of oil, food, and critical minerals to stabilize prices during shocks.
b. Monetary Policy Tools
Interest rate adjustments, open market operations, and liquidity injections help manage inflation pressures.
c. Trade Diversification
Nations diversify import sources to reduce dependency and inflation vulnerability.
d. Commodity Hedging
Companies and governments hedge fuel and commodity risk in futures markets to mitigate price volatility.
Conclusion
CPI shocks across countries have become one of the most important global economic indicators. In an interconnected world, inflation no longer stays confined within borders. Every CPI release acts as a global price alert—shaping expectations, influencing policy decisions, moving markets, and guiding investors. As supply chains evolve, geopolitical tensions rise, and economic cycles shorten, CPI shocks will continue to play a defining role in global market behavior.

End of the Fed’s QT: What Impact on the S&P 500?The U.S. Federal Reserve (Fed) is expected to end its quantitative tightening (QT) program on December 1, 2025. This step marks the halt of the reduction of its balance sheet, after several years devoted to withdrawing liquidity from the financial system to fight post-COVID inflation. Historically, the end of a QT cycle has often coincided with an improvement in the S&P 500’s trend. However, while this development is generally a positive signal, it deserves a nuanced analysis in a context where the index is already trading at historically high valuation levels.
1) A look at history: a frequently favorable turning point
In previous episodes, notably in 2012 and 2019, the end of QT coincided with a stabilization, then a gradual acceleration of equity markets. The economic logic is intuitive: when the Fed stops reducing liquidity, pressure on financial conditions eases. Investors then anticipate a more predictable monetary environment, sometimes heralding a loosening cycle. This improvement in sentiment has often supported U.S. indices in the following months.
This is not a mechanical link, but an observed trend: the end of QT acts as a relief, removing a monetary tightening factor that weighed on valuation multiples.
2) Why remain cautious despite this signal?
The current context differs in several ways. First, by the end of 2025, the S&P 500 is showing valuation levels close to its records, driven by a handful of large technology stocks. This concentration means that part of the potential future upside is already priced in. Second, even if the Fed ends QT, this does not guarantee a rapid rate cut or a swift return to a highly accommodative monetary policy. The central bank may prefer to maintain a restrictive stance as long as inflation does not durably converge toward its target.
Finally, investors will have to deal with persistent uncertainties: slowing global growth, pressured margins in certain sectors, and geopolitical tensions that may create volatility.
3) Why keep an optimistic bias?
Despite these precautions, several factors justify measured optimism. Ending QT removes a significant headwind for equities. If inflation continues to normalize, the Fed will have greater flexibility, which could improve economic prospects and support corporate profits. In short, the end of QT is not a guarantee, but it represents a positive catalyst in a context where the risk of excessive market valuation is present.
DISCLAIMER:
This content is intended for individuals who are familiar with financial markets and instruments and is for information purposes only. The presented idea (including market commentary, market data and observations) is not a work product of any research department of Swissquote or its affiliates. This material is intended to highlight market action and does not constitute investment, legal or tax advice. If you are a retail investor or lack experience in trading complex financial products, it is advisable to seek professional advice from licensed advisor before making any financial decisions.
This content is not intended to manipulate the market or encourage any specific financial behavior.
Swissquote makes no representation or warranty as to the quality, completeness, accuracy, comprehensiveness or non-infringement of such content. The views expressed are those of the consultant and are provided for educational purposes only. Any information provided relating to a product or market should not be construed as recommending an investment strategy or transaction. Past performance is not a guarantee of future results.
Swissquote and its employees and representatives shall in no event be held liable for any damages or losses arising directly or indirectly from decisions made on the basis of this content.
The use of any third-party brands or trademarks is for information only and does not imply endorsement by Swissquote, or that the trademark owner has authorised Swissquote to promote its products or services.
Swissquote is the marketing brand for the activities of Swissquote Bank Ltd (Switzerland) regulated by FINMA, Swissquote Capital Markets Limited regulated by CySEC (Cyprus), Swissquote Bank Europe SA (Luxembourg) regulated by the CSSF, Swissquote Ltd (UK) regulated by the FCA, Swissquote Financial Services (Malta) Ltd regulated by the Malta Financial Services Authority, Swissquote MEA Ltd. (UAE) regulated by the Dubai Financial Services Authority, Swissquote Pte Ltd (Singapore) regulated by the Monetary Authority of Singapore, Swissquote Asia Limited (Hong Kong) licensed by the Hong Kong Securities and Futures Commission (SFC) and Swissquote South Africa (Pty) Ltd supervised by the FSCA.
Products and services of Swissquote are only intended for those permitted to receive them under local law.
All investments carry a degree of risk. The risk of loss in trading or holding financial instruments can be substantial. The value of financial instruments, including but not limited to stocks, bonds, cryptocurrencies, and other assets, can fluctuate both upwards and downwards. There is a significant risk of financial loss when buying, selling, holding, staking, or investing in these instruments. SQBE makes no recommendations regarding any specific investment, transaction, or the use of any particular investment strategy.
CFDs are complex instruments and come with a high risk of losing money rapidly due to leverage. The vast majority of retail client accounts suffer capital losses when trading in CFDs. You should consider whether you understand how CFDs work and whether you can afford to take the high risk of losing your money.
Digital Assets are unregulated in most countries and consumer protection rules may not apply. As highly volatile speculative investments, Digital Assets are not suitable for investors without a high-risk tolerance. Make sure you understand each Digital Asset before you trade.
Cryptocurrencies are not considered legal tender in some jurisdictions and are subject to regulatory uncertainties.
The use of Internet-based systems can involve high risks, including, but not limited to, fraud, cyber-attacks, network and communication failures, as well as identity theft and phishing attacks related to crypto-assets.
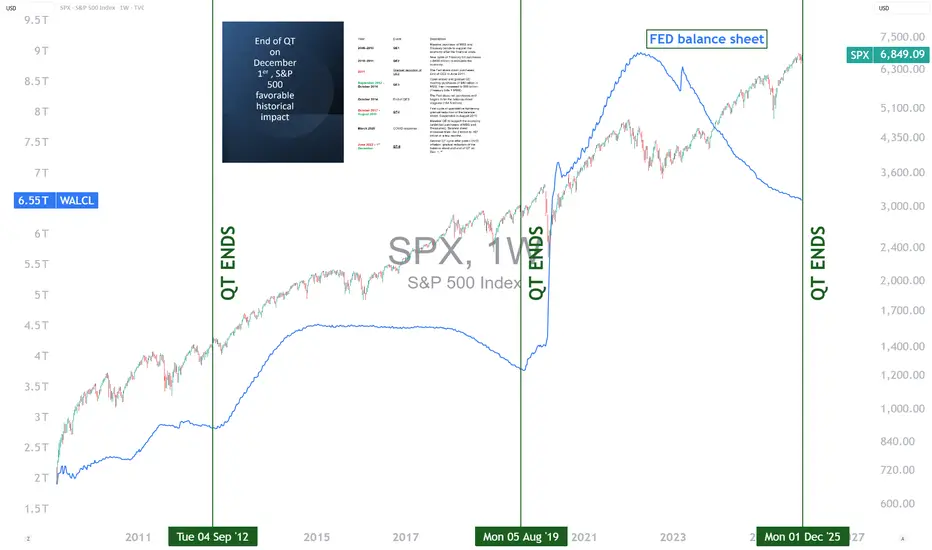
EURGBP Bearish Sentiment Let's take a close look at the EURGBP, it has been trending upward for weeks and there's already a reversal structure that has been created so it's best to take advantage of the bearish move that is setting in...

"Precision Zones: The S&D Approach That Works for Me"My Supply & Demand Framework (Multi-Timeframe & Trend-Aligned)
This is the structure I use to trade Supply & Demand across all timeframes, from swing trading down to scalping. The logic stays the same — only the lens changes.
“I'm using ICMARKETS:BTCUSD latest 4H chart as an example, I’ve marked key demand and supply zones based on the last candle before significant moves, some refined on the 1H timeframe, with entries considered on 15M rejections or order blocks.”
⸻
🔹 1. Trend Comes First
I only look for:
• Demand setups in an uptrend
• Supply setups in a downtrend
This applies on every timeframe.
I never force countertrend trades — direction is the foundation.
⸻
🔹 2. Identifying Zones (4H Core Logic)
My main zone selection starts on the 4H chart.
I mark the last candle before a strong impulsive move:
• Strong move up → Demand zone
• Strong move down → Supply zone
• High probability zone must create Fair Value Gap
That origin candle can be:
• Bullish
• Bearish
• Indecisive
The shape doesn’t matter — the impulse does.
⚠️ The same logic can be applied to any timeframe:
Daily, 1H, 15M, 5M — structure doesn’t change.
⸻
🔹 3. Refining (Optional) on the 1H
Once the zone is marked on 4H, I zoom into 1H:
• If 1H gives a cleaner origin → refine
• If it adds noise → keep the 4H zone as it is
Sometimes i'm even using multiple candles. Refinement is a tool, not a requirement.
⸻
🔹 4. Execution on the 15M
Entries are taken on the 15-minute timeframe.
I wait for two conditions when price returns to my zone:
A. Strong rejection
Examples:
• Sharp wick rejection
• Strong displacement
• Clear shift in short-term order flow
B. A fresh 15M order block
Once rejection creates an order block in the direction of the trend,
that becomes my trigger.
⸻
🔹 5. The “Instinct Entry”: Limit Order at the Zone
Sometimes, when everything aligns strongly, I skip confirmation and place a limit order at the start of the zone.
I only do this when:
• The trend is extremely clear
• Momentum is clean and one-sided
• The zone originated from a very strong displacement, FVG formed
• Structure fully supports continuation
This is not mechanical — it’s experience and flow.
If I’m deeply bullish and the demand zone was the engine of a massive move,
I’m comfortable taking the risk.
Same idea for supply in a strong downtrend.
It’s high-confidence, high-conviction — but optional.
⸻
🔹 6. Fully Scalable Across Timeframes
This system works like a staircase:
• Daily → 4H execution
• 4H → 15M execution
• 1H → 5M execution
• 5M → 1M execution
- Higher timeframe defines the zone.
- Lower timeframe gives the entry.
- Trend ties everything together.
⸻
🔹 7. Entry & Risk Management
• Enter at the beginning of the marked zone.
• Place stop loss at the end of the zone.
• Primary target: fixed 1:3 risk-to-reward (RR).
• Consider liquidity areas, nearest support, or resistance levels for profit-taking.
• I usually take partial profits at 1:3 RR and let the remaining position run toward internal/external range liquidity or key support/resistance levels.
⸻
🔹 8. What This Gives Me
• Strong HTF structure
• Clear LTF triggers
• Cleaner entries
• More confidence
• Less noise
• A consistent, repeatable process
• Flexibility when conviction is extremely high
Thank you for reading! 💛 Show some love, and I hope I can bring real value to your trading journey.
