Bear market? Bull market?I'd like to see TOTAL close above the upwards trend line - otherwise it's not looking good. I don't agree with all those who say "bear market" I mean, they may be right - but there is no confirmation yet until this happens.
Key data points
Previous close
—
Open
—
Day's range
—
About Crypto Total Market Cap, $
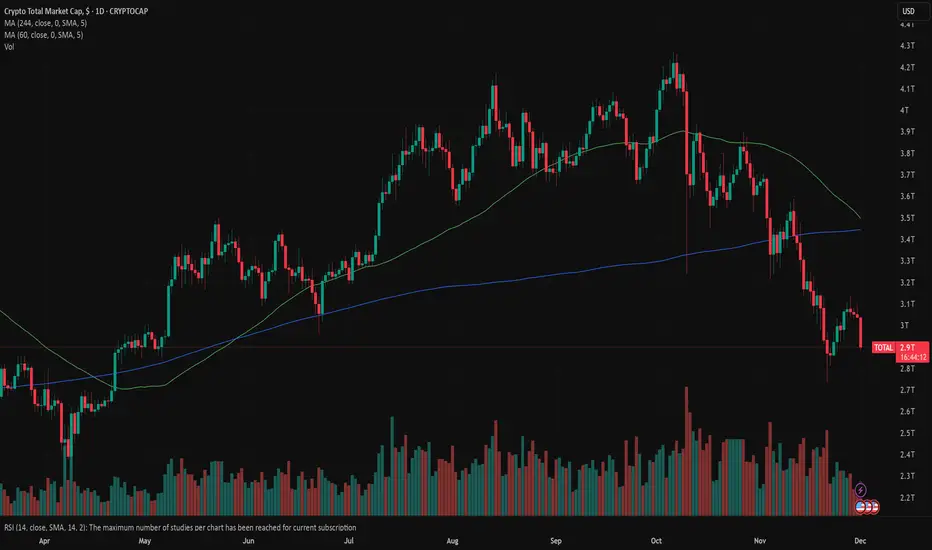
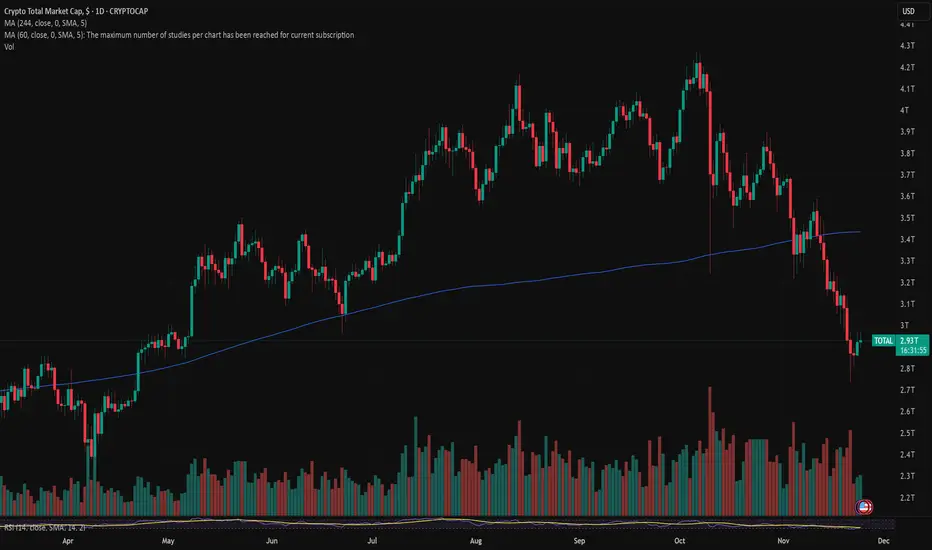
A prepared trader is defined by their ability to see a bigger picture of a market. It applies to crypto traders too — if you agree, we've prepared a chart that will let you see the whole crypto market from a bird's-eye view. It shows total crypto market cap, which is calculated by TradingView by adding up top 125 coins market caps, which, in their turn, are the number of coins times their current price. A growing market cap can indicate investors' interest and their positive evaluation of the current market state. For you it might be a good indicator of where the wind blows and whether digital coins are a good investment tool.

TOTAL Market Cap at key support, 100 EMA + Sto/RSI = BULLISH!The Total Market Cap is holding key trendline support going back many years, including the
Covid crash. Price is also holding at the 100 Week EMA and the stochastics RSI is turning up, which has been a good predictor of price on the weekly time frame.
So I would expect some kind of a bounce here e

TOTAL - Could Be Time For A Significant Market BounceFollowing on from my previous thread where I revealed my exit before the market slump, TOTAL has done exactly what I said and slumped to the retracement Golden Window 0.618 - 0.786 - on chart .
Now it is printing a lower wick, this is the whipsawing signal that the market may be readying for a rea

MARKETS week ahead: November 30 – December 6Last week in the news
As US macro data started to be released on a regular basis, investors turned their sentiment to a positive side in expectations that the Fed might cut interest rates by another 25 bps in December. The S&P 500 had its five-days positive streak, closing the week at 6.849. The sa
End of Cryptocurrency CycleTOTAL1 is approaching a critical inflection point as the entire crypto market cap compresses inside a multi-year rising wedge, with price still grinding higher while internal momentum decisively weakens. The structure shows classic late-cycle exhaustion: RSI has been carving a clean series of lower

MARKETS week ahead: November 24 – 30Last week in the news
The US Government started to work and some macro data were posted during this week. Still, jobs and unemployment data were mixed, not providing much guidance to investors whether the Fed will cut or not in December. At this moment higher concerns are raising a question: are we
The Bear Market. Officially Here.
Well, congrats to everyone on the start of the bear market. If anyone still hasn’t realized it yet — this is it.
CRYPTOCAP:TOTAL has broadly followed the roadmap from my previous overview , and now we finally have confirmation: five waves up, an ending diagonal, the main volume pool sitting a

CRYPTO market see that bottom go for long The total cryptocurrency market capitalization is now testing a critical technical confluence, positioned at both a multi-week channel support and a significant historical demand zone. Following the recent market correction, this level represents a pivotal area where buyer interest has traditionally

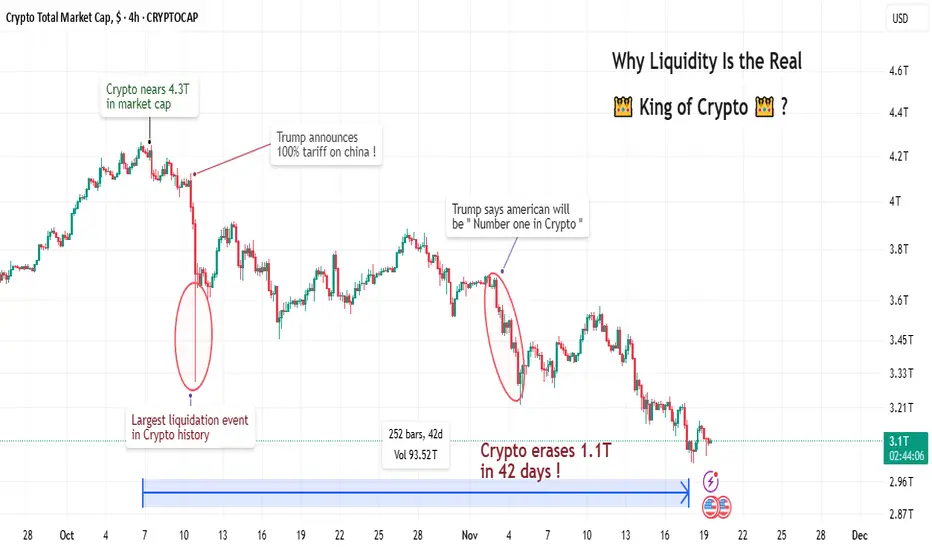
Why Liquidity Is the Real King of Crypto ?🧨 The $1.1 Trillion Lesson: Why Liquidity Is the Real King of Crypto 🧨
A deep dive into how macro headlines and liquidity shifts shape every chart you trade.
Hello Traders 🐺
In this idea, I want to take you on a journey through one of the most brutal and eye-opening moments in crypto history — a
One Last Push Before It’s Over?Total Market Cap CRYPTOCAP:TOTAL CRYPTOCAP:TOTALES
From a price action perspective, the structure looks very constructive:
• In May 2021, a swing high was formed, which later became a key resistance level.
• In November 2021, we saw a fakeout, confirming the significance of the level.
•

See all ideas
Summarizing what the indicators are suggesting.
Oscillators
Neutral
SellBuy
Strong sellStrong buy
Strong sellSellNeutralBuyStrong buy
Oscillators
Neutral
SellBuy
Strong sellStrong buy
Strong sellSellNeutralBuyStrong buy
Summary
Neutral
SellBuy
Strong sellStrong buy
Strong sellSellNeutralBuyStrong buy
Summary
Neutral
SellBuy
Strong sellStrong buy
Strong sellSellNeutralBuyStrong buy
Summary
Neutral
SellBuy
Strong sellStrong buy
Strong sellSellNeutralBuyStrong buy
Moving Averages
Neutral
SellBuy
Strong sellStrong buy
Strong sellSellNeutralBuyStrong buy
Moving Averages
Neutral
SellBuy
Strong sellStrong buy
Strong sellSellNeutralBuyStrong buy
Displays a symbol's price movements over previous years to identify recurring trends.