Volume Momentum Strategy [MA/VWAP Cross]Deconstructing the Volume Momentum Strategy: An Analysis of MA-VWAP Cross Mechanics
Introduction
The "Volume Momentum Strategy " is a technical trading algorithm programmed in Pine Script v6 for the TradingView platform. At its core, the strategy is a trend-following system that utilizes the interaction between a specific Moving Average (MA) and the Volume Weighted Average Price (VWAP) to generate trade signals. While the primary execution logic relies on price crossovers, the strategy incorporates a sophisticated secondary layer of analysis using the Commodity Channel Index (CCI) and Stochastic Oscillator. Uniquely, these secondary indicators are applied to volume data rather than price, serving as a gauge for market participation and momentum intensity.
The Core Engine: MA and VWAP Crossover
The primary engine driving the strategy's buy and sell decisions is the crossover relationship between a user-defined Moving Average and the VWAP.
1. The Anchor (VWAP): The strategy calculates the Volume Weighted Average Price based on the HLC3 (High, Low, Close divided by 3) source. VWAP serves as the dynamic benchmark for "fair value" throughout the trading session.
2. The Trigger (Moving Average): The script allows for flexibility in defining the "fast" line, offering options such as Simple (SMA), Exponential (EMA), or Hull Moving Averages.
3. The Signal:
o A Long (Buy) signal is generated when the chosen MA crosses over the VWAP. This suggests that short-term price momentum is exceeding the average volume-weighted price of the session, indicating bullish sentiment.
o A Short (Sell) signal is generated when the MA crosses under the VWAP, indicating bearish pressure where price is being pushed below the session's volume-weighted average.
The Role of CCI and Stochastic: Analyzing Volume Momentum
The prompt specifically inquires about how the CCI and Stochastic indicators fit into this process. In standard technical analysis, these oscillators are used to identify overbought or oversold price conditions. However, this strategy repurposes them to analyze Volume Momentum.
1. The Calculation
Instead of using close prices as the input source, the script passes volume data into both indicator functions:
• Volume CCI: Calculated as ta.cci(volume, cciLength). This measures the deviation of current volume from its statistical average.
• Volume Stochastic: Calculated as ta.stoch(volume, volume, volume, stochLength). This gauges the current volume relative to its recent range.
2. The "Volume Spike" Condition
The strategy combines these two indicators to define a specific market condition labeled isVolumeSpike. A volume spike is confirmed only when both conditions are met simultaneously:
• The Volume CCI must be greater than a defined threshold (default: 100).
• The Volume Stochastic must be greater than a defined threshold (default: 80).
3. Integration into the Process
It is critical to note how this script currently applies this "Volume Spike" logic:
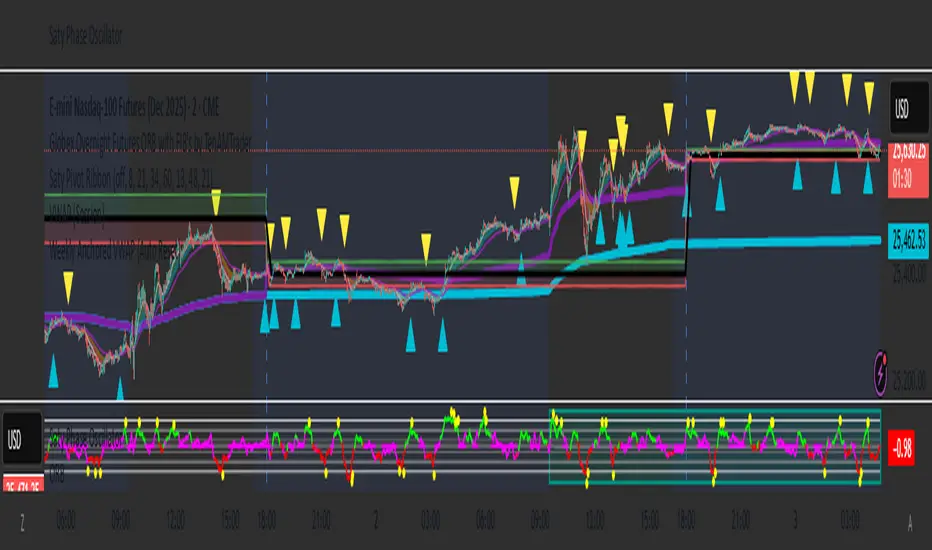
• Visual Confirmation: In the current version of the code, the isVolumeSpike boolean is used strictly for visual feedback. When a spike is detected, the script paints the specific price bar yellow and plots a small triangle marker below the bar.
• Strategic Implication: While the code calculates these metrics, the variables long_condition and short_condition currently rely solely on the MA/VWAP crossover. The developer has left the volume logic as a visual overlay, noting in the comments that it serves as a "visual/alert" or a potential filter.
• Potential Alpha: Conceptually, this setup implies that a trader should look for the MA/VWAP crossover to occur coincidentally with—or shortly after—a "Volume Spike" (yellow bar). This would confirm that the price move is backed by significant institutional participation (volume) rather than just retail noise.
Risk Management and Time Constraints
The strategy wraps these technical signals in a robust risk management framework. It includes hard-coded time windows (start/stop trading times) and a "Close All" function to prevent holding positions overnight. Furthermore, it employs both percentage-based and dollar-based Stop Loss and Take Profit mechanisms, ensuring that every entry—whether generated by a high-momentum crossover or a standard trend move—has a predefined exit plan.
Conclusion
The "Volume Momentum Strategy" is a hybrid system. It executes trades based on the reliable trend signal of MA crossing VWAP but informs the trader with advanced volume analytics. By processing volume through the CCI and Stochastic calculations, it provides a "heads-up" display regarding the intensity of market participation, allowing the trader to distinguish between low-volume drifts and high-volume breakout moves.
Indicators and strategies

Price Band LevelsThis indicator allows you to specify a base price. Once set, it automatically draws three price bands above the base and three bands below it, giving you a structured visual range around the selected level.

FRAN CRASH PLAY RULESPurpose
It creates a fixed information panel in the top right corner of your chart that shows the "FRAN CRASH PLAY RULES" - a checklist of criteria for identifying potential crash play setups.
Key Features
Display Panel:
Shows 5 trading rules as bullet points
Permanently visible in the top right corner
Stays fixed while you scroll or zoom the chart
Current Rules Displayed:
DYNAMIC 3 TO 5 LEG RUN
NEAR VERTICAL ACCELERATION
FINAL BAR OF THE RUN UP MUST BE THE BIGGEST
3 FINGER SPREAD / DUAL SPACE
ATLEAST 2 OF 5 CRITERIA NEEDS TO HIT
Customization Options:
Editable Text - Change any of the 5 rules through the settings
Text Color - Adjust the color of the text
Text Size - Choose from tiny, small, normal, large, or huge
Background Color - Customize the panel background and transparency
Frame Color - Change the border color
Show/Hide Frame - Toggle the border on or off
Use Case
This indicator serves as a constant visual reminder of your trading strategy criteria, helping you stay disciplined and only take trades that meet your specific crash play requirements. It's essentially a "cheat sheet" that lives on your chart so you don't have to memorize or look elsewhere for your trading rules.

Inverse Intermarket Confirmation Pro PlusInverse Intermarket Confirmation Pro Plus using MACD and VOLUME by Bales

Weekly Open + Monday High/Low (After Monday Close)b]Description
This indicator marks key weekly reference levels based on Monday’s price behavior.
It automatically detects each trading week and tracks:
• Weekly Open – the first traded price of the new week
• Monday High – the highest price reached on Monday
• Monday Low – the lowest price reached on Monday
Logic
The Monday range is fully captured only after Monday has closed .
No levels are plotted during Monday.
Starting from Tuesday, the indicator displays thin dots showing the completed Monday High, Monday Low, and Weekly Open for the remainder of the week.
When a new week begins, the indicator resets automatically and begins tracking the new week’s Monday.
Customization
The user can choose colors for:
• Monday High/Low
• Weekly Open
Purpose
This indicator helps traders visualize weekly structure, monitor weekly opening levels, and quickly identify Monday’s range for weekly bias analysis or strategy development.
It can also be used to manually backtest Monday range strategies .

Combined Up down with volumeIndicates the day with a purple dot where price moved up or down by 5% or more

EMA 9/20/50/100/200This script plots the five most commonly used Exponential Moving Averages (EMAs): 9, 20, 50, 100, and 200. These EMAs help traders quickly identify short-term momentum, medium-term trends, and long-term market direction.
It is useful for:
Trend identification
Momentum confirmation
Pullback entries
Reversal detection
Multi-timeframe confluence trading
What’s Included
EMA 9 → short-term momentum
EMA 20 → near-term trend guide
EMA 50 → medium-term trend
EMA 100 → broad trend structure
EMA 200 → long-term direction
Each EMA is color-coded for clarity, making it easy to read and visually track trend shifts.
How to Use
When shorter EMAs cross above longer EMAs → bullish trend strengthening
When shorter EMAs cross below longer EMAs → bearish trend strengthening
Wide spacing between EMAs indicates a strong trend
Compression or clustering often signals potential reversals or breakout conditions
This indicator is simple, clean, and effective for all timeframes and asset classes.


Kịch bản của tôi//@version=6
indicator(title="Relative Strength Index", shorttitle="Gấu Trọc RSI", format=format.price, precision=2, timeframe="", timeframe_gaps=true)
rsiLengthInput = input.int(14, minval=1, title="RSI Length", group="RSI Settings")
rsiSourceInput = input.source(close, "Source", group="RSI Settings")
calculateDivergence = input.bool(false, title="Calculate Divergence", group="RSI Settings", display = display.data_window, tooltip = "Calculating divergences is needed in order for divergence alerts to fire.")
change = ta.change(rsiSourceInput)
up = ta.rma(math.max(change, 0), rsiLengthInput)
down = ta.rma(-math.min(change, 0), rsiLengthInput)
rsi = down == 0 ? 100 : up == 0 ? 0 : 100 - (100 / (1 + up / down))
rsiPlot = plot(rsi, "RSI", color=#7E57C2)
rsiUpperBand1 = hline(98, "RSI Upper Band1", color=#787B86)
rsiUpperBand = hline(70, "RSI Upper Band", color=#787B86)
midline = hline(50, "RSI Middle Band", color=color.new(#787B86, 50))
rsiLowerBand = hline(30, "RSI Lower Band", color=#787B86)
rsiLowerBand2 = hline(14, "RSI Lower Band2", color=#787B86)
fill(rsiUpperBand, rsiLowerBand, color=color.rgb(126, 87, 194, 90), title="RSI Background Fill")
midLinePlot = plot(50, color = na, editable = false, display = display.none)
fill(rsiPlot, midLinePlot, 100, 70, top_color = color.new(color.green, 0), bottom_color = color.new(color.green, 100), title = "Overbought Gradient Fill")
fill(rsiPlot, midLinePlot, 30, 0, top_color = color.new(color.red, 100), bottom_color = color.new(color.red, 0), title = "Oversold Gradient Fill")
// Smoothing MA inputs
GRP = "Smoothing"
TT_BB = "Only applies when 'SMA + Bollinger Bands' is selected. Determines the distance between the SMA and the bands."
maTypeInput = input.string("SMA", "Type", options = , group = GRP, display = display.data_window)
var isBB = maTypeInput == "SMA + Bollinger Bands"
maLengthInput = input.int(14, "Length", group = GRP, display = display.data_window, active = maTypeInput != "None")
bbMultInput = input.float(2.0, "BB StdDev", minval = 0.001, maxval = 50, step = 0.5, tooltip = TT_BB, group = GRP, display = display.data_window, active = isBB)
var enableMA = maTypeInput != "None"
// Smoothing MA Calculation
ma(source, length, MAtype) =>
switch MAtype
"SMA" => ta.sma(source, length)
"SMA + Bollinger Bands" => ta.sma(source, length)
"EMA" => ta.ema(source, length)
"SMMA (RMA)" => ta.rma(source, length)
"WMA" => ta.wma(source, length)
"VWMA" => ta.vwma(source, length)
// Smoothing MA plots
smoothingMA = enableMA ? ma(rsi, maLengthInput, maTypeInput) : na
smoothingStDev = isBB ? ta.stdev(rsi, maLengthInput) * bbMultInput : na
plot(smoothingMA, "RSI-based MA", color=color.yellow, display = enableMA ? display.all : display.none, editable = enableMA)
bbUpperBand = plot(smoothingMA + smoothingStDev, title = "Upper Bollinger Band", color=color.green, display = isBB ? display.all : display.none, editable = isBB)
bbLowerBand = plot(smoothingMA - smoothingStDev, title = "Lower Bollinger Band", color=color.green, display = isBB ? display.all : display.none, editable = isBB)
fill(bbUpperBand, bbLowerBand, color= isBB ? color.new(color.green, 90) : na, title="Bollinger Bands Background Fill", display = isBB ? display.all : display.none, editable = isBB)
// Divergence
lookbackRight = 5
lookbackLeft = 5
rangeUpper = 60
rangeLower = 5
bearColor = color.red
bullColor = color.green
textColor = color.white
noneColor = color.new(color.white, 100)
_inRange(bool cond) =>
bars = ta.barssince(cond)
rangeLower <= bars and bars <= rangeUpper
plFound = false
phFound = false
bullCond = false
bearCond = false
rsiLBR = rsi
if calculateDivergence
//------------------------------------------------------------------------------
// Regular Bullish
// rsi: Higher Low
plFound := not na(ta.pivotlow(rsi, lookbackLeft, lookbackRight))
rsiHL = rsiLBR > ta.valuewhen(plFound, rsiLBR, 1) and _inRange(plFound )
// Price: Lower Low
lowLBR = low
priceLL = lowLBR < ta.valuewhen(plFound, lowLBR, 1)
bullCond := priceLL and rsiHL and plFound
//------------------------------------------------------------------------------
// Regular Bearish
// rsi: Lower High
phFound := not na(ta.pivothigh(rsi, lookbackLeft, lookbackRight))
rsiLH = rsiLBR < ta.valuewhen(phFound, rsiLBR, 1) and _inRange(phFound )
// Price: Higher High
highLBR = high
priceHH = highLBR > ta.valuewhen(phFound, highLBR, 1)
bearCond := priceHH and rsiLH and phFound
plot(
plFound ? rsiLBR : na,
offset = -lookbackRight,
title = "Regular Bullish",
linewidth = 2,
color = (bullCond ? bullColor : noneColor),
display = display.pane,
editable = calculateDivergence)
plotshape(
bullCond ? rsiLBR : na,
offset = -lookbackRight,
title = "Regular Bullish Label",
text = " Bull ",
style = shape.labelup,
location = location.absolute,
color = bullColor,
textcolor = textColor,
display = display.pane,
editable = calculateDivergence)
plot(
phFound ? rsiLBR : na,
offset = -lookbackRight,
title = "Regular Bearish",
linewidth = 2,
color = (bearCond ? bearColor : noneColor),
display = display.pane,
editable = calculateDivergence)
plotshape(
bearCond ? rsiLBR : na,
offset = -lookbackRight,
title = "Regular Bearish Label",
text = " Bear ",
style = shape.labeldown,
location = location.absolute,
color = bearColor,
textcolor = textColor,
display = display.pane,
editable = calculateDivergence)
alertcondition(bullCond, title='Regular Bullish Divergence', message="Found a new Regular Bullish Divergence, `Pivot Lookback Right` number of bars to the left of the current bar.")
alertcondition(bearCond, title='Regular Bearish Divergence', message='Found a new Regular Bearish Divergence, `Pivot Lookback Right` number of bars to the left of the current bar.')

Manual Pivot Plotter//================================================================================
//📌 Manual Pivot Plotter (P, R1–R3, S1–S3)
//📈 Pine Script v6
//
//This script allows the user to manually input Pivot levels (P), Resistance levels
//(R1, R2, R3), and Support levels (S1, S2, S3). Each line starts at the beginning
//of the new trading day (detected at 00:00 UTC+8) and extends only a limited
//distance into the future (default: 3 bars).
//
//Features:
//✔ Manual pivot, support, and resistance level inputs
//✔ Lines refresh automatically at each new day (00:00 UTC+8)
//✔ Lines extend only a few bars ahead (not full chart)
//✔ Clean label placement slightly below line and near line end
//✔ No repainting, memory-safe line handling
//✔ Smooth intraday updates when values are edited
//
//This tool is ideal for traders who manually calculate or import pivot levels and
//prefer clean, minimal, non-intrusive visual levels on the chart.
//================================================================================

US Sessions R4D1🇬🇧 English
US Sessions R4D1 - Market Session Highlighter
Visualize US market sessions directly on your chart with beautiful color overlays and an interactive dashboard.
🎯 FEATURES:
- Automatic session detection based on New York time
- Color-coded background for each session
- Session start labels with customizable size
- Real-time dashboard showing current session status
- Fully customizable colors and settings
📊 SESSIONS:
- 🌙 Premarket: 4:00-9:30 NY
- 🔔 US Open: 9:30-11:30 NY (Power Hour!)
- 🍔 Lunch: 11:30-13:30 NY (Low Volume)
- 📈 Afternoon: 13:30-16:00 NY
- 🌃 After Hours: 16:00-20:00 NY
⚙️ SETTINGS:
- Toggle each session on/off
- Customize all colors
- Label size: tiny to huge
- Dashboard position: any corner
- Show/hide labels and dashboard
Perfect for day traders who want to track market sessions at a glance. Know exactly when the US market opens, when volume typically drops during lunch, and when the afternoon push begins.
Works on all timeframes and instruments.

TMT Sessions - Hitesh_NimjeTMT Session - HiteshNimje
Overview
This indicator highlights four configurable trading sessions (default: New York / London / Tokyo / Sydney) and draws session ranges, session VWAPs, session mean/trendline, max/min lines and optional dashboard info. It was built for students of Thought Magic Trading (TMT) to quickly visualize intraday structure across major sessions.
Key features
4 separate sessions (A/B/C/D) — customizable names, times and colors.
Session Range boxes (high/low), optional outline and labels.
VWAP per session (volume-weighted average price).
Mean / Trendline for session price (optional).
Optional session Max/Min lines.
Small on-chart descriptive labels explaining what each plotted line means.
Simple dashboard showing session status (Active/Inactive), volume, trend strength and standard deviation (optional).
Timezone offset or use exchange timezone.
Default colors
Session A — Blue
Session B — Black
Session C — Red
Session D — Orange
Usage / Notes
Designed for intraday analysis — works best on intraday timeframes.
Toggle any session, overlay, or label via input settings to reduce chart clutter.
Labels and dashboard are optional; enable them only when you want the additional on-chart information.
The indicator does not provide buy/sell signals. Use it as a structural reference in conjunction with your trading plan.
Access & License
EXCLUSIVE ACCESS: This indicator is for TMT students only.
Distribution: Invite-only (author permission required) — the author will grant access by invitation.
Redistribution, modification, or public reposting without permission is prohibited.
Support / Contact
For access requests or issues, contact the author: Hitesh_Nimje (Thought Magic Trading).
(Provide invite requests directly to the author — do not attempt to share copies.)
Disclaimer
For educational purposes only. Trading involves risk. Past performance is not indicative of future results. The author is not responsible for trading losses.

EMA Crossover + Angle + Candle Pattern + Breakout (Clean)mrdfgdfew;qwiohj'fjpqwpodkqsk [pal
a'laoduasipdjascm[osfw0e9fj[ekf[pk[
pfi[0wejf[oewfkj[sofk

Price Volume Trend to buyThis indicator use PVT (price volume tendency) as background whith colors and labels to smart indicate if you are on buyer or seller scenario

Diff Price (Future - Spot)Diff Line (Future – Spot) plots a grid of spot-price levels derived from the current futures price.
It rounds the current futures price up to the nearest price block (e.g. every 25 points), then subtracts a user‑defined Diff (Future – Spot) to find the main spot level and draws that as the central line. Additional lines are plotted above and below at equal block distances, with labels showing both Future and Spot values (e.g. 4250 (4215)), plus a compact diff info box for quick reference.

Ehlers Dominant Cycle Stochastic RSIEhlers Enhanced Cycle Stochastic RSI
OVERVIEW
The Ehlers Enhanced Cycle Stochastic RSI is a momentum oscillator that automatically adjusts its lookback periods based on the dominant market cycle. Unlike traditional Stochastic RSI which uses fixed periods, this indicator detects the current cycle length and scales its calculations—making it responsive in fast markets and stable in slow ones.
The indicator combines John Ehlers' digital signal processing research with the classic Stochastic RSI indicator, then adds a confirmation system to ensure cycle measurements are reliable.
THE THEORY
Traditional oscillators use fixed lookback periods (ie, 14-bar RSI). This creates a fundamental problem: markets don't move in fixed cycles. A 14-period RSI might capture the rhythm perfectly during one market phase, then completely miss it when conditions change.
Ehlers' research demonstrated that price data contains measurable cyclical components. If you can detect the dominant cycle length, you can tune your indicators to match it—like tuning a radio to the right frequency.
This indicator takes that concept further by using three independent cycle detection methods and only trusting the measurement when they agree:
Hilbert Transform — A mathematical technique from signal processing that extracts cycle period from the phase relationship between price and its derivative. It is fast but can be noisy.
Autocorrelation Periodogram — Measures how similar the price series is to lagged versions of itself. The lag with highest correlation reveals the dominant cycle. More stable than Hilbert, but slightly slower to adapt.
Goertzel Algorithm (DFT) — A frequency-domain approach that calculates spectral power at each candidate period. Identifies which frequencies contain the most energy.
When all three methods converge on similar period estimates, confidence is high. When they disagree, the market may be in a non-cyclical or in transition.
HOW IT CHANGES THE STOCHASTIC RSI
Standard Stochastic RSI:
1. Calculate RSI with fixed period (14 bars)
2. Apply Stochastic formula over fixed period (14 bars)
3. Smooth with fixed periods
Ehlers Enhanced Cycle Stochastic RSI:
1. Detect dominant cycle using three methods
2. Confirm cycle measurement (methods must agree)
3. Calculate RSI with period scaled to the detected cycle
4. Apply Stochastic formula with cycle-scaled lookback
5. Smooth adaptively
The result: when the market is cycling quickly (say, 15-bar cycles), the indicator uses shorter periods and responds faster. When the market stretches into longer cycles (such as 40-bar cycles), it automatically extends its lookback to avoid whipsaws.
The Period Multipliers let you fine-tune this relationship:
• 1.0 = Use the full detected cycle (smoother, fewer signals)
• 0.5 = Use half the cycle (more responsive, catches turns earlier)
INTERPRETATION
Reading the Oscillator:
• K Line (Blue) — The main signal line. Moves between 0 and 100.
• D Line (Orange) — Smoothed version of K. Use for confirmation.
• Above 80 — Overbought. Momentum stretched to upside.
• Below 20 — Oversold. Momentum stretched to downside.
• Crossovers — K crossing above D suggests bullish momentum shift; K crossing below D suggests bearish.
Spectral Dilation (optional):
When enabled, applies a bandpass filter before cycle detection. This isolates the frequency band of interest and reduces noise. Useful for:
• Very noisy instruments
• Lower timeframes
• When confidence stays persistently low

Harami Reversal Alerts BB Touch (Strict First Candle)Harami Reversal Alerts BB Touch (Strict First Candle)
Harami Reversal Alerts BB Touch (Strict First Candle)Harami Reversal Alerts BB Touch (Strict First Candle)Harami Reversal Alerts BB Touch (Strict First Candle)Harami Reversal Alerts BB Touch (Strict First Candle)Harami Reversal Alerts BB Touch (Strict First Candle)

Double Relative Strength IndexBase on Regular Relative Streng Index, I am add 1 more RSI on it.
Using method:
When faster RSI cross lower RSI, price direction move at the same direction. It faster to know the direction of price than just using 1 RSI.
Hope it useful for you.

NYMO Fib Levels - RGNYMO is a single-session tool built around Fibonacci projections from the New York morning move. It automatically marks the NYMO session, measures its high–low range and projects your custom fib multiples above and below price, with every level drawn and labelled so you always know exactly which multiple you are trading around.
The core of the script is the 12:00–12:30 opening window. That first 30 minutes is treated as the price-discovery phase of the session: it captures the initial burst of liquidity, the repricing of overnight positions and the first real directional push. The high and low of 12:00–12:30 form the opening range, and all fib projections are anchored to that move, turning the very first half-hour into a structured map for the rest of the session.
On top of the fib framework, NYMO can show the NYMO session box, compare the current range to recent NYMO statistics, and trigger alerts when price breaks the NYMO high or low or trades through key fib areas. It is built for traders who only care about the New York morning and want all of their structure, targets and alerts driven by fibs from that one defined opening window.

Weekly Anchored VWAP (Auto Reset)This Anchored VWAP automatically resets to Sunday Futures open at 6 PM NYC EST. It shows up on all time frames
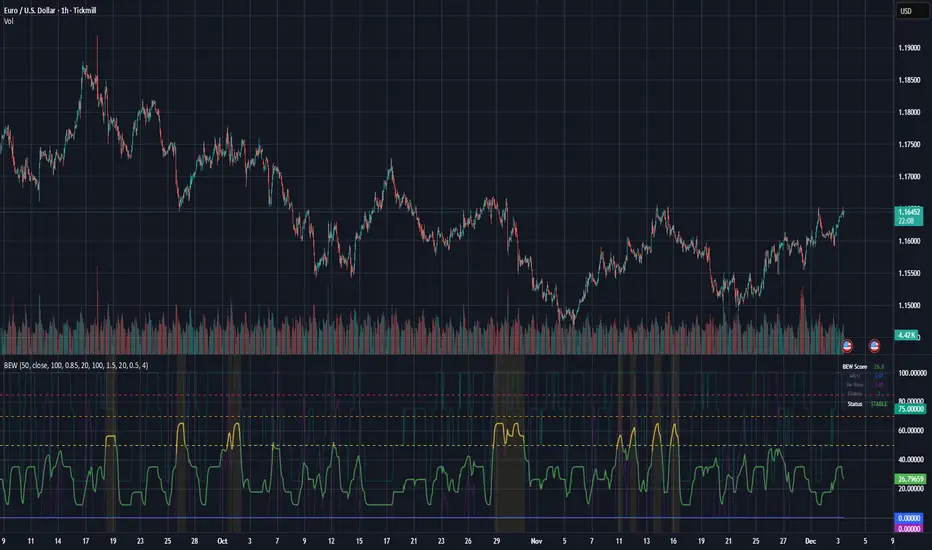
Bifurcation Early WarningBifurcation Early Warning (BEW) — Chaos Theory Regime Detection
OVERVIEW
The Bifurcation Early Warning indicator applies principles from chaos theory and complex systems research to detect when markets are approaching critical transition points — moments where the current regime is likely to break down and shift to a new state.
Unlike momentum or trend indicators that tell you what is happening, BEW tells you when something is about to change. It provides early warning of regime shifts before they occur, giving traders time to prepare for increased volatility or trend reversals.
THE SCIENCE BEHIND IT
In complex systems (weather, ecosystems, financial markets), major transitions don't happen randomly. Research has identified three universal warning signals that precede critical transitions:
1. Critical Slowing Down
As a system approaches a tipping point, it becomes "sluggish" — small perturbations take longer to decay. In markets, this manifests as rising autocorrelation in returns.
2. Variance Amplification
Short-term volatility begins expanding relative to longer-term baselines as the system destabilizes.
3. Flickering
The system oscillates between two potential states before committing to one — visible as increased crossing of mean levels.
BEW combines all three signals into a single composite score.
COMPONENTS
AR(1) Coefficient — Critical Slowing Down (Blue)
Measures lag-1 autocorrelation of returns over a rolling window.
• Rising toward 1.0: Market becoming "sticky," slow to mean-revert — transition approaching
• Low values (<0.3): Normal mean-reverting behavior, stable regime
Variance Ratio (Purple)
Compares short-term variance to long-term variance.
• Above 1.5: Short-term volatility expanding — energy building before a move
• Near 1.0: Volatility stable, no unusual pressure
Flicker Count (Yellow/Teal)
Counts state changes (crossings of the dynamic mean) within the lookback period.
• High count: Market oscillating between states — indecision before commitment
• Low count: Price firmly in one regime
INTERPRETING THE BEW SCORE
0–50 (STABLE): Normal market conditions. Existing strategies should perform as expected.
50–70 (WARNING): Elevated instability detected. Consider reducing exposure or tightening risk parameters.
70–85 (DANGER): High probability of regime change. Avoid initiating new positions; widen stops on existing ones.
85+ (CRITICAL): Bifurcation likely imminent or in progress. Expect large, potentially unpredictable moves.
HOW TO USE
As a Regime Filter
• BEW < 50: Normal trading conditions — apply your standard strategies
• BEW > 60: Elevated caution — reduce position sizes, avoid mean-reversion plays
• BEW > 80: High alert — consider staying flat or hedging existing positions
As a Preparation Signal
BEW tells you when to pay attention, not which direction. When readings elevate:
• Watch for confirmation from volume, order flow, or other directional indicators
• Prepare for breakout scenarios in either direction
• Adjust take-profit and stop-loss distances for larger moves
For Volatility Adjustment
High BEW periods correlate with larger candles. Use this to:
• Widen stops during elevated readings
• Adjust position sizing inversely to BEW score
• Set more ambitious profit targets when entering during high-BEW breakouts
Divergence Analysis
• Price making new highs/lows while BEW stays low: Trend likely to continue smoothly
• Price consolidating while BEW rises: Breakout incoming — direction uncertain but move will be significant
SETTINGS GUIDE
Core Settings
• Lookback Period: General reference period (default: 50)
• Source: Price source for calculations (default: close)
Critical Slowing Down (AR1)
• AR(1) Calculation Period: Bars used for autocorrelation (default: 100). Higher = smoother, slower.
• AR(1) Warning Threshold: Level at which AR(1) is considered elevated (default: 0.85)
Variance Growth
• Variance Short Period: Fast variance window (default: 20)
• Variance Long Period: Slow variance window (default: 100)
• Variance Ratio Threshold: Level for maximum score contribution (default: 1.5)
Regime Flickering
• Flicker Detection Period: Window for counting state changes (default: 20)
• Flicker Bandwidth: ATR multiplier for state detection — lower = more sensitive (default: 0.5)
• Flicker Count Threshold: Number of crossings for maximum score (default: 4)
TIMEFRAME RECOMMENDATIONS
• 5m–15m: Use shorter periods (AR: 30–50, Var: 10/50). Expect more noise.
• 1H: Balanced performance with default or slightly extended settings (AR: 100, Var: 20/100).
• 4H–Daily: Extend periods further (AR: 100–150, Var: 30/150). Cleaner signals, less frequent.
ALERTS
Three alert conditions are included:
• BEW Warning: Score crosses above 50
• BEW Danger: Score crosses above 70
• BEW Critical: Score crosses above 85
LIMITATIONS
• No directional bias: BEW detects instability, not direction. Combine with trend or momentum indicators.
• Not a timing tool: Elevated readings may persist for several bars before the actual move.
• Parameter sensitive: Optimal settings vary by asset and timeframe. Backtest before live use.
• Leading indicator trade-off: Early warning means some false positives are inevitable.
CREDITS
Inspired by research on early warning signals in complex systems:
• Dakos et al. (2012) — "Methods for detecting early warnings of critical transitions"
DISCLAIMER
This indicator is for educational and informational purposes only. It does not constitute financial advice. Past performance is not indicative of future results. Always conduct your own analysis and risk management. Use at your own risk.
Algoticks.in: MA Crossover Strategy (Sample)MA Crossover Strategy - User Guide
Overview
This is a Moving Average Crossover strategy that generates trading signals when a fast MA crosses a slow MA. It integrates with Algoticks.in API for automated trading on Delta Exchange.
Strategy Logic
Long Signal: When Fast MA crosses above Slow MA
Short Signal: When Fast MA crosses below Slow MA
Automatically closes opposite positions before entering new ones
Quick Setup
1. Add to TradingView
Open TradingView and go to the chart
Click "Pine Editor" at the bottom
Paste the script code
Click "Add to Chart"
2. Configure Strategy Parameters
Strategy Settings
Fast MA Length (default: 9): Shorter moving average period
Slow MA Length (default: 21): Longer moving average period
MA Type : Choose SMA (Simple) or EMA (Exponential)
General API Settings
Paper Trading : Enable for testing without real money
Signal Type : Choose "Trading Signal" (default) for tracking
Exchange : DELTA (Delta Exchange)
Segment :
futures - Perpetual contracts
options - Call/Put options
spot - Spot trading
Order Settings: Basic
Quantity : Number of contracts (e.g., 1, 0.5, 2)
Validity :
GTC - Good Till Cancelled
IOC - Immediate or Cancel
FOK - Fill or Kill
DAY - Day order
Product : cross_margin or isolated_margin
Order Settings: Entry Type
Choose how orders are executed:
Market Order : Immediate fill at best price
Limit Order : Fill at specified price or better
Stop Market : Triggers at stop price, then market order
Stop Limit : Triggers at stop price, then limit order
Entry Prices (for Limit/Stop orders)
Limit Price:
Price : The value to use
Type : Last Price / Mark Price / Index Price
Mode :
Absolute - Exact price (e.g., 65000)
Relative - Offset from entry price
% Checkbox : If checked, relative uses percentage; if unchecked, uses points
Example:
Absolute: 65000 → Order at exactly 65000
Relative 1% (checked): Entry ± 1% of entry price
Relative 100 (unchecked): Entry ± 100 points
Trigger Price: Same logic as Limit Price, used for Stop orders
Exit / Bracket Prices (SL/TP)
Stop Loss (SL):
Type : Price type to monitor (Mark Price recommended)
Mode : Absolute or Relative
% : Percentage or points
SL : Stop loss value (e.g., 2 for 2%)
Trig : Optional trigger price (creates Stop-Limit SL)
Take Profit (TP): Same structure as SL
Example:
Long entry at 65000, SL = 2% → Exit at 63700 (65000 - 2%)
Short entry at 65000, TP = 3% → Exit at 63050 (65000 - 3%)
3. Options Trading Setup (Only if Segment = Options)
Strike Selection Method
User Defined Mode:
Manually specify exact strike and option type
Best for: Trading specific levels
Required fields:
Strike Price : e.g., "65000"
Option Type : Call or Put
Dynamic Mode:
System calculates strike based on ATM price
Best for: Automated strategies
Required fields:
Algo Type : Options Buying or Selling
Strike Offset : 0 (ATM), +1 (above ATM), -1 (below ATM)
Strike Interval : Gap between strikes (e.g., BTC: 500, ETH: 50)
Expiry Date Formats:
T+0 - Today
T+1 - Tomorrow
current week - This Friday
next week - Next Friday
current month - Last Friday of month
131125 - Specific date (13 Nov 2025)
4. Create Alert for Automation
Right-click on chart → "Add Alert"
Condition : Select your strategy name
Alert Actions : Webhook URL
Webhook URL : Your Algoticks.in API endpoint
Message : Leave as {{strategy.order.alert_message}} (contains JSON)
Click "Create"
The alert will automatically send JSON payloads to your API when signals occur.
Example Configurations
Simple Futures Trading
Strategy: Fast MA = 9, Slow MA = 21, SMA
Segment: futures
Order Type: market_order
Quantity: 1
SL: 2% (Relative)
TP: 4% (Relative)
Options Buying (Dynamic)
Segment: options
Strike Selection: Dynamic
Algo Type: Options Buying Algo
Strike Offset: 0 (ATM)
Strike Interval: 500 (for BTC)
Expiry: current week
Order Type: market_order
Conservative Spot Trading
Segment: spot
Order Type: limit_order
Limit Price: 0.5% (Relative)
Quantity: 0.1
No SL/TP (manual management)
Important Notes
Paper Trading First : Always test with paper trading enabled before live trading
Order Tags : Automatically generated for tracking (max 18 chars)
Position Management : Strategy closes opposite positions automatically
Signal Confirmation : Uses barstate.isconfirmed to prevent repainting
JSON Payload : All settings are converted to JSON and sent via webhook
Troubleshooting
No signals : Check if MAs are crossing on your timeframe
Orders not executing : Verify webhook URL and API credentials
Wrong strikes : Double-check Strike Interval for your asset
SL/TP not working : Ensure values are non-zero and mode is correct
Support
For API setup and connector configuration, see CONNECTOR_SETUP_GUIDE.md or visit Algoticks.in documentation.

First Session Candle (Transparent Label) Change timezone & more"Global First Candle Rule: Session Refinement Tool"
"This tool/template is designed to apply the First Candle Rule across the world's three major trading sessions: New York (NYO), Asia (AO), and London (LO).
It uses New York Time (NY) as the default reference, but the timezone can be easily adjusted to UTC or UTC+7 (Vietnam Time).
🎁 Free for the community!"
