Market Internals Dashboard: Trend, Breadth, Volume PressureOverview
The Market Internals Dashboard Pro is a professional-grade toolkit modeled after what prop firms and institutional desks use to understand real intraday market conditions.
Instead of relying solely on price, this indicator analyzes three critical internal forces:
USI:TICK : Microstructure buying/selling pressure
USI:ADD : Market breadth participation (advancers vs decliners proxy)
USI:VOLD : Volume pressure (buying vs selling volume)
These internals determine whether the market is:
Trending or ranging
Bullish or bearish
Likely to follow through or mean-revert
Favoring continuation trades or fade setups
The script also produces a Market Environment Score (–3 to +3) and a real-time Trade Recommendation Table that updates every bar. This helps answer the single most important question in intraday trading: “What type of trades should I be taking right now given current market conditions?”
1. TICK Proxy: Microstructure Pressure
Measures buying vs. selling aggressiveness across the market This proxy simulates the NYSE TICK index by evaluating whether bars close above or below the prior bar.
Positive TICK → Buyers lifting offers
Negative TICK → Sellers hitting bids
Neutral TICK → No microstructure conviction
Why it matters:
Strong TICK is often the earliest sign of:
Trend initiation
Algorithmic buy/sell programs
Shifts in short‑term sentiment
Weak or choppy TICK often signals:
Range conditions
Failed breakouts
Low‑quality trend attempts
2. ADD Proxy: Market Breadth Strength
Shows how many stocks are participating in a move Because real USI:ADD data isn't available for all users, this script uses a self-contained breadth approximation built from:
Price slope
Volatility expansion
Volume‑weighted directional pressure
Why it matters? Breadth reveals whether the move is:
Broad and healthy → likely to continue
Narrow and weak → vulnerable to reversal
Strong trends require strong breadth. Weak breadth often precedes:
Failed breakouts
Reversal setups
Chop (ewww)
3. VOLD Proxy: Volume Pressure
The most important internal of all. This proxy measures whether trading volume is flowing into up bars or down bars.
Positive VOLD → Net buying pressure
Negative VOLD → Net selling pressure
Why it matters:
VOLD is considered the "truth serum" of the tape:
Strong VOLD drives trend days
Negative VOLD kills long setups
Mixed VOLD creates chop
You should rarely trend trade against VOLD.
4. Market Environment Score (–3 to +3)
The Environment Score combines the three internals into a single view:
|| Score || Interpretation || Market Type ||
| +3 | Strong Bull | Trend Day (Long) |
| +2 | Bull | Pullback Buys / Breakout Continuation |
| +1 | Mild Bull | Conservative Long Scalps |
| 0 | Neutral | CHOP – VWAP Reversions / Fades |
| -1 | Mild Bear | Short Failed Breakouts |
| -2 | Bear | Trend Shorts / Breakdown Continuation |
| -3 | Strong Bear | Trend Day (Short) |
Why it matters:
The market behaves differently depending on internal alignment. This score prevents traders from:
Forcing trend trades on chop days
Chasing breakouts when breadth is weak
Fading strong directional days
It tells you in real time whether conditions favor:
Trend following
Mean reversion
Breakout continuation
Liquidity grabs
Or sitting out
5. Trade Recommendation Engine
Based on the Environment Score, the indicator outputs a real-time playbook recommending which trade types have the highest probability of success right now.
Examples:
Score = 0 (Neutral)
VWAP Reversions
Liquidity Grabs
Failed Breakouts
Quick Scalps
Score = +2/+3 (Strong Bull)
Pullback Buys
Breakout Continuation
Trend Longs
Score = -2/-3 (Strong Bear)
Pullback Shorts
Breakdown Continuation
Trend Shorts Only
This turns the internals into a trade selection engine, not just a data display.
Why Market Internals Matter
Most indicators look only at price, but price is the result, not the cause.
Market internals show:
Where volume is flowing
Whether buying is aggressive or passive
How many stocks are participating
Whether algorithms are supporting or fighting the move
This dashboard helps traders:
Avoid chop
Stay out of low‑quality setups
Time entries with institutional flows
Improve win rate by trading the right setups at the right times
Final Notes
Works on any symbol or timeframe
Fully customizable colors
Two clean visual tables: Internals + Trade Playbook
Ideal for futures, ETFs, and options day traders
If you enjoy this tool, please like, comment, or follow. More enhancements are coming.
Trade smart.
Indicators and strategies

S&P 500 Scalper Pro [Trend + MACD] 5 minfor scalping 5 min S&P on 5 min chart put SL on 20 min ma and take 2:1 risk

BAY_PIVOT S/R(4 Full Lines + ALL Labels)//@version=5
indicator("BAY_PIVOT S/R(4 Full Lines + ALL Labels)", overlay=true, max_labels_count=500, max_lines_count=500)
// ────────────────────── TOGGLES ──────────────────────
showPivot = input.bool(true, "Show Pivot (Full Line + Label)")
showTarget = input.bool(true, "Show Target (Full Line + Label)")
showLast = input.bool(true, "Show Last Close (Full Line + Label)")
showPrevClose = input.bool(true, "Show Previous Close (Full Line + Label)")
useBarchartLast = input.bool(true, "Use Barchart 'Last' (Settlement Price)")
showR1R2R3 = input.bool(true, "Show R1 • R2 • R3")
showS1S2S3 = input.bool(true, "Show S1 • S2 • S3")
showStdDev = input.bool(true, "Show ±1σ ±2σ ±3σ")
showFib4W = input.bool(true, "Show 4-Week Fibs")
showFib13W = input.bool(true, "Show 13-Week Fibs")
showMonthHL = input.bool(true, "Show 1M High / Low")
showEntry1 = input.bool(false, "Show Manual Entry 1")
showEntry2 = input.bool(false, "Show Manual Entry 2")
entry1 = input.float(0.0, "Manual Entry 1", step=0.25)
entry2 = input.float(0.0, "Manual Entry 2", step=0.25)
stdLen = input.int(20, "StdDev Length", minval=1)
fib4wBars = input.int(20, "4W Fib Lookback")
fib13wBars = input.int(65, "13W Fib Lookback")
// ────────────────────── DAILY CALCULATIONS ──────────────────────
high_y = request.security(syminfo.tickerid, "D", high , lookahead=barmerge.lookahead_on)
low_y = request.security(syminfo.tickerid, "D", low , lookahead=barmerge.lookahead_on)
close_y = request.security(syminfo.tickerid, "D", close , lookahead=barmerge.lookahead_on)
pivot = (high_y + low_y + close_y) / 3
r1 = pivot + 0.382 * (high_y - low_y)
r2 = pivot + 0.618 * (high_y - low_y)
r3 = pivot + (high_y - low_y)
s1 = pivot - 0.382 * (high_y - low_y)
s2 = pivot - 0.618 * (high_y - low_y)
s3 = pivot - (high_y - low_y)
prevClose = close_y
last = useBarchartLast ? request.security(syminfo.tickerid, "D", close , lookahead=barmerge.lookahead_off) : close
target = pivot + (pivot - prevClose)
// StdDev + Fibs + Monthly (unchanged)
basis = ta.sma(close, stdLen)
dev = ta.stdev(close, stdLen)
stdRes1 = basis + dev
stdRes2 = basis + dev*2
stdRes3 = basis + dev*3
stdSup1 = basis - dev
stdSup2 = basis - dev*2
stdSup3 = basis - dev*3
high4w = ta.highest(high, fib4wBars)
low4w = ta.lowest(low, fib4wBars)
fib382_4w = high4w - (high4w - low4w) * 0.382
fib50_4w = high4w - (high4w - low4w) * 0.500
high13w = ta.highest(high, fib13wBars)
low13w = ta.lowest(low, fib13wBars)
fib382_13w_high = high13w - (high13w - low13w) * 0.382
fib50_13w = high13w - (high13w - low13w) * 0.500
fib382_13w_low = low13w + (high13w - low13w) * 0.382
monthHigh = ta.highest(high, 30)
monthLow = ta.lowest(low, 30)
// ────────────────────── COLORS ──────────────────────
colRed = color.rgb(255,0,0)
colLime = color.rgb(0,255,0)
colYellow = color.rgb(255,255,0)
colOrange = color.rgb(255,165,0)
colWhite = color.rgb(255,255,255)
colGray = color.rgb(128,128,128)
colMagenta = color.rgb(255,0,255)
colPink = color.rgb(233,30,99)
colCyan = color.rgb(0,188,212)
colBlue = color.rgb(0,122,255)
colPurple = color.rgb(128,0,128)
colRed50 = color.new(colRed,50)
colGreen50 = color.new(colLime,50)
// ────────────────────── 4 KEY FULL LINES ──────────────────────
plot(showPivot ? pivot : na, title="PIVOT", color=colYellow, linewidth=3, style=plot.style_linebr)
plot(showTarget ? target : na, title="TARGET", color=colOrange, linewidth=2, style=plot.style_linebr)
plot(showLast ? last : na, title="LAST", color=colWhite, linewidth=2, style=plot.style_linebr)
plot(showPrevClose ? prevClose : na, title="PREV CLOSE",color=colGray, linewidth=1, style=plot.style_linebr)
// ────────────────────── LABELS FOR ALL 4 KEY LEVELS (SAME STYLE AS OTHERS) ──────────────────────
f_label(price, txt, bgColor, txtColor) =>
if barstate.islast and not na(price)
label.new(bar_index, price, txt, style=label.style_label_left, color=bgColor, textcolor=txtColor, size=size.small)
if barstate.islast
showPivot ? f_label(pivot, "PIVOT " + str.tostring(pivot, "#.##"), colYellow, color.black) : na
showTarget ? f_label(target, "TARGET " + str.tostring(target, "#.##"), colOrange, color.white) : na
showLast ? f_label(last, "LAST " + str.tostring(last, "#.##"), colWhite, color.black) : na
showPrevClose ? f_label(prevClose, "PREV CLOSE "+ str.tostring(prevClose, "#.##"), colGray, color.white) : na
// ────────────────────── OTHER LEVELS – line stops at label ──────────────────────
f_level(p, txt, tc, lc, w=1) =>
if barstate.islast and not na(p)
lbl = label.new(bar_index, p, txt, style=label.style_label_left, color=lc, textcolor=tc, size=size.small)
line.new(bar_index-400, p, label.get_x(lbl), p, extend=extend.none, color=lc, width=w)
if barstate.islast
if showR1R2R3
f_level(r1, "R1 " + str.tostring(r1, "#.##"), color.white, colRed)
f_level(r2, "R2 " + str.tostring(r2, "#.##"), color.white, colRed)
f_level(r3, "R3 " + str.tostring(r3, "#.##"), color.white, colRed, 2)
if showS1S2S3
f_level(s1, "S1 " + str.tostring(s1, "#.##"), color.black, colLime)
f_level(s2, "S2 " + str.tostring(s2, "#.##"), color.black, colLime)
f_level(s3, "S3 " + str.tostring(s3, "#.##"), color.black, colLime, 2)
if showStdDev
f_level(stdRes1, "+1σ " + str.tostring(stdRes1, "#.##"), color.white, colPink)
f_level(stdRes2, "+2σ " + str.tostring(stdRes2, "#.##"), color.white, colPink)
f_level(stdRes3, "+3σ " + str.tostring(stdRes3, "#.##"), color.white, colPink, 2)
f_level(stdSup1, "-1σ " + str.tostring(stdSup1, "#.##"), color.white, colCyan)
f_level(stdSup2, "-2σ " + str.tostring(stdSup2, "#.##"), color.white, colCyan)
f_level(stdSup3, "-3σ " + str.tostring(stdSup3, "#.##"), color.white, colCyan, 2)
if showFib4W
f_level(fib382_4w, "38.2% 4W " + str.tostring(fib382_4w, "#.##"), color.white, colMagenta)
f_level(fib50_4w, "50% 4W " + str.tostring(fib50_4w, "#.##"), color.white, colMagenta)
if showFib13W
f_level(fib382_13w_high, "38.2% 13W High " + str.tostring(fib382_13w_high, "#.##"), color.white, colMagenta)
f_level(fib50_13w, "50% 13W " + str.tostring(fib50_13w, "#.##"), color.white, colMagenta)
f_level(fib382_13w_low, "38.2% 13W Low " + str.tostring(fib382_13w_low, "#.##"), color.white, colMagenta)
if showMonthHL
f_level(monthHigh, "1M HIGH " + str.tostring(monthHigh, "#.##"), color.white, colRed50, 2)
f_level(monthLow, "1M LOW " + str.tostring(monthLow, "#.##"), color.white, colGreen50, 2)
// Manual entries
plot(showEntry1 and entry1 > 0 ? entry1 : na, "Entry 1", color=colBlue, linewidth=2, style=plot.style_linebr)
plot(showEntry2 and entry2 > 0 ? entry2 : na, "Entry 2", color=colPurple, linewidth=2, style=plot.style_linebr)
// Background
bgcolor(close > pivot ? color.new(color.blue, 95) : color.new(color.red, 95))

The Biz (ADX/DI/RSI Revised)This is an indicator that will help you trade the GEX, showing when price is trending hard, or about to reverse, and will guide you in picking direction and bias. (INDICATOR SLIGHTLY LAGS)

ONLY FOR EUR/USD : EMA9/EMA20 + RSI + MACD + Fibonacci (v6) FOR PAIRS WHICH HAS A MOMENTUM , trade only using manually not algo , use proper RR.
good luck

RSI Golden & Dead Cross AlertRSI 14 Golden And Dead Cross Indicator
It will give you an alert when there are rsi golden and dead cross.
It is a intergated signal: Crossing up and Crossing down of RSI.

BTC / XAU Calculator/Hesaplayıcı
USER GUIDE
BTC/XAU Calculator is a table-based indicator that displays Bitcoin price, Gold price (XAU/USD), and the BTC/XAU ratio simultaneously. It pulls real-time market data and calculates values based on your manual inputs.
⸻
Features
• Automatically fetches live BTCUSD and XAUUSD prices.
• Supports two-way manual calculations:
• BTC price → Ratio calculation
• Ratio → BTC price calculation
• Clear table layout showing Market vs Calculated values.
• Compatible with Binance, OANDA, and all brokers.
⸻
1. Settings
Gold Price (XAU/USD)
• When “Use live XAU price” is enabled, the indicator uses real-time XAU/USD.
• If disabled, you can enter your own gold price manually.
⸻
2. Calculation Modes
A) Calculate BTC from Ratio
BTC = Ratio × Gold price
Example:
XAU = 4200
Ratio = 19.08
→ BTC = 4200 × 19.08 = 80,136 USD
⸻
B) Calculate Ratio from BTC
Ratio = BTC price ÷ Gold price
Example:
BTC = 90,000
XAU = 4250
→ Ratio = 90,000 / 4,250 = 21.18
3. Suggested Uses
• Evaluate BTC as cheap/expensive relative to gold
• BTC target projections based on gold
• Macro hedge and correlation analysis
• BTC/XAU ratio-based scenario modeling
⸻
Notes
• This indicator does not generate trading signals.
• It is intended for numerical comparison and scenario building only.
Source: The design and calculation logic of this indicator were created in collaboration with OpenAI’s ChatGPT model.

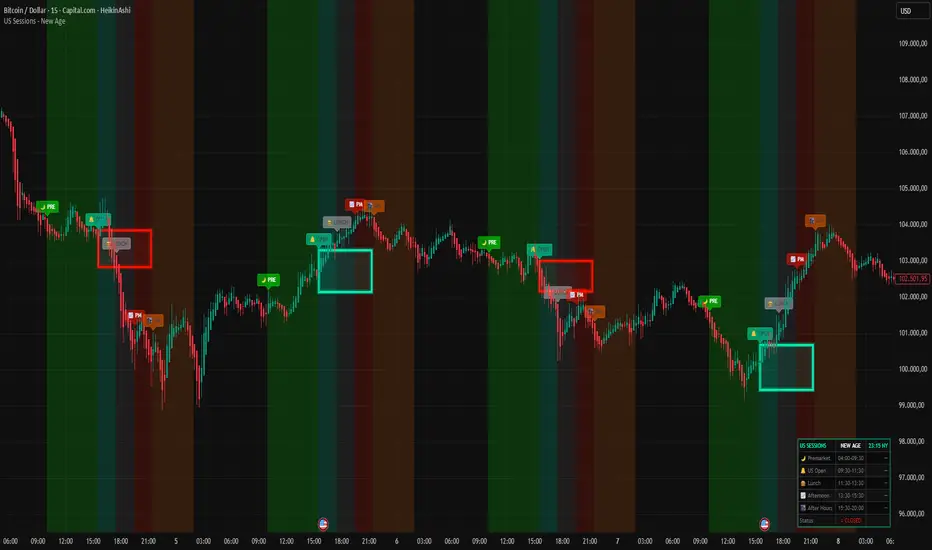
US Sessions - New Age 🚀 US SESSIONS - NEW AGE
Finally. A session indicator that doesn't look like it was made in 2005.
Welcome to the New Age. 🔮
━━━━━━━━━━━━━━━━━━━━━━━━━━━━━━━━━━━━━━━━━━━━━━
🎯 WHAT IT DOES
Visualizes US market sessions with NEON style backgrounds:
🌙 Premarket (04:00-09:30 NY) — Bright Green
🔔 US Open (09:30-11:30 NY) — Cyan
🍔 Lunch Break (11:30-13:30 NY) — Silver
📈 Afternoon (13:30-15:30 NY) — Red
🌃 After Hours (15:30-20:00 NY) — Orange
All times are automatically synced to New York timezone (EST/EDT).
No more manual calculations. No more confusion. Just works.™
━━━━━━━━━━━━━━━━━━━━━━━━━━━━━━━━━━━━━━━━━━━━━━
⭐ BONUS: ORB BOX (Opening Range Breakout)
This is the secret weapon. 🔥
The indicator automatically draws a NEON GLOWING box around the first 15 minutes of trading (9:30-9:45 NY). This is the Opening Range — one of the most powerful concepts in day trading.
📦 HOW THE ORB BOX WORKS:
- Box shows the HIGH and LOW of the first 15-minute candle
- Box extends from 9:45 until 15:30 (end of regular session)
- 🔵 CYAN GLOW = Price is ABOVE the ORB → Bullish bias
- 🔴 RED GLOW = Price is BELOW the ORB → Bearish bias
The color changes LIVE as price moves. Instant visual feedback!
Why does this matter?
→ 70%+ of the time, price will break and HOLD one side of the ORB
→ The direction of the first breakout often defines the trend for the day
→ Use it as dynamic support/resistance
━━━━━━━━━━━━━━━━━━━━━━━━━━━━━━━━━━━━━━━━━━━━━━
⚙️ SETTINGS
🕐 SESSION TIMES
→ Toggle each session ON/OFF with one click
→ All sessions enabled by default
📦 ORB BOX
→ Show/Hide the Opening Range Box
→ Enable/Disable the Neon Glow effect
→ Hover over settings for detailed info
🏷️ LABELS
→ Size: tiny, small, normal, large, huge
→ Height: Distance above candles (ATR based)
→ Transparency: 0% (solid) → 80% (subtle)
📊 DASHBOARD
→ Live NY time display
→ Shows active session
→ Market status indicator
→ Moveable to any corner
🎨 NEON COLORS
→ Fully customizable
→ Default: Cyan/Red theme
━━━━━━━━━━━━━━━━━━━━━━━━━━━━━━━━━━━━━━━━━━━━━━
🔔 ALERTS
- 🌙 Premarket Start
- 🔔 US Market Open
- 🌃 After Hours Start
Never miss a session change again.
━━━━━━━━━━━━━━━━━━━━━━━━━━━━━━━━━━━━━━━━━━━━━━
💡 PRO TIPS
1. Use ORB breakouts as entry signals
2. Avoid trading during Lunch (low volume = choppy)
3. Best moves happen at US Open and Afternoon
4. Premarket shows overnight sentiment
5. Combine with your favorite strategy
━━━━━━━━━━━━━━━━━━━━━━━━━━━━━━━━━━━━━━━━━━━━━━
Because good trading deserves good design. ✨
Made with 🔥 by R4D1
Part of the NEW AGE indicator collection.
New Age MACD █ NEW AGE MACD 🚀
It's 2025. We're still using indicators from the 90s... but who says they have to LOOK like the 90s? 😎
Traders deserve beautiful tools. Clean aesthetics. Modern vibes. Welcome to the New Age.
Based on CM_MacD_Ult_MTF by ChrisMoody - now reimagined with stunning neon visuals, dynamic glow effects, and an interface that actually looks good on your chart.
Same powerful MACD logic. Fresh new drip. ✨
█ FEATURES ✨
🔮 Neon Line Glow - MACD line glows dynamically based on trend
⚡ Multi-Timeframe - View any timeframe MACD on your current chart
🎯 4-Color Histogram - Gradient colors show momentum strength
🔀 Smart Fill - Beautiful fill between MACD & Signal
🔵 Cross Markers - Visual dots at bullish/bearish crossovers
📋 Elegant Dashboard - Real-time stats with cyan frame design
█ GLOW EFFECT ✨
The signature feature - a beautiful neon glow surrounding the MACD line:
💡 5 transparent layers create a smooth gradient glow
💡 Color follows trend direction automatically
💡 No chart scaling issues - glow follows the line perfectly
🟢 MACD > Signal → Cyan neon glow
🔴 MACD < Signal → Red neon glow
█ HISTOGRAM COLORS 📊
4 colors show momentum state at a glance:
| State | Color | Meaning |
|--------------------|---------------|----------------------|
| Above zero + rising | 🟢 Cyan bright | Strong bullish |
| Above zero + falling| 🟢 Cyan dim | Bullish but fading |
| Below zero + falling| 🔴 Red bright | Strong bearish |
| Below zero + rising | 🔴 Red dim | Bearish but recovering|
█ SIGNALS 🎯
🟢 Bull Cross → MACD crosses above Signal line
🔴 Bear Cross → MACD crosses below Signal line
🟢 Above Zero → MACD crosses above zero line
🔴 Below Zero → MACD crosses below zero line
█ SOURCE SETTINGS ⚙️
Choose the correct source for your chart type:
📊 NORMAL CANDLES:
Source: close (default)
✓ Standard closing price
✓ Most accurate readings
📊 HEIKIN ASHI CANDLES:
Source: ohlc4
✓ Formula: (Open + High + Low + Close) / 4
✓ Smoother MACD line
✓ Fewer false signals
💡 Quick Guide:
Normal Candles → close
Heikin Ashi → ohlc4
█ SETTINGS 🛠️
Timeframe:
⏰ Use Current Chart Resolution
🕐 Use Different Timeframe (MTF)
MACD Settings:
📈 Fast Length (default: 12)
📉 Slow Length (default: 26)
📊 Signal Length (default: 9)
Display Options:
📈 Show MACD & Signal Line
🔵 Show Dots at Cross
📊 Show Histogram
🔀 Show Fill Between MACD & Signal
✨ Show MACD Line Glow
🎨 MACD Color Change on Cross
🎨 Histogram 4 Colors
📋 Show Dashboard
█ DASHBOARD 📋
Elegant dark theme with cyan frame:
| Field | Description |
|-----------|------------------------------------|
| Value | Current MACD value |
| Signal | Signal line value |
| Histogram | MACD minus Signal |
| Zone | Strong Bull / Bullish / Bearish / Strong Bear |
| Trend | Bullish / Bearish |
| Momentum | Strong Up / Fading / Recovering / Strong Down |
| Signal | Current crossover status |
█ RECOMMENDED SETTINGS 📈
| Style | Chart | Source | Fast/Slow/Sig |
|------------------|-----------|--------|---------------|
| Scalping | Normal | close | 8 / 17 / 9 |
| Day Trading | Normal | close | 12 / 26 / 9 |
| Swing Trading | Heikin Ashi| ohlc4 | 12 / 26 / 9 |
| Position Trading | Heikin Ashi| ohlc4 | 19 / 39 / 9 |
█ ALERTS 🔔
🟢 MACD Bullish Cross
🔴 MACD Bearish Cross
🟢 MACD Above Zero
🔴 MACD Below Zero
█ USAGE TIPS 💡
📈 Quick Trend: Look at glow color for instant trend read
📊 Momentum: Watch histogram color transitions
🔍 Divergence: Compare price action with MACD peaks
⏰ Confluence: Use MTF for higher timeframe confirmation
█ COLOR SCHEME 🎨
| Element | Bullish | Bearish |
|------------|-----------|-----------|
| MACD Line | 🔵 Cyan | 🔴 Red |
| Glow | 🔵 Cyan | 🔴 Red |
| Histogram | 🔵 Cyan | 🔴 Red |
| Fill | 🔵 Cyan | 🔴 Red |
| Signal | ⚪ White | ⚪ White |
| Dashboard | 🔵 Cyan frame | 🔵 Cyan frame |
█ CREDITS 👏
Original concept: CM_MacD_Ult_MTF by ChrisMoody
Enhanced version: New Age MACD by RadisaBTC
If you find this indicator useful, please leave a 👍 and follow for more updates!
Because good trading deserves good design. 💎
Happy Trading! 🚀📈

Buffett Quality Filter (TTM)//@version=6
indicator("Buffett Quality Filter (TTM)", overlay = true, max_labels_count = 500)
// 1. Get financial data (TTM / FY / FQ)
// EPS (TTM) for P/E
eps = request.financial(syminfo.tickerid, "EARNINGS_PER_SHARE_BASIC", "TTM")
// Profitability & moat (annual stats)
roe = request.financial(syminfo.tickerid, "RETURN_ON_EQUITY", "FY")
roic = request.financial(syminfo.tickerid, "RETURN_ON_INVESTED_CAPITAL", "FY")
// Margins (TTM – rolling 12 months)
grossMargin = request.financial(syminfo.tickerid, "GROSS_MARGIN", "TTM")
netMargin = request.financial(syminfo.tickerid, "NET_MARGIN", "TTM")
// Balance sheet safety (quarterly)
deRatio = request.financial(syminfo.tickerid, "DEBT_TO_EQUITY", "FQ")
currentRat = request.financial(syminfo.tickerid, "CURRENT_RATIO", "FQ")
// Growth (1-year change, TTM)
epsGrowth1Y = request.financial(syminfo.tickerid, "EARNINGS_PER_SHARE_BASIC_ONE_YEAR_GROWTH", "TTM")
revGrowth1Y = request.financial(syminfo.tickerid, "REVENUE_ONE_YEAR_GROWTH", "TTM")
// Free cash flow (TTM) and shares to build FCF per share for P/FCF
fcf = request.financial(syminfo.tickerid, "FREE_CASH_FLOW", "TTM")
sharesOut = request.financial(syminfo.tickerid, "TOTAL_SHARES_OUTSTANDING", "FQ")
fcfPerShare = (not na(fcf) and not na(sharesOut) and sharesOut != 0) ? fcf / sharesOut : na
// 2. Valuation ratios from price
pe = (not na(eps) and eps != 0) ? close / eps : na
pFcf = (not na(fcfPerShare) and fcfPerShare > 0) ? close / fcfPerShare : na
// 3. Thresholds (Buffett-style, adjustable)
minROE = input.float(15.0, "Min ROE %")
minROIC = input.float(12.0, "Min ROIC %")
minGM = input.float(30.0, "Min Gross Margin %")
minNM = input.float(8.0, "Min Net Margin %")
maxDE = input.float(0.7, "Max Debt / Equity")
minCurr = input.float(1.3, "Min Current Ratio")
minEPSG = input.float(8.0, "Min EPS Growth 1Y %")
minREVG = input.float(5.0, "Min Revenue Growth 1Y %")
maxPE = input.float(20.0, "Max P/E")
maxPFCF = input.float(20.0, "Max P/FCF")
// 4. Individual conditions
cROE = not na(roe) and roe > minROE
cROIC = not na(roic) and roic > minROIC
cGM = not na(grossMargin) and grossMargin > minGM
cNM = not na(netMargin) and netMargin > minNM
cDE = not na(deRatio) and deRatio < maxDE
cCurr = not na(currentRat) and currentRat > minCurr
cEPSG = not na(epsGrowth1Y) and epsGrowth1Y > minEPSG
cREVG = not na(revGrowth1Y) and revGrowth1Y > minREVG
cPE = not na(pe) and pe < maxPE
cPFCF = not na(pFcf) and pFcf < maxPFCF
// 5. Composite “Buffett Score” (0–10) – keep it on ONE line to avoid line-continuation errors
score = (cROE ? 1 : 0) + (cROIC ? 1 : 0) + (cGM ? 1 : 0) + (cNM ? 1 : 0) + (cDE ? 1 : 0) + (cCurr ? 1 : 0) + (cEPSG ? 1 : 0) + (cREVG ? 1 : 0) + (cPE ? 1 : 0) + (cPFCF ? 1 : 0)
// Strictness
minScoreForPass = input.int(7, "Min score to pass (0–10)", minval = 1, maxval = 10)
passes = score >= minScoreForPass
// 6. Visuals
bgcolor(passes ? color.new(color.green, 80) : na)
plot(score, "Buffett Score (0–10)", color = color.new(color.blue, 0))
// Info label on last bar
var label infoLabel = na
if barstate.islast
if not na(infoLabel)
label.delete(infoLabel)
infoText = str.format(
"Buffett score: {0} ROE: {1,number,#.0}% | ROIC: {2,number,#.0}% GM: {3,number,#.0}% | NM: {4,number,#.0}% P/E: {5,number,#.0} | P/FCF: {6,number,#.0} D/E: {7,number,#.00} | Curr: {8,number,#.00}",
score, roe, roic, grossMargin, netMargin, pe, pFcf, deRatio, currentRat)
infoLabel := label.new(bar_index, high, infoText,
style = label.style_label_right,
color = color.new(color.black, 0),
textcolor = color.white,
size = size.small)


MTF RSI Stacked + AI + Gradient MTF RSI Stacked + AI + Gradient
Quick-start guide & best-practice rules
What the indicator does
Multi-Time-Frame RSI in one pane
• 10 time-frames (1 m → 1 M) are stacked 100 points apart (0, 100, 200 … 900).
• Each RSI is plotted with a smooth red-yellow-green gradient:
– Red = RSI below 30 (oversold)
– Yellow = RSI near 50
– Green = RSI above 70 (overbought)
• Grey 30-70 bands are drawn for every TF so you can see extremities at a glance.
Built-in AI (KNN) signal
• On every close of the chosen AI-time-frame the script:
– Takes the last 14-period RSI + normalised ATR as “features”
– Compares them to the last N bars (default 1 000)
– Votes of the k = 5 closest neighbours → BUY / SELL / NEUTRAL
• Confidence % is shown in the badge (top-right).
• A thick vertical line (green/red) is printed once when the signal flips.
How to read it
• Gradient colour tells you instantly which TFs are overbought/obove sold.
• When all or most gradients are green → broad momentum up; look for shorts only on lower-TF pullbacks.
• When most are red → broad momentum down; favour longs only on lower-TF bounces.
• Use the AI signal as a confluence filter, not a stand-alone entry:
– If AI = BUY and 3+ higher-TF RSIs just crossed > 50 → consider long.
– If AI = SELL and 3+ higher-TF RSIs just crossed < 50 → consider short.
• Divergences: price makes a higher high but 1 h/4 h RSI (gradient) makes a lower high → possible reversal.
Settings you can tweak
AI timeframe – leave empty = same as chart, or pick a higher TF (e.g. “15” or “60”) to slow the signal down.
Training bars – 500-2 000 is the sweet spot; bigger = slower but more stable.
K neighbours – 3-7; lower = more signals, higher = smoother.
RSI length – 14 is standard; 9 gives earlier turns, 21 gives fewer false swings.
Practical trading workflow
Open the symbol on your execution TF (e.g. 5 m).
Set AI timeframe to 3-5× execution TF (e.g. 15 m or 30 m) so the signal survives market noise.
Wait for AI signal to align with gradient extremes on at least one higher TF.
Enter on the first gradient reversal inside the 30-70 band on the execution TF.
Place stop beyond the swing that caused the gradient flip; target next opposing 70/30 level on the same TF or trail with structure.
Colour cheat-sheet
Bright green → RSI ≥ 70 (overbought)
Bright red → RSI ≤ 30 (oversold)
Muted colours → RSI near 50 (neutral, momentum pause)
That’s it—one pane, ten time-frames, colour-coded extremes and an AI confluence layer.
Keep the chart clean, use price action for precise entries, and let the gradient tell you when the wind is at your back.

NIFTY 5m/15m Smart Money CE/PE – High WinRatenice strategy for intraday NIFTY option trading. It works best on 5 minute time frame on NIFTY Index Chart

Gold-to-GDX Flow Ratio (Metal vs Miners)# 📊 Indicator: Gold/GDX Flow Ratio (Metal vs Miners)
🔎 What it does
This indicator tracks the **relative flow of capital between gold and gold miners (GDX ETF)**. By plotting the ratio of gold price to GDX, it shows whether investors are favoring the **metal itself** or the **equities that mine it**.
- **Ratio rising:** Flow favors gold (metal > miners).
- **Ratio falling:** Flow favors miners (miners > metal).
- **Crossovers:** Fast/slow EMA crossovers highlight regime shifts.
- **Z‑score bands:** ±2 standard deviations flag stretched conditions, often precursors to mean reversion.
⚙️ Features
- **Customizable inputs:** Choose spot gold (`XAUUSD`) or futures (`GC1!`), and GDX ETF.
- **Moving averages:** Fast and slow EMAs to define flow regimes.
- **Z‑score overlay:** Detects extremes in the ratio.
- **Alerts:** Triggered on regime flips or exhaustion signals.
- **Prompt flow option:** Displays the current ratio as a clear on‑screen figure for quick read.
🎭 Why it matters
- **Gold vs miners divergence:** Miners often amplify moves in gold, but sometimes decouple. This ratio helps spot those divergences early.
- **Flow diagnostics:** Instead of vague “profit taking” narratives, you see where capital is actually rotating.
- **Tactical entries:** Use resistance/stop‑cluster maps in gold together with this ratio to time miner trades more effectively.
🧭 How to use
1. Add the indicator to your chart.
2. Watch the **ratio trend**: rising = metal strength, falling = miner strength.
3. Use **EMA crossovers** as regime signals.
4. Treat **Z‑score extremes** as caution zones for stretched flows.
5. Combine with your VWAP and resistance overlays for execution discipline.

ORB_RDORB_RD - Opening Range Box (Ryan DeBraal)
This indicator automatically draws a high/low box for the first portion of
each trading day, automatically stepping the range window from 15, 30, 45,
up to 60 minutes after the session starts. The box updates live as the range
forms, then optionally extends across the rest of the session.
FEATURES
-----------------------------------------------------------------------------
• Opening Range Detection
- Automatically ladders the range window: 0–15, 0–30, 0–45, 0–60 minutes
- Automatic reset at each new trading day
- Live high/low updates while inside the 0–60 minute window
• Auto-Drawing Range Box
- Draws a dynamic rectangle as the range forms
- Top and bottom update with every new high/low
- Extends sideways in real time during formation
- Optional full-day extension after the 60-minute range finalizes
• Customizable Visuals
- Adjustable fill transparency
- Mild green tint by default for clarity
PURPOSE
-----------------------------------------------------------------------------
This tool highlights the evolving opening range, a widely used intraday
reference for breakout traders, mean-reversion setups, and session structure
analysis. Ideal for:
• Identifying early support and resistance
• Framing breakout and pullback decisions
• Tracking intraday trend bias after the morning range

Price Channel Breakout Strategy — Long & ShortThis strategy is a dual-direction Price Channel breakout system designed for high-volatility indices such as US30, NAS100, and XAUUSD.
It enters long when price breaks above the highest high of the past N bars, and enters short when price breaks below the lowest low.
A key feature is the use of fixed dollar-based take-profit and stop-loss, making the strategy adaptive across symbols with different tick values.
Core Logic
Long entry when price breaks the N-bar high
Short entry when price breaks the N-bar low
Dollar-based TP and SL (converted to ticks automatically)
Suitable for trending and breakout-friendly markets
Backtest Notes (US30 Example)
Sharpe Ratio: 2.7
Profit Factor: 2.111
Total Return (12-month backtest): +46.89%
Max Drawdown: 0.26%
Trades: 3,666
This strategy performs well in sustained volatility environments and is particularly effective for intraday momentum bursts on US30.

SUPER TREND + RSI FILTER PRO@version=5
indicator("SUPER TREND + RSI FILTER PRO", overlay=true, timeframe="", timeframe_gaps=true)
//---------------------------
// INPUTS
//---------------------------
factor = input.float(3.0, "SuperTrend Factor")
atr_len = input.int(10, "ATR Length")
rsi_len = input.int(14, "RSI Length")
rsi_buy = input.int(50, "RSI Buy Level")
rsi_sell = input.int(50, "RSI Sell Level")
//---------------------------
// SUPERTREND CALCULATION
//---------------------------
atr = ta.atr(atr_len)
upperBand = close + factor * atr
lowerBand = close - factor * atr
trend = 0.0
trend := close > nz(trend ) ? math.max(lowerBand, nz(trend )) : math.min(upperBand, nz(trend ))
// Coloration
bull = close > trend
bear = close < trend
//---------------------------
// RSI FILTER
//---------------------------
rsi = ta.rsi(close, rsi_len)
//---------------------------
// BUY & SELL SIGNALS
//---------------------------
buySignal = bull and rsi > rsi_buy and close > trend
sellSignal = bear and rsi < rsi_sell and close < trend
//---------------------------
// PLOT SUPERTREND
//---------------------------
plot(trend, color=bull ? color.green : color.red, linewidth=2, title="SuperTrend")
//---------------------------
// BUY / SELL MARKERS
//---------------------------
plotshape(buySignal, title="Buy", style=shape.labelup, color=color.green, size=size.small, text="BUY")
plotshape(sellSignal, title="Sell", style=shape.labeldown, color=color.red, size=size.small, text="SELL")
//---------------------------
// ALERTS
//---------------------------
alertcondition(buySignal, title="Buy Signal", message="BUY Signal - SuperTrend + RSI Filter")
alertcondition(sellSignal, title="Sell Signal", message="SELL Signal - SuperTrend + RSI Filter")


BTC Strategy Institutional Multi-Factor EngineThis indicator is designed to bring an institutional grade analytical framework to Bitcoin trading by synthesizing technical price action with deeper market drivers such as Open Interest, volume flow, and macro correlations. Unlike standard indicators that often rely on a single metric, this tool employs an ensemble Machine Learning engine that aggregates and weights various factors ranging from momentum and mean reversion to cross-market data to generate high-probability entry signals. To ensure these signals remain robust against typical crypto volatility, the raw data is processed through an adaptive Kalman Filter rather than traditional moving averages, providing a significantly clearer view of the true underlying trend.
What distinguishes this tool is its built in paper trading simulation engine. While it functions technically as an indicator, it actively tracks hypothetical trade execution in the background to display real time performance metrics such as Win Rate, Profit Factor, and Drawdown directly on the dashboard, giving you immediate insight into the strategy's current effectiveness without needing to run a separate backtest. The system also integrates advanced risk management modules, including a Liquidation Cascade detection system that temporarily blocks signals during violent sell-offs to prevent catching "falling knives," as well as dynamic signal thresholds that automatically adjust based on market stress. By further contextualizing price action within the 4-year halving cycle and filtering out low-liquidity weekend noise, this strategy aims to align short-term execution with the broader market regime, offering a complete, data-driven trading system in a single chart overlay.

Session important reference linesThis indicator automatically plots crucial price reference points for the Regular Trading Hours (RTH) session, including Yesterday's High/Low/Close, Session Open, Midpoint, and the Initial Balance (IB) range with its 2x extension .
In the example above the lines are:
Dotted green - Today's open price
Dashed yellow - Today's mid line
Solid yellow - Initial Balance high/low
Dotted yellow - Initial Balance extension
Dotted dark green - Previous session high
Dotted dark red - Previous session low
Dotted orange - Previous session close

Opcje: Sugestia Strike'ów (HV Based)How to interpret this script?
1. Dotted Lines:
Red (Upper): The price level above which the asset is statistically unlikely to rise within X days. This is where you look for a Strike Price to sell a CALL option (Short Call).
Green (Lower): The price level below which the asset is statistically unlikely to fall. This is where you look for a Strike Price to sell a PUT option (Short Put).
2. Sigma Multiplier (Important!):
The default setting is 2.0. This represents 2 Standard Deviations.
In a normal distribution, 2 standard deviations cover approximately 95% of outcomes.
This means you theoretically have a 95% probability that the option will expire worthless (meaning you keep the full premium), but the premium received will be lower.
If you change it to 1.0, you will be closer to the current price = higher premium, but the risk of assignment (exercise) increases to about 32%.
3. DTE (Days to Expiration):
Enter the actual number of days for the option you intend to sell (e.g., 45). The script will calculate where the price might be in 45 days based on current volatility.

RSI < 25 + Price Below 200 SMA (4H) - Text Signal
Price below 200MA on 4hr chart
RSI is below 25 ovsersold
Start buying small positions at every signal
Eventually price will capture the 200MA on 4hr
This will work great for NVDA, AAPL, MSFT, NFLX, PANW, AMZN, PLTR, CRWD and META.
Good for swing trading based on price action, RSI oversold and reversal
Add more on the Pin bar candles on 4hr time frame once the price is oversold.

BankNifty - 2x Nifty Differencedifference between Banknifty near month future - 2x nifty near month future
