V-CORE SMA Matrix LiteV-CORE SMA Matrix Lite
A clean, lightweight 5-SMA structure tool built using Pine Script v6.
This open-source Lite edition provides a simple visual framework for identifying market structure using the most commonly used moving averages:
21 SMA
50 SMA
80 SMA
100 SMA
200 SMA
Each line is individually adjustable and colour-coded for easy trend reading.
No signals, no alerts, no automation — purely a visual tool for traders who prefer clarity over complexity.
This Lite version exposes only basic, non-proprietary logic.
Advanced regime systems, multi-stage confirmation models, and automation features are available only in the full V-CORE Engine suite.
Part of the V-CORE Lite Series
Free open-source tools designed for education, research, and clean charting.
Follow our work:
TradingView: VectorCoresAI
X (Twitter): vectorcoresai
Telegram: vectorcoresai
Indicators and strategies

Distance From MA 52W Low+High This script shows the distance in percentage form of price from its ema and 52 week high and low. It can be seen on the chart as line or pinned to the scale as in the picture above.

DIY ZP + Scalps: Multi-System Confirmation & Fast Scalping💡 Overview
This is an advanced, amalgamated trend-following and momentum indicator designed to provide dual-layer signals: a highly Confirmed (Low-Risk) Signal for swing/position trades, and a Fast Scalping Signal for high-frequency entries.
It combines the logic of a multi-indicator confirmation system (derived from "DIY ZP" concepts) with a sensitive momentum crossover system (derived from "Scalp Pro" concepts).
✨ Key Features
Dual-Signal Output: Separates signals into "CONFIRM" (high probability, slow) and "SP Buy/Sell" (high sensitivity, fast).
Multi-Confirmation Engine: The primary "CONFIRM" signals only fire when ALL enabled filtering criteria agree within a user-defined expiry window:
EMA 200 Filter (Trend Direction)
MACD Crossover (Momentum)
Supertrend (Volatility/Trend Structure)
Fast Scalp Pro Momentum: Uses a proprietary, low-latency, zero-lagged filter to generate rapid "SP Buy/Sell" signals for immediate execution.
Integrated Trend Lines: Plots EMA (200), MA (5, 13, 50), and Supertrend on the chart for visual context and trailing stops.
All-in-One Alerts: Features separate alertcondition() calls for Primary, Scalp Pro, and Supertrend Reversal events, making it easy to set up mobile notifications for specific trade styles.
⚙️ How to Use
Select Your Style: Use the input settings to enable/disable the primary filters (EMA, MACD, Supertrend) to customize the confirmation strictness.
CONFIRM LONG/SHORT (Primary Signal): Recommended for swing traders. These signals are delayed but offer higher probability as they satisfy all major trend and momentum conditions.
SP Buy/Sell (Scalp Pro Signal): Recommended for scalpers and day traders. Use this signal to enter early, but manage risk strictly (e.g., using a 1.0 ATR target to move to break-even immediately).
Risk Management: The integrated Supertrend line serves as an excellent dynamic trailing stop loss.
📝 Important Note
The indicator calculates internal momentum lines (Scalp Pro MACD/Signal) with high values to ensure accuracy. These lines are explicitly hidden (display.none) to prevent distortion of your main price chart's overlay.

OTA ATR Stop BufferOTA ATR indicator calculates and displays the Daily Average True Range (ATR), and two customizable ATR percentage values in a clean table format. It provides values in ticks and points, helping traders set stop-loss buffers based on market volatility.


Reversal_Detector//@version=6
indicator("상승 반전 탐지기 (Reversal Detector)", overlay=true)
// ==========================================
// 1. 설정 (Inputs)
// ==========================================
rsiLen = input.int(14, title="RSI 길이")
lbR = input.int(5, title="다이버전스 확인 범위 (오른쪽)")
lbL = input.int(5, title="다이버전스 확인 범위 (왼쪽)")
rangeUpper = input.int(60, title="RSI 과매수 기준")
rangeLower = input.int(30, title="RSI 과매도 기준")
// ==========================================
// 2. RSI 상승 다이버전스 계산 (핵심 로직)
// ==========================================
osc = ta.rsi(close, rsiLen)
// 피벗 로우(Pivot Low) 찾기: 주가의 저점
plFound = na(ta.pivotlow(osc, lbL, lbR)) ? false : true
// 다이버전스 조건 확인
// 1) 현재 RSI 저점이 이전 RSI 저점보다 높아야 함 (상승)
// 2) 현재 주가 저점이 이전 주가 저점보다 낮아야 함 (하락)
showBull = false
if plFound
// 이전 피벗 지점 찾기
oscLow = osc
priceLow = low
// 과거 데이터를 탐색하여 직전 저점과 비교
for i = 1 to 60
if not na(ta.pivotlow(osc, lbL, lbR) ) // 이전에 저점이 있었다면
prevOscLow = osc
prevPriceLow = low
// 다이버전스 조건: 가격은 더 떨어졌는데(Lower Low), RSI는 올랐을 때(Higher Low)
if priceLow < prevPriceLow and oscLow > prevOscLow and oscLow < rangeLower
showBull := true
break // 하나 찾으면 루프 종료
// ==========================================
// 3. 보조 조건 (MACD 골든크로스 & 이평선)
// ==========================================
= ta.macd(close, 12, 26, 9)
macdCross = ta.crossover(macdLine, signalLine) // MACD 골든크로스
ma5 = ta.sma(close, 5)
ma20 = ta.sma(close, 20)
maCross = ta.crossover(ma5, ma20) // 5일선이 20일선 돌파
// ==========================================
// 4. 시각화 (Plotting)
// ==========================================
// 1) 상승 다이버전스 발생 시 (강력한 바닥 신호)
plotshape(showBull,
title="상승 다이버전스",
style=shape.labelup,
location=location.belowbar,
color=color.red,
textcolor=color.white,
text="Bull Div (바닥신호)",
size=size.small,
offset=-lbR) // 과거 시점에 표시
// 2) MACD 골든크로스 (추세 확인용)
plotshape(macdCross and macdLine < 0, // 0선 아래에서 골든크로스 날 때만
title="MACD 골든크로스",
style=shape.triangleup,
location=location.belowbar,
color=color.yellow,
size=size.tiny,
text="MACD")
// 3) 이동평균선
plot(ma5, color=color.blue, title="5일선")
plot(ma20, color=color.orange, title="20일선")
// 알림 설정
alertcondition(showBull, title="상승 다이버전스 포착", message="상승 다이버전스 발생! 추세 반전 가능성")

Candle Points (Based on High/Low)Places a dot on the candle at the 25% 50% and 75% mark.
Candle body opacity needs to reduced to see the dots when then are within the candle body.

MACD Ultimate MTF [Radisa] MACD Ultimate MTF - Enhanced MACD with Beautiful Fills
Based on the legendary CM_MacD_Ult_MTF by ChrisMoody - upgraded to Pine Script v5 with beautiful gradient fills and an informative dashboard.
🎯 FEATURES:
- Multi-timeframe support (MTF) - view higher timeframe MACD on any chart
- Beautiful fill between MACD & Signal line
- 4-color histogram (strong/weak bull & bear)
- Smooth lines on current timeframe (no stepping)
- Cross signals with dot markers
- Real-time info dashboard
- Fully customizable colors
📊 SIGNALS:
- 🟢 Bullish Cross: MACD crosses above Signal
- 🔴 Bearish Cross: MACD crosses below Signal
- Histogram color intensity shows momentum strength
📈 HISTOGRAM COLORS:
- Bright Green: Above zero + rising (strong bullish)
- Dark Green: Above zero + falling (weakening bullish)
- Bright Red: Below zero + falling (strong bearish)
- Dark Red: Below zero + rising (weakening bearish)
⚙️ SETTINGS:
- Fast/Slow/Signal Length (default: 12/26/9)
- Use current or custom timeframe
- Toggle MACD line, Signal line, Histogram
- Toggle fills and color changes
- Customizable colors for all elements
💡 DASHBOARD SHOWS:
- MACD value with colored background
- Signal value
- Histogram value
- Trend direction (Bullish/Bearish)
- Momentum strength (Strong/Fading)
- Current timeframe
Perfect for trend-following strategies. Combine with RSI or Supertrend for confirmation.
Works on Crypto, Forex, Stocks - all timeframes.

Today Low ± 50 LevelsThis script plots two dynamic horizontal lines based on today’s daily low. One line is placed 50 points above the low and the other 50 points below it. The lines update automatically each new day and appear on any timeframe

Elliott Wave Full Fractal System CleanElliott Wave: Full Fractal System (Automated)
This script is a complete Fractal Trading System that automates Elliott Wave analysis. It moves beyond simple wave counting by combining multi-degree wave detection (Primary, Intermediate, Minor) with an automated "Sniper" entry strategy based on high-probability Wave 4 pullbacks.
1. Idea of the Script This tool acts as an educational Elliott Wave assistant that automatically:
Detects Swings: Uses a pivot engine (ZigZag-like logic) to identify key market structure.
Identifies Impulses: Scans for valid 1–5 motive waves across multiple timeframes.
Visualizes Corrections: Detects and labels A-B-C corrective phases after an impulse.
Executes Strategy: Adds a strategy layer on the Intermediate degree to backtest optimal entry zones.
2. How it Works: The "Fractal Sniper" Strategy The script applies strict algorithmic logic to Elliott Wave Theory. It analyzes the Intermediate (Green) degree to generate signals:
Step 1: The Setup (Wave 3 Identification) The script scans for a valid Wave 3 impulse. It ensures Wave 3 is not the shortest and the structure respects fractal rules.
Step 2: The "Wait" Phase (Target Zone) Once Wave 3 is confirmed, the script projects a Box (Green for Long, Red for Short). You will see a label: WAIT FOR DIP. Logic: We wait for price to retrace to the 50% Fibonacci level (The Golden Zone). We do not chase the top of Wave 3.
Step 3: The Trigger ("Sniper" Entry) A trade is triggered only when price touches the specific entry zone while maintaining structure. Signal: Sniper Long 🚀 or Sniper Short 🔻.
Step 4: Automated Risk Management
Stop Loss (SL): Placed at the extremum of Wave 1 (Theory: Wave 4 cannot overlap Wave 1).
Take Profit (TP): Placed at the 1.618 Fibonacci Extension of Wave 5.
3. 📊 Visual Legend (Fractal Degrees) The script analyzes three timeframes simultaneously. Use this guide to read the chart:
🔵 Blue (Primary Degree): Macro Trend. Marked with Circles (①, ②...). Use this for overall market bias.
🟢 Green (Intermediate Degree): The Trading Layer. Marked with Parentheses ((1), (2)...). All Strategy Signals are generated from this degree.
🔴 Red (Minor Degree): Micro Structure. Marked with Roman Numerals (i, ii...). Useful for seeing the sub-waves inside larger moves.
4. 📉 A-B-C Corrections (Visual Only) The script automatically detects and labels corrective phases (A, B, C) following a 5-wave impulse.
Function: These labels indicate that the trend is correcting or resting.
Note: The "Strategy" (Buy/Sell logic) ignores these A-B-C labels. It sees the correction and draws it for your awareness, but it does not risk money on counter-trend moves.
5. ⚠️ CRITICAL NOTE ON BACKTESTING & LAG This strategy uses ta.pivothigh and ta.pivotlow to identify wave structures.
The Lag: Pivot points are lagging indicators. A pivot is only mathematically confirmed X bars after the peak or valley has occurred.
The Backtest: While the labels are drawn historically on the correct bars, the strategy logic strictly waits for the pivot confirmation before generating a signal. This prevents "repainting" in live trading, but users must understand that the signal occurs after the pivot is locked in.
6. Settings Included
Degrees: Customizable lookback lengths for Primary, Intermediate, and Minor waves.
Strict Rules: Toggle to enforce standard Elliott rules (e.g., No Overlap).
Realistic Simulation: Commission and slippage are enabled in the strategy settings to provide realistic results.
Disclaimer: This script is for educational and research purposes only. It applies strict algorithmic logic to Elliott Wave Theory, but wave counting is inherently subjective. Past performance does not guarantee future results.

Fib Golden RatioDynamic Fib High → Low (0.5 & 0.618)
This indicator automatically tracks the current day’s High and Low and plots the key Fibonacci retracement levels 0.5 (50%) and 0.618 (Golden Ratio) based on the live intraday price range.
The tool is designed for traders who want simple, clean, and dynamic intraday Fibonacci levels without clutter on the chart.
How It Works
Detects the start of a new trading day
Tracks the highest high and lowest low of the current day
Continuously recalculates:
Fibonacci 0.5 (Midpoint)
Fibonacci 0.618 (Golden Ratio)
Plots clean continuous lines across the chart
Fib is calculated from High → Low, matching how typical intraday fib tools are visually applied
Why This Indicator
No drawings to manually adjust
No user configuration required
Extremely lightweight and fast
Automatically adjusts as the day progresses
Perfect for identifying intraday mean reversion zones, pullback zones, and reaction levels
Ideal Use Cases
Intraday directional trading
Scalping pullbacks
Mean reversion setups
Identifying dynamic support/resistance zones
Option scalping (CE/PE)

Algo ۞ Halo 7MAs WonderA complete trend following and important MA crossing tool.
The indicator is self-explanatory. You decide where you want the triggers to go.
Enjoy!

Institutional Moving Averages (50/100/200)A streamlined Moving Average suite designed for institutional-style trend analysis. This indicator plots the three most critical trend baselines used by traders and funds:
50 MA (Blue): Short-term trend and momentum.
100 MA (Orange): Medium-term support/resistance.
200 MA (Purple): Long-term trend definition (Bull/Bear line).
Features:
Fully Customizable: Switch between SMA, EMA, WMA, RMA, or HMA.
Clean Visuals: Optimized colors for dark and light themes.
Native Performance: Uses standard TradingView plotting for maximum speed and compatibility with the "Style" tab visibility settings.

Stochastic Signalbuy and sell indicator for slow stochastic, basic indicator to show buy and sell position based on slow stochastic 3 minute time frame.

Fixed Dollar Risk Lines V2*This is a small update to the original concept that adds greater customization of the visual elements of the script. Since some folks have liked the original I figured I'd put this out there.*
Fixed Dollar Risk Lines is a utility indicator that converts a user-defined dollar risk into price distance and plots risk lines above and below the current price for popular futures contracts. It helps you place stops or entries at a consistent dollar risk per trade, regardless of the market’s tick value or tick size.
What it does:
-You choose a dollar amount to risk (e.g., $100) and a futures contract (ES, NQ, GC, YM, RTY, PL, SI, CL, BTC).
The script automatically:
-Looks up the contract’s tick value and tick size
-Converts your dollar risk into number of ticks
-Converts ticks into price distance
Plots:
-Long Risk line below current price
-Short Risk line above current price
-Optional labels show exact price levels and an information table summarizes your settings.
Key features
-Consistent dollar risk across instruments
-Supports major futures contracts with built‑in tick values and sizes
-Toggle Long and Short risk lines independently
-Customizable line width and colors (lines and labels)
-Right‑axis price level display for quick reading
-Compact info table with contract, risk, and computed prices
Typical use
-Long setups: use the green line as a stop level below entry to match your chosen dollar risk.
-Short setups: use the red line as a stop level above entry to match your chosen dollar risk.
-Quickly compare how the same dollar risk translates to distance on different contracts.
Inputs
-Risk Amount (USD)
-Futures Contract (ES, NQ, GC, YM, RTY, PL, SI, CL, BTC)
-Show Long/Short lines (toggles)
-Line Width
-Colors for lines and labels
Notes
-Designed for futures symbols that match the listed contracts’ tick specs. If your symbol has different tick value/size than the defaults, results will differ.
-Intended for educational/informational use; not financial advice.
-This tool streamlines risk placement so you can focus on execution while keeping dollar risk consistent across markets.

BTC Price Prediction Model [Global PMI]🇨🇳 中文说明 (Chinese Version)
1. 简介
本指标由 GW Capital 使用 Gemini Vibe Coding 技术制作。利用先进的 AI 编程能力,将复杂的宏观经济模型重构为可执行的交易工具。
2. 致谢
特别感谢模型原作者 Marty Kendall。他对这一算法的研究奠定了基础,揭示了比特币价格与宏观经济因素之间的深层联系。
3. 模型原理与公式
该模型基于四大宏观经济支柱计算比特币的“公允价值”。它假设比特币的价格是全球流动性、网络安全性、风险偏好和经济周期的函数。
模型公式
$$\ln(BTC) = \alpha + (1 + \beta \cdot PMI_{z}) \times $$
全球流动性 (M2): 美、中、欧、日四大经济体的 M2 总量(折算为美元)。代表可流入资产的法币资金池。
网络安全性 (Hashrate): 比特币全网算力,代表网络的物理安全性和实用价值。
风险偏好 (S&P 500): 作为全球风险情绪的代理指标。
经济周期 (PMI Z-Score): 美国制造业 PMI 用于根据商业周期(扩张 vs 收缩)来放大或抑制估值。
4. 指标用法
指标会在图表上绘制 公允价值 (白线) 以及基于统计偏差 (Z-Score) 的四条情绪带。
情绪区间
🚨 极度贪婪 (红色区域): 价格 > +0.3 标准差。历史上通常预示市场顶部或情绪过热。
⚠️ 一般贪婪 (橙色区域): 价格 > +0.15 标准差。多头动能强劲,但需谨慎。
⚖️ 公允价值 (白线): 基于宏观数据的理论“正确”价格。
😨 一般恐惧 (青色区域): 价格 < -0.15 标准差。进入低估区域。
💎 极度恐惧 (绿色区域): 价格 < -0.3 标准差。历史上通常是代际级别的买入机会。
情绪评分 (0-100)
100: 极度贪婪 (顶部)
50: 公允价值
0: 极度恐惧 (底部)
5. 使用建议
周期: 仅限日线 (1D) 或周线 (1W)。
原因: 底层数据源(M2, PMI)是月度更新的。标普500和算力是日度更新的。在日内图表(如15分钟、1小时、4小时)上使用此指标没有任何意义,因为基本面数据不会变化得那么快。
长期视角: 这是一个宏观周期指标,旨在识别数月甚至数年的周期顶部和底部,而非用于日内交易。
6. 免责声明
本指标仅供教育和参考使用,不构成任何财务建议。该模型依赖于历史相关性,未来可能不再适用。所有交易均涉及风险。GW Capital 及制作者不对任何交易损失承担责任。
🇺🇸 English Guide (英文说明)
1. Introduction
This indicator was created by GW Capital using Gemini Vibe Coding technology. It leverages advanced AI coding capabilities to reconstruct complex macroeconomic models into actionable trading tools.
2. Credits
Special thanks to the original model author, Marty Kendall. His research into the correlation between Bitcoin's price and macroeconomic factors lays the foundation for this algorithm.
3. Model Principles & Formula
This model calculates the "Fair Value" of Bitcoin based on four key macroeconomic pillars. It assumes that Bitcoin's price is a function of Global Liquidity, Network Security, Risk Appetite, and the Economic Cycle.
The Formula
$$\ln(BTC) = \alpha + (1 + \beta \cdot PMI_{z}) \times $$
Global Liquidity (M2): Sum of M2 supply from US, China, Eurozone, and Japan (converted to USD). Represents the pool of fiat money available to flow into assets.
Network Security (Hashrate): Bitcoin's hashrate, representing the physical security and utility of the network.
Risk Appetite (S&P 500): Used as a proxy for global risk sentiment.
Economic Cycle (PMI Z-Score): US Manufacturing PMI is used to amplify or dampen the valuation based on where we are in the business cycle (Expansion vs. Contraction).
4. How to Use
The indicator plots the Fair Value (White Line) and four sentiment bands based on statistical deviation (Z-Score).
Sentiment Zones
🚨 Extreme Greed (Red Zone): Price > +0.3 StdDev. Historically indicates a market top or overheated sentiment.
⚠️ Greed (Orange Zone): Price > +0.15 StdDev. Bullish momentum is strong but caution is advised.
⚖️ Fair Value (White Line): The theoretical "correct" price based on macro data.
😨 Fear (Teal Zone): Price < -0.15 StdDev. Undervalued territory.
💎 Extreme Fear (Green Zone): Price < -0.3 StdDev. Historically a generational buying opportunity.
Sentiment Score (0-100)
100: Maximum Greed (Top)
50: Fair Value
0: Maximum Fear (Bottom)
5. Usage Recommendations
Timeframe: Daily (1D) or Weekly (1W) ONLY.
Reason: The underlying data sources (M2, PMI) are updated monthly. The S&P 500 and Hashrate are daily. Using this indicator on intraday charts (e.g., 15m, 1h, 4h) adds no value because the fundamental data does not change that fast.
Long-Term View: This is a macro-cycle indicator designed for identifying cycle tops and bottoms over months and years, not for day trading.
6. Disclaimer
This indicator is for educational and informational purposes only. It does not constitute financial advice. The model relies on historical correlations which may not hold true in the future. All trading involves risk. GW Capital and the creators assume no responsibility for any trading losses.

Physics of PricePhysics of Price is a non-repainting kinematic reversal and volatility overlay. It models price as a physical object with position, velocity, and acceleration, then builds adaptive bands and a short-term predictive “ghost cone” to highlight where reversals are statistically more likely.
CONCEPT
Instead of using only moving averages, the core engine tracks a smoothed price (position), trend speed (velocity), and change in trend speed (acceleration). Standard deviation of the model error defines probabilistic bands around this kinematic centerline. When price stretches too far away and snaps back, the move is treated as a potential exhaustion event.
CORE COMPONENTS
– Kinematic centerline (Alpha–Beta–Gamma style filter) that bends with trend instead of lagging like a simple MA.
– Inner and outer bands based on the standard deviation of residuals between price and the kinematic model.
– Regime filter using R² and band width to avoid signals in chaotic or ultra-wide regimes.
– Optional RSI “hook” filter that waits for momentum to actually turn instead of buying into a falling RSI.
– Optional divergence add-on using kinematic velocity, so a marginal new price extreme with weaker velocity is recognized as a possible exhaustion pattern.
REVERSAL EVENTS AND SCORING
Raw events are detected when price wicks through the outer band and closes back inside (band hit with snap). These are plotted as diamonds and treated as candidates, not automatic trades.
Each event is then scored from 0 to 100 using several factors:
– How far price overshot the outer band.
– How strongly it snapped back inside.
– Whether an RSI hook is present (if enabled).
– Regime quality from the kinematic model.
– Basic kinematic safety to avoid the most aggressive “knife-catch” situations.
– Optional divergence bonus when price makes a new extreme but velocity does not.
Only events with a score above the chosen threshold become confirmed signals (triangles labeled PHYSICS REV).
GHOST CONE (PREDICTIVE BAND)
On the latest bar, the script projects a short-horizon “ghost cone” into the future using position, velocity, and a damped acceleration term. This creates a curved predictive band that visualizes a plausible short-term path and range, rather than a simple straight line. The cone is meant as context for trade management and risk, not as a hard target.
FILTERS AND OPTIONS
– Regime filter (R² and band width) can be tightened or relaxed depending on how selective you want the engine to be.
– RSI and volume filters can be toggled on for extra confirmation or off to see the raw kinematic behavior.
– An optional trend baseline (EMA) can be enabled to bias or restrict reversals relative to a higher-timeframe trend.
– Dynamic cooldown scales with volatility so the script does not spam signals in fast environments.
HOW TO USE
Physics of Price is primarily a mean-reversion and exhaustion tool. It works best in markets that respect ranges, swings, and two-sided order flow. Confirmed PHYSICS REV signals near the outer bands, with decent model health and a clean RSI hook, are the core use case. The bands and ghost cone can also be used as a context overlay alongside your own entries, exits, and risk framework.
This is an indicator, not a complete trading system. It does not use lookahead or higher-timeframe security calls and is designed for “once per bar close” alerts. Always combine it with your own risk management and confluence.

Session Opening Range Breakout (ORBO)This strategy automates a classic Opening Range Breakout (ORBO) approach: it builds a price range for the first minutes after the market opens, then looks for strong breakouts above or below that range to catch early directional moves.
Concept
The idea behind ORBO is simple:
The first minutes after the session open are often highly informative.
Price forms an “opening range” that acts as a mini support/resistance zone.
A clean breakout beyond this zone can lead to high-momentum moves.
This script turns that logic into a fully backtestable strategy in TradingView.
How the strategy works
Opening Range Session
Default session: 09:30–09:50 (exchange time)
During this window, the script tracks:
orHigh → highest high within the session
orLow → lowest low within the session
This forms your Opening Range for the day.
Breakout Logic (after the window ends)
Once the defined session ends:
Long Entry:
If the close crosses above the Opening Range High (orHigh),
→ strategy.entry("OR Long", strategy.long) is triggered.
Short Entry:
If the close crosses below the Opening Range Low (orLow),
→ strategy.entry("OR Short", strategy.short) is triggered.
Only one opening range per day is considered, which keeps the logic clean and easy to interpret.
Daily Reset
At the start of a new trading day, the script resets:
orHigh := na
orLow := na
A fresh Opening Range is then built using the next session’s 09:30–09:50 candles.
This ensures entries are always based on today’s structure, not yesterday’s.
Visuals & Inputs
Inputs:
Opening range session → default: "0930-0950"
Show OR levels → toggle visibility of OR High / Low lines
Fill range body → optional shaded zone between OR High and OR Low
Chart visuals:
A green line marks the Opening Range High.
A red line marks the Opening Range Low.
Optional yellow fill highlights the entire OR zone.
Background shading during the session shows when the range is currently being built.
These visuals make it easy to see:
Where the OR sits relative to current price
How clean / noisy the breakout was
How often price respects or rejects the opening zone
Backtesting & Optimization
Because this is written as a strategy():
You can use TradingView’s Strategy Tester to view:
Win rate
Net profit
Drawdown
Profit factor
Equity curve
Ideas to experiment with:
Change the session window (e.g., 09:15–09:45, 10:00–10:30)
Apply to different:
Markets: indices, FX, crypto, stocks
Timeframes: 1m / 5m / 15m
Add your own:
Stop Loss & Take Profit levels
Time filters (only trade certain days / times)
Volatility filters (e.g., ATR, range size thresholds)
Higher-timeframe trend filter (e.g., only take longs above 200 EMA)

FRAN CRASH PLAY RULESA script with purely descriptive nature is one that:
• Only describes actions, settings, characters, and events.
• Contains no dialogue, commands, or instructions for execution.
• Does not specify plot decisions, logic, or interactive elements.
• Reads like a detailed narrative blueprint, focusing on what exists or happens rather than what anyone should do.


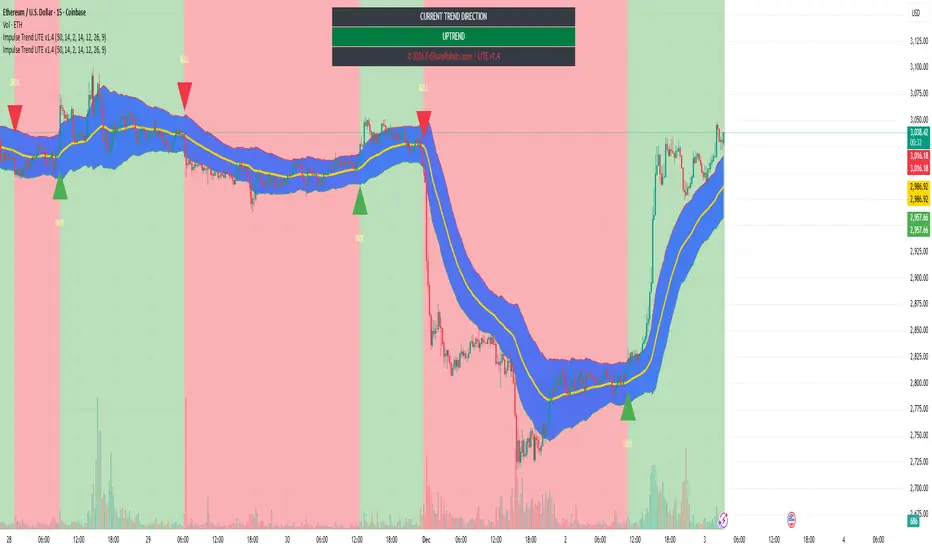
Impulse Trend Suite (LITE) — v1.4 source🚀 Impulse Trend Suite (LITE) — v1.4
Smart trend visualization with precise flip arrows. A lightweight, momentum-filtered trend tool designed to stay clean, avoid repeated signals, and keep you focused only on real market direction.
✨ What’s New in v1.4
Minor upgrades mostly visual
Added Blue fill between MA lines
clearer labels
📌 Core Features
Trend flip arrows (no spam, 1 signal per turn)
Continuous background zones (gap-free trend shading)
Adaptive Baseline + ATR structure channel
RSI + MACD momentum filter (suppresses weak signals)
Trend Status Panel (UP, DOWN, NEUTRAL)
🔍 Quick Guide
BUY setup = green arrow + green background
SELL setup = red arrow + red background
Stay in the move while color doesn’t change
ATR channel helps avoid chasing overextended candles
🆚 LITE vs PRO
Feature LITE PRO
--------------------- -------- ------------------------------
Trend shading + arrows ✔ ✔ + confirmations
Neutral trend state ✔ ✔ enhanced
Alerts ✖ ✔ full suite
Reversal Zones ✖ ✔ predictive boxes
HTF Filter ✖ ✔ smarter trend bias
Included strategies ✖ ✔ + PDF training
========================================================
🔓 Upgrade to PRO
Reversal Zones • Alerts • HTF Filter • Trend Continuation Strategy
👉 fxsharerobots.com/impulse-trend-pro/
📈 Works on Forex, Stocks, Crypto, Indices, Metals
⌚ Scalping • Intraday • Swing • Long-term
==========================================================
⚠️ LITE - Educational tool. Backtest before trading live.
Visit us for Full Trading Tools Collection here:
fxsharerobots.com/downloads/
Happy trading! — FxShareRobots Team
Aroon + Chaiki OscillatorThis is an Chaiki Oscillator that facilitates more straightforward trendline analysis utilizing the Aroon setup for bars.
This is a simple Pinescript designed for incorporation into your charting analysis.
As always, none of this is investment or financial advice. Please do your own due diligence and research.

Smart Donchian Channel Hariss 3691. The Donchian Channel is a trend-following indicator. It’s primarily used to identify volatility, breakouts, and price trends.
The channel is composed of three lines:
Upper Band: The highest high over a specified period (e.g., 20 bars).
Lower Band: The lowest low over the same period.
Middle Line (optional): The average of the upper and lower bands.
2. How the Donchian Channel Detects Price Momentum
The Donchian Channel is based on price extremes, which inherently reflects momentum and market sentiments.
Price Above Midline / Upper Band: Indicates strong bullish momentum. Buyers are dominating, pushing price toward new highs.
Price Below Midline / Lower Band: Indicates strong bearish momentum. Sellers are in control, pushing price toward new lows.
Price Touching the Bands:
Upper band breakout: A potential continuation of an uptrend or trend initiation.
Lower band breakout: A potential continuation of a downtrend or trend initiation.
Bounce from the bands: Signals potential reversals or retracements.
Essentially, the Donchian Channel acts as a dynamic support and resistance level.
3. Interpreting Market Conditions
Trending Markets:
Price moves along or breaks out from the upper/lower band. Donchian Channel expands as volatility increases. Breakouts from the channel often indicate continuation of the trend.
Sideways/Range-Bound Markets:
Price oscillates between upper and lower bands. Channel width narrows. Bounces from upper/lower bands may produce false signals unless filtered by volume or trend indicators.
4. Trading Applications
Breakout Strategy:
Buy when price closes above the upper band.
Sell when price closes below the lower band.
Useful for trend-following systems.
Reversal/Bounce Strategy:
Buy when price bounces from the lower band.
Sell when price rejects the upper band.
How this indicator has been designed to reduce false signals:
Buy signal fires when price bounces from the lower band with high volume (1.5), bullish RSI and DMI/ADX.
Sell signal fires when price reverses from upper band with high volume (1.5) with bearish RSI and DMI/ADX.
One can change the RSI and RVOL setting according to trading style and class assets being traded.
Trading With this Indicator:
Buy when the signal is fired to buy, place Stop Loss just below the low of last candle and take profit @1.5 or 2 times of stop loss.
Sell when the signal is fired to sell, place stop loss just above the high of the last candle and take profit @1.5 or 2 times of stop loss.
It is to note that, this indicator is a trend following indicator, so be with the trend will avoid missing out trend following levels or early exit.
