Indicators and strategies
Impulse Trend Suite (LITE) — v1.3🚀 Impulse Trend Suite (LITE) — v1.3
Smart trend visualization with precise flip arrows. A lightweight, momentum-filtered trend tool designed to stay clean, avoid repeated signals, and keep you focused only on real market direction.
✨ What’s New in v1.3
Minor upgrades mostly visual
Added Blue fill between MA lines
clearer labels
📌 Core Features
Trend flip arrows (no spam, 1 signal per turn)
Continuous background zones (gap-free trend shading)
Adaptive Baseline + ATR structure channel
RSI + MACD momentum filter (suppresses weak signals)
Trend Status Panel (UP, DOWN, NEUTRAL)
🔍 Quick Guide
BUY setup = green arrow + green background
SELL setup = red arrow + red background
Stay in the move while color doesn’t change
ATR channel helps avoid chasing overextended candles
🆚 LITE vs PRO
Feature LITE PRO
--------------------- -------- ------------------------------
Trend shading + arrows ✔ ✔ + confirmations
Neutral trend state ✔ ✔ enhanced
Alerts ✖ ✔ full suite
Reversal Zones ✖ ✔ predictive boxes
HTF Filter ✖ ✔ smarter trend bias
Included strategies ✖ ✔ + PDF training
========================================================
🔓 Upgrade to PRO
Reversal Zones • Alerts • HTF Filter • Trend Continuation Strategy
👉 fxsharerobots.com/impulse-trend-pro/
📈 Works on Forex, Stocks, Crypto, Indices, Metals
⌚ Scalping • Intraday • Swing • Long-term
==========================================================
⚠️ LITE - Educational tool. Backtest before trading live.
Visit us for Full Trading Tools Collection here:
fxsharerobots.com/downloads/
Happy trading! — FxShareRobots Team

PST Super Simple System v2.5+PinkSlips Trading was built to give traders real structure, real tools, and real support — without the confusion or false promises you find everywhere else. Everything we provide is focused on helping you trade with clarity and confidence.
Professional-Grade Indicators
We develop custom TradingView indicators designed to simplify your decision-making. Clean, reliable, and built to support consistent trading.
Daily Live Trading Sessions
Members can watch the market with us in real time. We walk through bias, key levels, trade execution, and risk management so you can learn the process step-by-step.
Personal Guidance and Trade Planning
Whether you need help building a strategy, fixing your discipline, or understanding your data, we offer direct support and tailored plans to help you improve faster.
A Focused, Results-Driven Community
PinkSlips Trading is built for traders who want to get better — not for hype. You’ll be surrounded by people who take trading seriously and are committed to long-term growth.

PVV Trend Line (Lower Study)Doing my best to create something is uses rate of change on the Price, volume, and volatility. I know it's not perfect, but it does it's job for me.
It's useful use it, if it's not then don't.
You will need to change settings for the time frame you want to trade on.

S.T. TREND INDICATORIt is TREND indicator. it has 8 supertrends which can be used for different higher time frame & with different atr & multiplier.which will give better idea of varius trend like long ,medium,short & immediate trend.it also has daily & weekly vwap. and two sma with adjustable length & timeframe. source used for calculation of supertrends is 1min HA candles.yyou can use it onnormal japnees candle also.
📊 Volume Tension & Net Imbalance📊 Volume Tension & Net Imbalance (With Table + MultiLang + Alerts)
//
This indicator measures bullish vs. bearish pressure using volume-based tension and net imbalance.
It identifies accumulation zones, displays real-time market strength, trend direction, and triggers alerts on buildup entries.
Fully customizable table size, colors, and bilingual support (English/Russian).

Market Regime & Bias Assistant [Prototype v1.1]
Market Regime & Bias Assistant
### **Overview**
The **Market Regime & Bias Assistant** is an all-in-one trend filtration and trading system designed to keep traders on the right side of the market. Instead of relying on a single moving average, this indicator combines **ADX (Trend Strength)**, **Multi-Timeframe EMAs**, **RSI**, and **Volume Spread Analysis (VSA)** concepts to generate a quantitative "Confidence Score" for the current market bias.
It automatically adapts its settings based on your timeframe (Intraday vs. Swing) and provides clear visual cues via background shading, candle coloring, and a data panel.
---
### **Key Features**
* **Auto-Adaptive Modes:** Automatically switches between "Intraday" and "Swing" settings based on your timeframe.
* *Intraday:* Uses faster EMAs (Aggressive 9/30 or Conservative 20/50) and VWAP.
* *Swing:* Uses standard 20/50 EMAs with 200/800 long-term context moving averages.
* **Market Regime Detection:** Identifies if the market is in a **Trend (Bull/Bear)** or a **Range (Neutral)** using a combination of ADX thresholds and EMA alignment.
* **Confidence Scoring (0-100):** A proprietary algorithm that scores the quality of the trend based on RSI alignment, Volume confirmation, and Long-term EMA context.
* **Vector Volume Candles:** Color-coded candles to highlight institutional activity (High Volume) vs. Climactic Volume (Exhaustion).
* **Pullback Signals:** "L" and "S" markers indicating high-probability entries after a pullback into the EMA value zone.
* **Data Dashboard:** A bottom-right panel displaying the current Mode, Regime, Bias, and quantitative Confidence Score.
---
### **How to Read the Visuals**
#### **1. Background Colors (The Regime)**
* **Green Background:** Confirmed **Bullish Trend**. Only look for Longs.
* **Red Background:** Confirmed **Bearish Trend**. Only look for Shorts.
* **Gray Background:** **Neutral / Range**. The market is chopping or consolidating. Stand aside or trade strictly mean-reversion.
#### **2. Candle Colors (Vector Volume)**
* **Green/Red Borders:** Normal volume.
* **Blue / Fuchsia:** **High Volume (1.2x Average)**. Indicates institutional interest or a breakout.
* **Lime / Bright Red:** **Climactic Volume (1.8x Average)**. Indicates potential exhaustion or a stopping volume event.
#### **3. The EMAs**
* **Fast/Slow Lines:** Show the immediate trend direction.
* **Gray/White Lines:** The 200 and 800 EMAs. These act as major support/resistance levels and define the "Big Picture" bias.
* **Lime Line (Intraday Only):** The VWAP (Volume Weighted Average Price).
---
### **How to Use This Indicator**
**Step 1: Check the Regime**
Look at the background color and the Dashboard panel. Is the Trend Strength "Strong" or "Very Strong"?
* *Rule:* Do not take trend-following trades if the Regime is "Range/Neutral."
**Step 2: Check the Confidence**
The dashboard calculates a score from 0 to 100.
* **High Confidence (>67):** All systems go. Alignment of RSI, Volume, and Trend.
* **Medium Confidence (34-66):** Caution warranted. Usually implies divergence in RSI or low volume.
* **Low Confidence (<34):** The trend is weak or failing.
**Step 3: Wait for the Setup (The Arrows)**
The indicator looks for pullbacks into the "Value Zone" (the space between the Fast and Slow EMA).
* **Triangle Up (L):** Appears when price pulls back into the zone during a Bull trend, then bounces out with volume confirmation.
* **Triangle Down (S):** Appears when price rallies into the zone during a Bear trend, then rejects lower.
---
### **Settings & Customization**
* **Mode:** Default is "Auto," but you can force "Intraday" or "Swing" manually.
* **Intraday Style:** Choose between "Aggressive" (9 EMA / 30 EMA) for scalping or "Conservative" (20 EMA / 50 EMA) for day trading.
* **ADX Threshold:** Adjusts how strict the trend filter is (Default: 20).
* **Visual Toggles:** Turn off/on the Panel, Background shading, or Vector candles to clean up your chart.
### **Alerts**
This script comes with built-in alert conditions for:
1. **Bullish Regime Start**
2. **Bearish Regime Start**
3. **High-Confidence Setup Detected**

Trend Follow Line Point📌 Trend Follow Line Point
The Trend Follow Line Point indicator removes the confusing, repainting-based swing connections commonly found in traditional swing tools.
It maintains consistent swing-point calculation, keeps structural swing lines intact even when trend lines are broken, and integrates market structure + trend + volatility + volume into one intuitive, visual indicator.
This tool is designed for:
Trend Following
Swing Structure Analysis
Volatility-Based Entry & Exit
Market Strength Evaluation
📊 Component Explanation
🔹 1. Swing High / Swing Low Detection
Based on the user-defined sensitivity (swgLen):
A Swing High forms when the current high exceeds the previous swgLen highs.
A Swing Low forms when the current low falls below the previous swgLen lows.
🔹 2. Swing-Based Structure Lines
Connect Swing Highs → Structural visualization
Connect Swing Lows → Structural visualization
These lines reveal the underlying market structure without repainting or disappearing unexpectedly.
🔹 3. Dynamic ATR + Volume Weighting
ATR values combined with the volume ratio (vol / volMA) create a dynamic volatility channel that reflects real-time market pressure.
🔹 4. Enhanced SuperTrend Calculation
Uses ATR-based stability to produce more realistic and smoother trend lines, reducing noise and improving signal clarity.
🔹 5. Trend Color Mapping
Up Trend → User-selected color
Down Trend → User-selected color
Visual trend direction and strength can be identified immediately.
🧭 How to Use
When Swing Highs/Lows are detected, structure lines are automatically drawn between previous swings.
Use these lines to evaluate support/resistance breaks and overall structural direction.
Manage risk with volatility guidance:
Higher ATR (volume-weighted) → wider trend spacing → increased risk
Lower ATR → tighter spacing → reduced risk
This helps with position sizing, entry timing, and exit decisions.
+

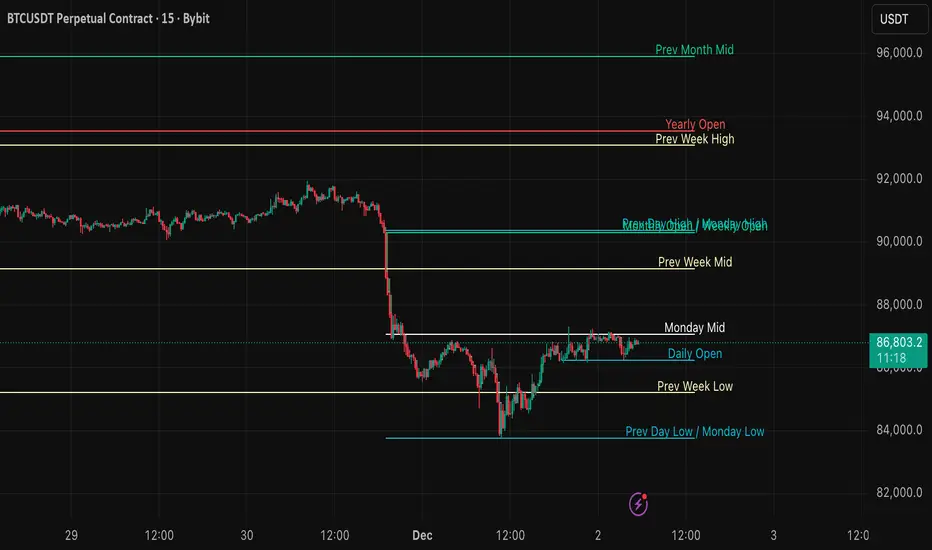
BTC – LEVR: Leverage Efficiency & Volume RatioLEVR: Leverage Efficiency & Volume Ratio
Observation-only. Data: IntoTheBlock.
Overview
The Leverage Efficiency & Volume Ratio (LEVR) is a market structure oscillator designed to detect "Paper Bubbles" and "Organic Bottoms" by separating speculative greed from network utility. While most indicators analyze price action, LEVR analyzes market fragility. It operates on the thesis that Sustainable Rallies are driven by Spot/Network Activity, while Fragile Rallies are driven by Derivatives Leverage.
Synergy
How it works with VERI
LEVR is designed to be the tactical counterpart to the fundamental VERI Indicator (Valuation & Entity Ratio Index).
Use VERI for Strategy: To identify Value. (Is Bitcoin cheap? Are Whales buying?)
Use LEVR for Risk: To identify Structure. (Is the current price move real, or is it a leverage bubble about to pop?)
The "Perfect Setup"
The strongest buy signals occur when VERI is in the Accumulation Zone (Whales buying) AND LEVR is in the Organic Zone (Leverage is flushed out) (as it was the case in the Dec 2022 Bear Market Bottom).
Why LEVR is Unique
Standard indicators often fail to contextualize Open Interest:
vs. Raw Open Interest: Raw OI always trends up over time as the market grows. LEVR solves this by normalizing OI against Active Addresses. This reveals when leverage is outpacing actual adoption.
vs. ELR (Estimated Leverage Ratio): Classic ELR divides Open Interest by Exchange Reserves. However, Exchange Reserves are notoriously difficult to track accurately. LEVR uses Active Addresses (Network Utility) as a cleaner, more reliable denominator for network health.
Methodology
The Mathematics: The indicator calculates a normalized Z-Score ratio between two IntoTheBlock datasets:
The Numerator (Greed): Perpetual Open Interest. The total dollar value of all open futures contracts. This represents the "Gambling" capital.
The Denominator (Utility): Active Addresses. The number of unique addresses transacting on-chain. This represents the "Real" user base.
The Formula : LEVR = Z-Score ( Perpetual Open Interest / Active Addresses )
How to Interpret the Visuals
The line color changes dynamically to reflect the current risk regime:
🟥 Speculative Premium (Red Line > 2.0) :
Signal: "Leverage Bubble."
Context: Open Interest is rising significantly faster than User Growth. The rally is fueled by debt.
Risk: High probability of a "Long Squeeze" or liquidation cascade.
🟦 Organic Base (Blue Line < -1.5) :
Signal: "Spot Driven Market."
Context: Speculators have been flushed out, but active network usage remains high. The line turns Blue to signal a healthy opportunity zone.
Risk: Low. Historically marks robust bottoms where hands are strong.
🟧 Neutral (Orange Line) :
The market is in a transition phase between organic growth and speculation.
Settings & Inputs
Users can customize the sensitivity of the Z-Score to fit their trading style (in brackets their current standard value):
Lookback Period (365) : The rolling window used to establish the "Baseline." A 365-day window captures the yearly trend.
Signal Smoothing (7) : A short moving average to reduce daily data noise.
Bubble Zone Top/Bottom (3.0 / 2.0) : The thresholds for the Red Zone. Raising the "Top" value will only show the most extreme, generational leverage bubbles.
Organic Zone Top/Bottom (-1.5 / -2.5) : The thresholds for the Green Zone. Lowering these values requires a deeper "flush" to trigger a signal.
Optimization
This indicator is mathematically optimized for the Daily (1D) timeframe. Using it on lower timeframes may result in noise due to the daily resolution of on-chain data.
Important Note on Historical Data
Please be aware that aggregated global Perpetual Open Interest data only becomes reliable and widely available starting around 2020-2021.
Pre-2021: The indicator will show a flat line or empty values. This is not a bug; it reflects the lack of historical derivatives market data for that period.
2021-Present: The indicator functions fully as intended.
Credits
Concept inspired by the "Estimated Leverage Ratio" (ELR) popularised by CryptoQuant and analysts like Willy Woo. LEVR adapts this concept for TradingView by substituting Exchange Reserves with Network Activity for better reliability.
Disclaimer
This tool is for research purposes only. It visualizes market structure data and does not constitute financial advice.
Tags
bitcoin, btc, open interest, leverage, on-chain, intotheblock, risk, derivatives, levr, veri

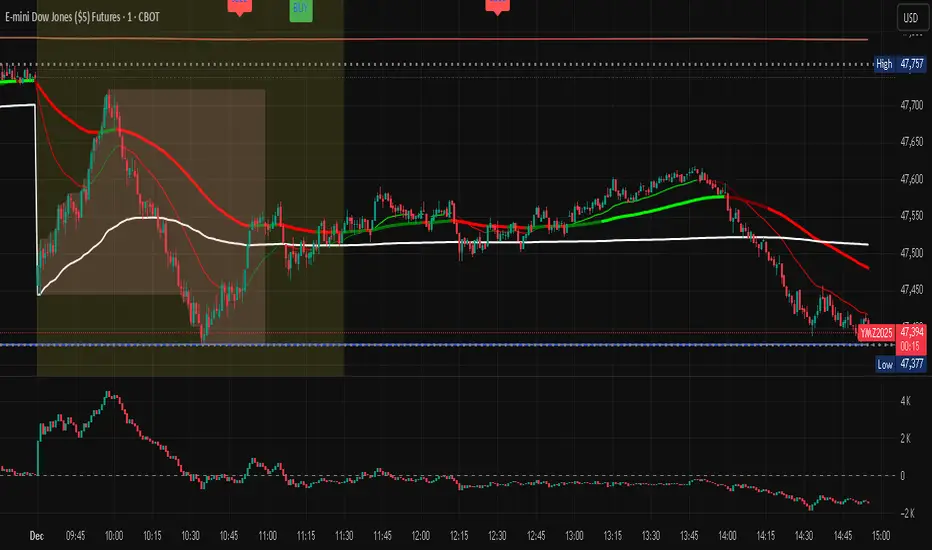
Trend Flip Exhaustion SignalsThis Pine Script is designed to generate buy and short trading signals based on a combination of technical indicators. It calculates fast and slow EMAs, RSI, a linear regression channel, and a simplified TTM squeeze histogram to measure momentum.
- Short signals trigger when price is above both EMAs, near the upper regression channel, momentum is weakening, volume is fading, and RSI is overbought.
- Buy signals trigger when price is below both EMAs, near the lower regression channel, momentum is strengthening, volume is surging, and RSI is oversold.
- Signals are displayed as labels anchored to price bars (with optional plotshape arrows for backup).
- The script also plots the EMAs and regression channel for visual context.
In short - it’s a trend‑following entry tool that highlights potential exhaustion points for shorts and potential reversals for buys, with clear on‑chart markers to guide decision‑making.

Fat Tony's Volume TrackerCreates a small blue box in the lower left hand portion of a chart to show recent volume on the current candle, and last two candles before that.

OBV + WaveTrend Volume Scalper [GratefulFutures]This script is a combination script of three different strategies that provides buy and sell signals based on the change of volume with momentum confirmations.
Sources used:
This script relies on the outstanding scripts of the great script writer LazyBear: LazyBear
The following scripts were used in this publication:
1. A modified "On-Balance Volume Oscillator" modified from LazyBear's original script:
2. Wavetrend Oscillator with crosses, Author: LazyBear
3. Squeeze Momentum Oscillator, Author: LazyBear
This script functions based on the following criteria being true:
1. On balance volume oscillator turning from negative to positive (buy) or positive to negative (sell)
2. Squeeze Momentum value is increasing (buy) or decreasing (sell)
3. Wavetrend 1 (wt1) is greater than wavetrend 2 (wt2) (buy)/ Wavetrend 1 (wt1) is less than wavetrend 2 (wt2) (sell)
By combining these factors the indicator is able to signal exactly when net buying turns to net selling (OBV) and when this change is most advantageous to continue based on the momentum and price action of the underlying asset (SQMOMO and Wavetrend).
This allows you to pair volume and price action for a powerful tool to identify where price will reverse or continue providing exceptional entries for short term trades, especially when combined with other aspects such as support and resistance, or volume profile.
How to use:
Simply adjust the settings to your preference and read the given signals as generated.
Settings
There are multiple ways to tune the signals generated. It is set standard for my preferred use on a 1 minute chart.
OBV Oscillator Settings
The first 4 dropdowns in the Inputs section tune the On Balance Volume Oscillator (OBVO) portion of the indicator. You can choose if you want it to calculate based on close, open, high, low, or other value.
The most impactful in the entire settings is going to be the length and smoothing of the OBVO EMA. Making this number lower increasing the sensitivity to changes in volume, making the signals come quicker but is more susceptible to quick fluctuations. A value of between (5-20) is reasonable for the OBVO EMA length. There is a separate smoothing factor titled OBV Smoothing Length and below that, OBV Smoothing Type , a value of (2) is standard with "SMA" for smoothing type with a value of between 2-10 being reasonable. You may also play with these values to see what you like for your trading style.
Wavetrend Settings
The next 3 options are to modify the wavetrend portion of the indicator. I do not modify these from standard, and feel that they work appropriately on all time frames at the following values: n1 length (10), n2 length (20), Wavetrend Signal SMA length (4)
Squeeze Momentum Settings
The following 5 options through the end modify the Squeeze momentum portion of the indicator. The only one that modifies the signals generated is the KC Length , Making this number lower increasing the sensitivity to changes in price action, making the signals come quicker but is more susceptible to quick fluctuations. A value of between (18-25) is reasonable for KC Length .
Style Setting
You may select if you want to see the buy and sell signals. The following 5 options Raw OBV Osc through Squeeze Momentum allow you to see where each specific requirement was met, posted as a vertical line, but for live use it is recommended to turn all of these vertical lines off and only use the buy and sell signals.
Time Frames:
While this script is most effective on shorter time frames (1 minute for scalping and daytrading) it is also viable to use it on longer timeframes, due to the nature of its components being independent of time frame.
Examples of use - (Green and red vertical lines are for visualization purpose and are not part of the script)
SPY 1 Minute (Factory Settings):
SPX 15 minutes (Factory Settings):
Considerations
This script is meant primarily for short term trading, trades on the basis of seconds to minutes primarily. While they can be a good indication of volume lining up with momentum, it is always wise to use them in combination with other factors such as support, resistance, market structure, volume levels, or the many other techniques out there...
As Always... Happy Trading.
-Not_A_Mad_Scientist (GreatfulFutures Trade University)

67 2.0Major Market Trading Hours
New York Stock Exchange (NYSE)
Open: 9:30 AM (ET)
Close: 4:00 PM (ET)
Pre-Market: 4:00 AM – 9:30 AM (ET)
After Hours: 4:00 PM – 8:00 PM (ET)
Nasdaq
Open: 9:30 AM (ET)
Close: 4:00 PM (ET)
Pre-Market: 4:00 AM – 9:30 AM (ET)
After Hours: 4:00 PM – 8:00 PM (ET)
London Stock Exchange (LSE)
Open: 8:00 AM (GMT)
Close: 4:30 PM (GMT)
Tokyo Stock Exchange (TSE)
Open: 9:00 AM (JST)
Lunch Break: 11:30 AM – 12:30 PM (JST)
Close: 3:00 PM (JST)
Hong Kong Stock Exchange (HKEX)
Open: 9:30 AM (HKT)
Lunch Break: 12:00 PM – 1:00 PM (HKT)
Close: 4:00 PM (HKT)

new alertable spacemanhope these alerts work. open to fixes
slight modification to Key Levels SpacemanBTC IDWM script
credit: spacemanbtc
VB Finviz-style MTF Screener📊 VB Multi-Timeframe Stock Screener (Daily + 4H + 1H)
A structured, high-signal stock screener that blends Daily fundamentals, 4H trend confirmation, and 1H entry timing to surface strong trading opportunities with institutional discipline.
🟦 1. Daily Screener — Core Stock Selection
All fundamental and structural filters run strictly on Daily data for maximum stability and signal quality.
Daily filters include:
📈 Average Volume & Relative Volume
💲 Minimum Price Threshold
📊 Beta vs SPY
🏢 Market Cap (Billions)
🔥 ATR Liquidity Filter
🧱 Float Requirements
📘 Price Above Daily SMA50
🚀 Minimum Gap-Up Condition
This layer acts like a Finviz-style engine, identifying stocks worth trading before momentum or timing is considered.
🟩 2. 4H Trend Confirmation — Momentum Check
Once a stock passes the Daily screen, the 4-hour timeframe validates trend strength:
🔼 Price above 4H MA
📈 MA pointing upward
This removes structurally good stocks that are not in a healthy trend.
🟧 3. 1H Entry Alignment — Timing Layer
The Hourly timeframe refines near-term timing:
🔼 Price above 1H MA
📉 Short-term upward movement detected
This step ensures the stock isn’t just good on paper—it’s moving now.
🧪 MTF Debug Table (Your Transparency Engine)
A live diagnostic table shows:
All Daily values
All 4H checks
All 1H checks
Exact PASS/FAIL per condition
Perfect for tuning thresholds or understanding why a ticker qualifies or fails.
🎯 Who This Screener Is For
Swing traders
Momentum/trend traders
Systematic and rules-based traders
Traders who want clean, multi-timeframe alignment
By combining Daily fundamentals, 4H trend structure, and 1H momentum, this screener filters the market down to the stocks that are strong, aligned, and ready.

Watchlist Volume Surge AlertOverview
This indicator is designed for traders who monitor large watchlists and need instant notification when a stock is experiencing unusual volume activity relative to its recent history.
Standard volume indicators often include the current day's volume in the average calculation. This causes a problem: if a stock is having a massive breakout, that high volume pulls the average up immediately, making it harder to hit the "relative" threshold.
This script solves that by comparing the current volume against the Simple Moving Average (SMA) of the previous n bars. This ensures a clean baseline and accurate alerts, even during massive volatility.
Key Features
Smart RVOL Calculation: Calculates Relative Volume (RVOL) based on the previous 30 bars (adjustable), ensuring the current breakout doesn't skew the average.
Visual Clarity:
Bars: Normal volume is transparent. Surge volume turns bright Teal (Bullish Close) or Red (Bearish Close).
Background: The indicator panel background highlights when a surge is active, making it impossible to miss when scanning visually.
Data Window: Displays the exact RVOL ratio (e.g., 2.11) in the Data Window for verification.
Watchlist Alert Optimized: Specifically designed to work with TradingView's "Any alert function call" or standard condition alerts across multiple tickers.
How to Set Up Alerts
This script is perfect for setting a single alert on a large watchlist to catch breakouts as they happen.
Add the indicator to your chart.
Go to the Alerts menu and create a new alert.
Condition: Select Watchlist Volume Surge Alert.
Trigger: Select "Once Per Bar".
Note: Using "Once Per Bar" ensures you are notified the moment the volume crosses the threshold during the trading day, rather than waiting for the market to close.
Message: The script includes a dynamic message: "Volume Surge! {{ticker}} volume is {{plot("RVOL Ratio")}}x the average."
Settings
Average Length (Days): The lookback period for the volume average (Default: 30).
Alert Threshold (x Average): The multiple required to trigger an alert (Default: 1.5x).
Note: This works better when you have a watchlist with similar volatility and/or market cap

Daily EMA TrendThis show whether price is above or below the set DAILY EMAs that you set. Default is 200, 100, 50 & 20.

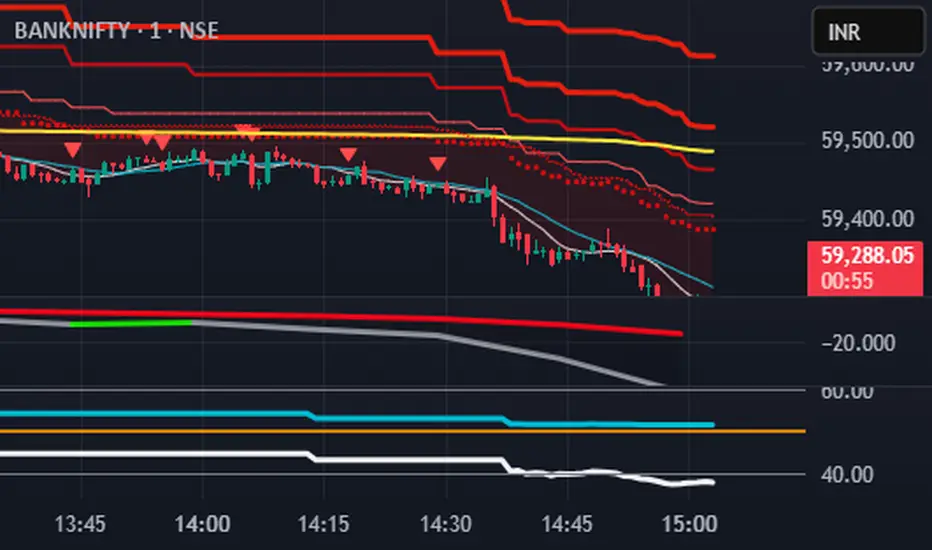
Trendline Breaks + Supertrend [Delta BTC-P]Trendline Breaks + Supertrend in same direct Best on 5 min

Meet The Neural Brain: The "Glass Box" AnalystIt observes. It thinks. It speaks.
Most indicators are "Black Boxes"—they give you a signal, but they never tell you why. If you don't know the why, you can't trust the trade.
The Neural Brain is different. It is a "Glass Box" AI Market Analyst that lives on your chart. It breaks down its decision-making process into plain English, so you never have to guess.
How It "Thinks" (The 3-Layer Cortex)
It processes market data through three human-like layers:
1. PERCEPTION (The Eyes)
Forensic Analysis: It scans price action for "clean" vs. "noisy" movement.
Spread History: It tracks momentum expansion in real-time.
2. COGNITION (The Mind)
Mode Selection: It mathematically decides whether to TRACK a trend or REPEL choppy conditions.
Conviction Monitor: It tells you if its confidence in the trade is growing or fading.
3. NARRATIVE (The Voice)
The Killer Feature: It synthesizes all data into a final strategic summary displayed right on your screen:
"STRONG TREND + NOISY ACTION = HOLDING (Ignoring Noise)"
"Is this Real AI?"
Transparency is our priority. This is not "Generative AI" (like ChatGPT) that hallucinates or scours the internet. This is Expert Systems Machine Learning.
The Math: We utilize the Rational Quadratic Kernel, a sophisticated technique used in Gaussian Process Regression. This allows the code to "learn" the structure of volatility without being explicitly hard-coded. It adapts to the market curve.
The Logic: It mimics the thought process of a professional trader running a complex Decision Tree:
Human Thought: "The trend is up, but it's choppy, so I should wait."
Neural Logic: IF (Trend > 0) AND (Efficiency < 0.3) THEN Strategy = "HOLDING"
The Result: A Synthetic Cortex that adapts to the situation just like a pro trader would, giving you the clarity to execute with zero hesitation.

AlphaTrend++ offset labelsAlphaTrend++
Overview
The AlphaTrend++ is an advanced Pine Script indicator designed to help traders identify buy and sell opportunities in trending and volatile markets. Building on trend-following principles, it uses a modified Average True Range (ATR) calculation combined with volume or momentum data to plot a dynamic trend line. The indicator overlays on the price chart, displaying a colored trend line, a filled trend zone, buy/sell signals, and optional stop-loss tick labels, making it ideal for day trading or swing trading, particularly in markets like futures (e.g., MES).
What It Does
This indicator generates buy and sell signals based on the direction and momentum of a custom trend line, filtered by optional time restrictions and signal frequency logic. The trend line adapts to price action and volatility, with a filled zone highlighting trend strength. Buy/sell signals are plotted as labels, and stop-loss distances are displayed in ticks (customizable for instruments like MES). The indicator supports standard chart types for realistic signal generation.
How It Works
The indicator employs the following components:
Trend Line Calculation: A dynamic trend line is calculated using ATR adjusted by a user-defined multiplier, combined with either Money Flow Index (MFI) or Relative Strength Index (RSI) depending on volume availability. The line tracks price movements, adjusting upward or downward based on trend direction and volatility.
Trend Zone: The area between the current trend line and its value two bars prior is filled, colored green for bullish trends (upward movement) or red for bearish trends (downward movement), providing a visual cue of trend strength.
Signal Generation: Buy signals occur when the trend line crosses above its value two bars ago, and sell signals occur when it crosses below, with optional filtering to reduce signal noise (based on bar timing logic). Signals can be restricted to a 9:00–15:00 UTC trading window.
Stop-Loss Ticks: For each signal, the indicator calculates the distance to the trend line (acting as a stop-loss level) in ticks, using a user-defined tick size (default 0.25 for MES). These are displayed as labels below/above the signal.
Time Filter: An optional filter limits signals to 9:00–15:00 UTC, aligning with active trading sessions like the US market open.
The indicator ensures compatibility with standard chart types (e.g., candlestick or bar charts) to avoid unrealistic results associated with non-standard types like Heikin Ashi or Renko.
How to Use It
Add to Chart: Apply the indicator to a candlestick or bar chart on TradingView.
Configure Settings:
Multiplier: Adjust the ATR multiplier (default 1.0) to control trend line sensitivity. Higher values widen the stop-loss distance.
Common Period: Set the ATR and MFI/RSI period (default 14) for trend calculations.
No Volume Data: Enable if volume data is unavailable (e.g., for certain forex pairs), switching from MFI to RSI.
Tick Size: Set the tick size for stop-loss calculations (default 0.25 for MES futures).
Show Buy/Sell Signals: Toggle signal labels (default enabled).
Show Stop Loss Ticks: Toggle stop-loss tick labels (default enabled).
Use Time Filter: Restrict signals to 9:00–15:00 UTC (default disabled).
Use Filtered Signals: Enable to reduce signal frequency using bar timing logic (default enabled).
Interpret Signals:
Buy Signal: A blue “BUY” label below the bar indicates a potential long entry (trend line crossover, passing filters).
Sell Signal: A red “SELL” label above the bar indicates a potential short entry (trend line crossunder, passing filters).
Trend Zone: Green fill suggests bullish momentum; red fill suggests bearish momentum.
Stop-Loss Ticks: Gray labels show the stop-loss distance in ticks, helping with risk management.
Monitor Context: Use the trend line and filled zone to confirm the market’s direction before acting on signals.
Unique Features
Adaptive Trend Line: Combines ATR with MFI or RSI to create a responsive trend line that adjusts to volatility and market conditions.
Tick-Based Stop-Loss: Displays stop-loss distances in ticks, customizable for specific instruments, aiding precise risk management.
Signal Filtering: Optional bar timing logic reduces false signals, improving reliability in choppy markets.
Trend Zone Visualization: The filled zone between trend line values enhances trend clarity, making it easier to assess momentum.
Time-Restricted Trading: Optional 9:00–15:00 UTC filter aligns signals with high-liquidity sessions.
Notes
Use on standard candlestick or bar charts to ensure accurate signals.
Test the indicator on a demo account to optimize settings for your market and timeframe.
Combine with other analysis (e.g., support/resistance, volume spikes) for better decision-making.
The indicator is not a standalone system; use it as part of a broader trading strategy.
Limitations
Signals may lag in highly volatile or low-liquidity markets due to ATR-based calculations.
The 9:00–15:00 UTC time filter may not suit all markets; disable it for 24-hour assets like forex or crypto.
Stop-loss tick calculations assume consistent tick sizes; verify compatibility with your instrument.
This indicator is designed for traders seeking a robust, trend-following tool with customizable risk management and signal filtering, optimized for active trading sessions.
This update enhances label customization, clarity, and signal usability while preserving all existing AlphaTrend++ logic. The goal is to improve readability during live trading and allow traders to personalize the visual footprint of entries and stop-loss levels.
Improvements
• Cleaner Label Placement
Labels now maintain consistent spacing from the candle, regardless of volatility or ATR expansion.
• Enhanced Visual Structure
BUY/SELL signals remain bold and clear, while SL ticks use a more compact and optional sizing scheme.
• Better User Control
New UI inputs:
Entry Label Size
SL Label Size
SL Label Offset (Ticks)nces.

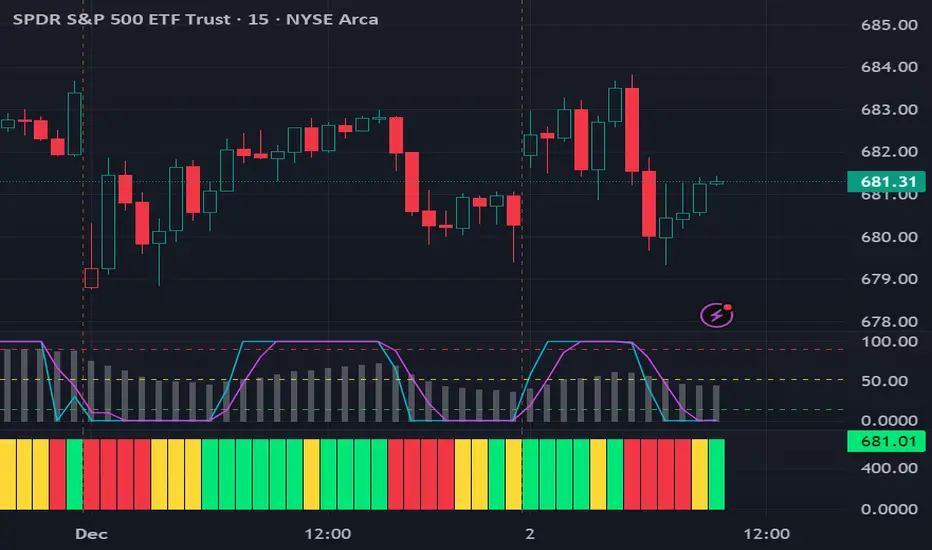
Volume Pressure OscillatorThe Volume Pressure Oscillator (VPO) is a momentum-based indicator that measures the directional pressure of cumulative volume delta (CVD) combined with price efficiency. It oscillates between 0 and 100, with readings above 50 indicating net buying pressure and readings below 50 indicating net selling pressure.
The indicator is designed to identify the strength and sustainability of volume-driven trends while remaining responsive during consolidation periods.
How the Indicator Works
The VPO analyzes volume flow by examining price action at lower timeframes to build a Cumulative Volume Delta (CVD). For each chart bar, the indicator looks at intrabar price movements to classify volume as either buying volume or selling volume. These classifications are accumulated into a running total that tracks net directional volume.
The indicator then measures the momentum of this CVD over both short-term and longer-term periods, providing responsiveness to recent changes while maintaining awareness of the broader trend. These momentum readings are normalized using percentile ranking, which creates a stable 0-100 scale that works consistently across different instruments and market conditions.
A key feature is the extreme zone persistence mechanism. When the indicator enters extreme zones (above 80 or below 20), it maintains elevated readings as long as volume pressure continues in the same direction. This allows the VPO to stay in extreme zones during strong trends rather than quickly reverting to neutral, making it useful for identifying sustained volume pressure rather than just temporary spikes.
What Makes This Indicator Different
While many indicators measure volume or volume delta, the VPO specifically measures how aggressively CVD is currently changing and whether that pressure is being sustained. It's the difference between knowing "more volume has accumulated on the buy side" versus "buying pressure is intensifying right now and shows signs of continuation."
1. Focus on CVD Momentum, Not CVD Levels
Most CVD indicators display the cumulative volume delta as a line that trends up or down indefinitely. The VPO is fundamentally different - it measures the slope of CVD rather than the absolute level. This transforms CVD from an unbounded cumulative metric into a bounded 0-100 oscillator that shows the intensity and direction of current volume pressure, not just the historical accumulation.
2. Designed to Stay in Extremes During Trends
Unlike traditional oscillators that treat extreme readings (above 80 or below 20) as overbought/oversold reversal signals, the VPO is engineered to oscillate within extreme zones during strong trends. When sustained buying or selling pressure exists, the indicator remains elevated (e.g., 80-95 or 5-20) rather than quickly reverting to neutral. This makes it useful for trend continuation identification rather than exclusively for reversal trading.
3. Percentile-Based Normalization
The VPO uses percentile ranking over a lookback window, which provides consistent behavior across different instruments, timeframes, and volatility regimes without constant recalibration.
4. Dual-Timeframe Momentum Synthesis
The indicator simultaneously considers short-term CVD momentum (responsive to recent changes) and longer-term CVD momentum (tracking trend direction), weighted and combined with a slow-moving trend bias. This multi-timeframe approach helps it stay responsive in ranging markets while maintaining context during trends.
How to Use the Indicator
Understanding the Zones:
80-100 (Strong Buying Pressure): CVD momentum is strongly positive. In trending markets, the indicator oscillates within this zone rather than immediately reverting to neutral. This suggests sustained accumulation and trend continuation probability.
60-80 (Moderate Buying): Positive volume pressure but not extreme. Suitable for identifying pullback entry opportunities within uptrends.
40-60 (Neutral Zone): Volume pressure is balanced or unclear. No strong directional edge from volume. Often seen during consolidation or trend transitions.
20-40 (Moderate Selling): Negative volume pressure developing. May indicate distribution or downtrend continuation setups.
0-20 (Strong Selling Pressure): CVD momentum is strongly negative. During downtrends, sustained readings in this zone suggest continued distribution and downside follow-through probability.
Practical Applications:
Trend Confirmation: When price makes new highs/lows, check if VPO confirms with similarly elevated readings. Divergences (price making new highs while VPO fails to reach prior highs) may indicate weakening momentum.
Range Trading: During consolidation, the VPO typically oscillates between 30-70. Readings toward the low end of the range (30-40) may present accumulation opportunities, while readings at the high end (60-70) may indicate distribution zones.
Extreme Persistence: If VPO reaches 90+ or drops below 10, this indicates exceptional volume pressure. Rather than fading these extremes immediately, monitor whether the indicator stays elevated. Sustained extreme readings suggest strong trend continuation potential.
Context with Price Action: The VPO is most effective when combined with price action or other orderflow indicators. Use the indicator to gauge whether volume is confirming or contradicting.
What the Indicator Does NOT Do:
It does not provide specific entry or exit signals
It does not predict future price direction
It does not guarantee profitable trades
It should not be used as a standalone trading system
Settings Explanation
Momentum Period (Default: 14)
This parameter controls the lookback period for CVD rate-of-change calculations.
Lower values (5-10): Make the indicator more responsive to recent volume changes. Useful for shorter-term trading and more active oscillation. May produce more whipsaws in choppy markets.
Default value (14): Provides balanced responsiveness while filtering out most noise. Suitable for swing trading and daily timeframe analysis.
Higher values (20-50): Create smoother readings and focus on longer-term volume trends. Better for position trading and reducing false signals, but with slower reaction to genuine changes in volume pressure.
Important Notes:
This indicator requires intrabar data to function properly. On some instruments or timeframes where lower timeframe data is not available, the indicator may not display.
The indicator uses request.security_lower_tf() which has a limit of intrabars. On higher timeframes, this provides extensive history, but on very low timeframes (<1-minute charts), the indicator may only cover limited historical bars.
Volume data quality varies by exchange and instrument. The indicator's effectiveness depends on accurate volume reporting from the data feed.

Auto 5-Wave Fixed Channel + Wave 5 Top / Wave 2-ABC BottomAuto 5-Wave Fixed Channel + Wave 5 Top / Wave 2-ABC Bottom
by Ron999
1. What this indicator does
This tool automatically hunts for bullish 5-wave impulse structures and then:
Labels the waves: W1, W2, W3, W4, W5
Draws a fixed “acceleration” channel based on the wave structure
Projects a Wave-5 target zone using a 1.618 extension
Marks the Wave-2 level as an ABC correction target
Triggers optional alerts when:
A new Wave-5 top completes
An ABC bottom forms back near the Wave-2 low
It’s designed as a mechanical, rule-based approximation of Elliott 5-wave impulses – built for traders who like the idea of wave structure but want something objective and programmable.
2. How the wave logic works
The script continuously scans for pivot highs and lows using a user-defined Pivot Length.
It only keeps the last 5 alternating pivots (high → low → high → low → high).
When those last 5 pivots form this pattern:
Pivot 1 → High (W1)
Pivot 2 → Low (W2)
Pivot 3 → High (W3)
Pivot 4 → Low (W4)
Pivot 5 → High (W5)
…the indicator treats this as a bullish 5-wave impulse.
When such a structure is detected, it “locks in” the wave prices and bars and draws the channels and labels.
Note: Pivots are only confirmed after Pivot Length bars, so swings are slightly delayed by design (standard pivot logic).
3. Channels & levels
Once a valid bullish 5-wave structure is found, the script builds three key pieces:
a) Base Acceleration Channel (Blue)
Anchored from Wave-2 low toward Wave-3 high.
This forms a rising acceleration channel that represents the impulse leg.
The channel extends to the right, so you can see how price interacts with it after W3–W5.
b) Wave-5 Target Line (Red, dashed)
Uses the height from Wave-2 low to Wave-3 high.
Projects a 1.618 extension of that height above Wave-3.
This line acts as a potential Wave-5 exhaustion zone (take-profit / reversal watch area).
c) Wave-2 / ABC Bottom Level (Green, dotted)
Horizontal line drawn at the Wave-2 low.
This acts as a retest / corrective target for the ABC correction after the impulse completes.
When price later revisits this area (within a tolerance), the script can mark it as a potential ABC bottom.
4. Labels & signals
If labels are enabled:
W1, W2, W3, W4, W5 are plotted directly on their corresponding pivot bars.
When an ABC-style retest is detected near the Wave-2 level, an “ABC” label is printed at that low.
Wave-5 Top Event
Triggered when a new valid bullish 5-wave structure is completed.
The last pivot high in the pattern is flagged as Wave-5.
ABC Bottom Event
After a Wave-5 impulse, the script watches for new low pivots.
If a new low forms within ABC Bottom Proximity (%) of the Wave-2 price, it is treated as an ABC bottom near Wave-2 and marked on the chart.
5. Inputs & customization
Show Fixed Channels
Toggle all channel drawing on/off.
Label Waves
Toggle plotting of W1–W5 and ABC labels.
Alerts: Wave-5 Top & ABC Bottom
Master switch for enabling the script’s alert conditions.
Pivot Length
Controls how “swingy” the detection is.
Smaller values → more frequent, smaller waves
Larger values → fewer, larger structural waves
ABC Bottom Proximity (%)
Allowed percentage distance between the ABC low and the Wave-2 price.
Example: 5% means any ABC low within ±5% of Wave-2 is considered valid.
6. Alerts (how to use them)
The script exposes two alertcondition() events:
Wave-5 Top (Bullish Impulse)
Fires when a new 5-wave bullish structure completes.
Use this to watch for potential exhaustion tops or to tighten stops.
ABC Bottom near Wave-2 Low
Fires when an ABC-style correction prints a low near the Wave-2 level.
Use this to stalk potential end-of-correction entries in the direction of the original impulse.
On TradingView, add an alert to the script and choose the desired condition from the dropdown.
7. How to use it in your trading
This tool is best used as a structural context layer, not a standalone system:
Identify bullish impulsive trends when a Wave-5 structure completes.
Use the Wave-5 target line as a potential area for:
Scaling out
Watching for exhaustion / divergences / reversal patterns
Use the Wave-2/ABC level and ABC Bottom signal:
To look for end of correction entries back in the trend direction
To align with your own confluence (support/resistance, volume, RSI, etc.)
It works well on crypto, FX, indices, and stocks, especially on higher timeframes where structure is cleaner.
8. Limitations & notes
This is a mechanical approximation of Elliott 5-wave theory — it will not match every analyst’s discretionary count.
Pivots are confirmed after Pivot Length bars, so signals are not instant; they’re based on completed swings.
The indicator currently focuses on bullish impulses (upward 5-wave structures).
As always, this is not financial advice. Combine it with your own strategy, risk management, and confirmation tools.
Created & coded by: Ron999
Built for traders who want wave structure + fixed channels, without the subjective Elliott argument on every chart. files.catbox.moe
