LULU Triple bottom is in! Michael Burry doubles his position LULU is extremely unvalued at a sub 11 PE! Michael Burry doubled his position in addition to millions in call options purchased. A triple bottom is BULLISH 74-87 % of the time and we have held a triple bottom here. $248 is the target in coming weeks with overhead resistance at $181, $201, $224

Tesla Retests Key support Amid a New Lawsuit After Deadly CrashTesla (NASDAQ: NASDAQ:TSLA ) faces renewed scrutiny after a lawsuit was filed over a fatal January 2023 crash in Washington state. According to the complaint, the vehicle “rapidly accelerated” before striking a utility pole and bursting into flames, killing one passenger and severely injuring another. First responders reportedly struggled to access the victims due to the vehicle’s structure and fire behavior, raising questions about safety systems and emergency accessibility.
The lawsuit lands during a period of heightened attention on Tesla’s real-world AI features, including Autopilot and Full Self-Driving (FSD). While the filing does not explicitly blame autonomous systems, it adds pressure to Tesla’s regulatory and legal environment, which remains a critical investor risk factor heading into 2026.
Tesla’s Fundamentals Remain Strong
Despite the legal challenges, Tesla retains a massive market cap near $1.33 trillion and continues scaling its energy and robotics divisions. The company remains profitable, with a strong balance sheet and long-term margin expansion driven by software, AI, and autonomous capabilities. The Optimus humanoid robot program and 4680 battery ramp both strengthen Tesla’s position in the next industrial cycle.
Tesla’s broad lineup—from the Model 3 to the Semi and Cybertruck—supports global delivery growth, while its charging infrastructure partnerships increase ecosystem reach. Fundamentally, Tesla remains one of the strongest players in the EV and AI–mobility sectors.
Technical Outlook: Trendline Retest in Play
From a price-action perspective, Tesla trades around $391, pulling back toward a critical ascending trendline visible on the weekly chart. This trendline has guided Tesla’s recovery since April and remains the key level to watch.
Support:
• $390 trendline
• Major demand at $350
• Long-term support at $250
Resistance:
• $425
• $492 (2025 high)
A strong bounce at the trendline could send TSLA back toward $425 and eventually $492. However, a clean breakdown risks a deeper correction toward the $320 zone.

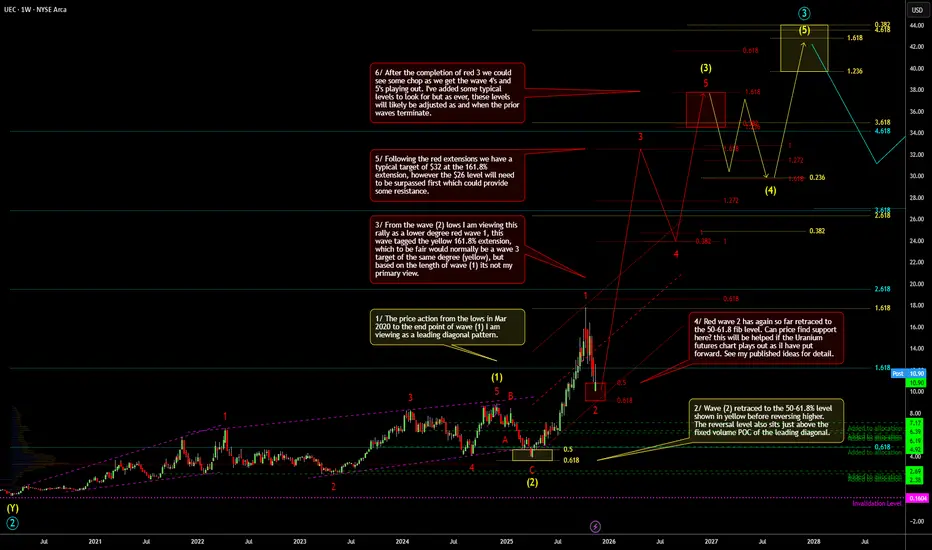
Uranium Energy Corp Weekly Outlook (Count 1)Here is my weekly outlook on AMEX:UEC .
UEC is one of my bigger holdings, I've added at various times as shown on the chart (see green dashed lines).
In this outlook i am viewing the price action from the lows in Mar 2020 to the end point of wave (1) as a leading diagonal pattern. After that we have seen wave (2) and another wave 1 and 2 in the red degree (red wave 2 may not be complete yet).
Are we next going to see a breakout in red wave 3? the case for this will be helped if the COMEX:UX2! Uranium Futures chart plays out as predicted along with LSE:YCA & TSX:U.UN ...see my linked charts
More comments on the chart!
Note: My analysis is more focused on price levels as opposed to wave duration, so bear that in mind if you see a particular price level at a certain date in the future and think i'm rigid on both price and time.
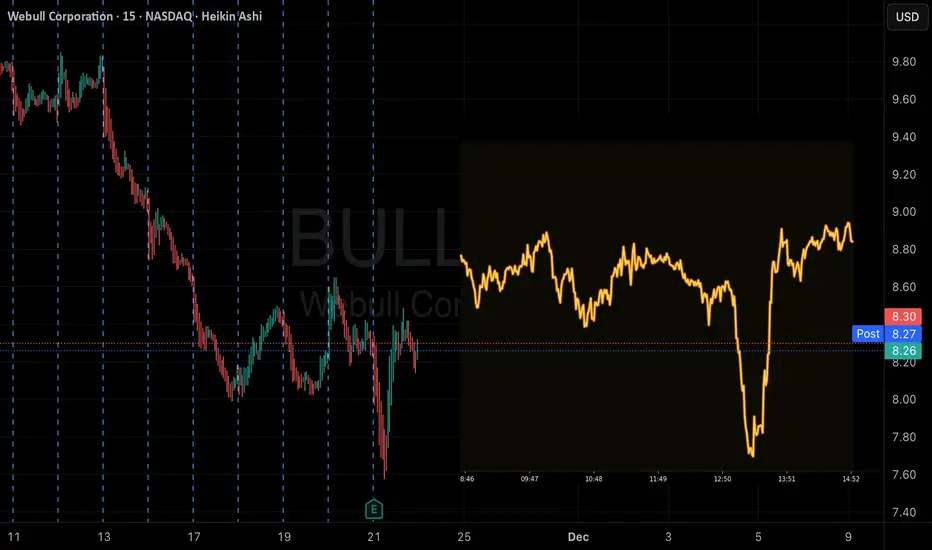
BULL SHORT Alert! QuantSignals V3 Predicts Slight DownsideBULL | QuantSignals Katy 1M Prediction (2025-11-21)
Current Price: $8.39
Predicted Close: $8.35 (-0.51%)
30-min Target: $8.24 (-1.79%)
Trend: Neutral
Confidence: 55%
Volatility: 93.2%
Trade Signal
Direction: SHORT (PUT)
Entry: $8.39
Target: $8.36
Stop Loss: $8.52
Expected Move: -0.51%
Summary: 1 trade signal generated from 1 successful analysis.
QuantSignals V3 APLD Bullish Alert! APLD | QuantSignals Katy 1M Prediction (2025-11-21)
Current Price: $19.25
Predicted Close: $20.43 (+6.12%)
30-min Target: $20.05 (+4.18%)
Trend: Bullish
Confidence: 75%
Volatility: 111.2%
Trade Signal
Direction: CALL
Entry: $19.25
Target: $20.19
Stop Loss: $18.96
Expected Move: +6.12%
Summary: 1 trade signal generated from 1 successful analysis.

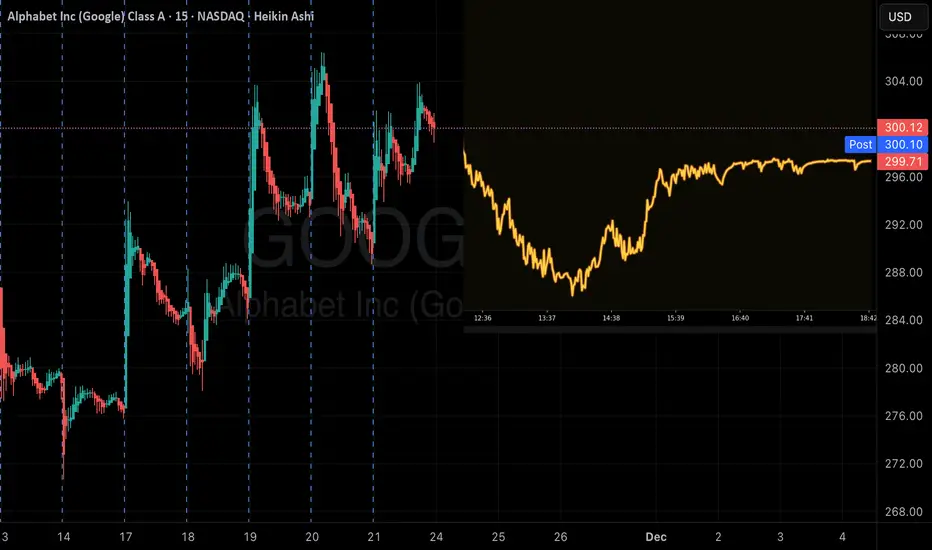
GOOGL Momentum Play: QuantSignals V3 Sees DownsideGOOGL | QuantSignals Katy 1M Prediction (2025-11-21)
Current Price: $295.97
Predicted Close: $293.39 (-0.87%)
30-min Target: $291.79 (-1.41%)
Trend: Bearish
Confidence: 65.8%
Volatility: 32.1%
Trade Signal
Direction: SHORT (PUT)
Entry: $295.97
Target: $293.90
Stop Loss: $300.41
Expected Move: -0.87%
Summary: 1 trade signal generated from 1 successful analysis.
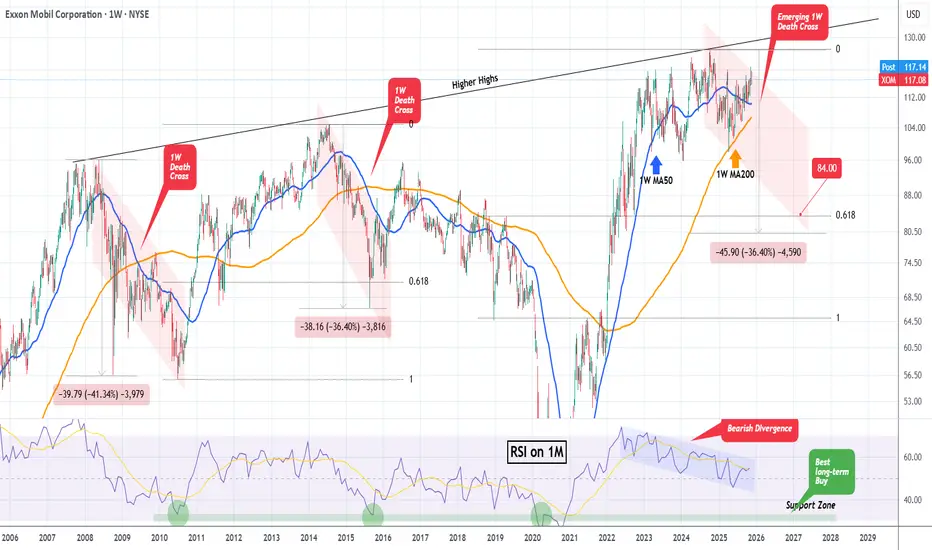
EXXON MOBIL on its 1st 1W Death Cross in 10 years!Exxon Mobil (XOM) is around a month before the formation of a 1W Death Cross for the first time in 10 years (last one in July 2015). This is a major technical development as the last two 1W Death Crosses resulted in massive sell-offs.
As you can see, both were formed long after a market rejection on the 18-year Higher Highs trend-line. The minimum correction (Bear Cycle) that was followed after such rejection was -36.40% (2014 - 2015), breaking just below its 0.618 Fibonacci retracement level.
As a result, we expect the stock to start declining aggressively ahead of the new 1W Death Cross and reach its 0.618 Fibonacci retracement level at $84.00 (still above the -36.40% projected decline).
If however the 1M RSI hits its 15-year Support Zone first, we expect a market bottom there and massive long-term bullish reversal, so we will buy at whatever level the price is at the time of Support contact.
---
** Please LIKE 👍, FOLLOW ✅, SHARE 🙌 and COMMENT ✍ if you enjoy this idea! Also share your ideas and charts in the comments section below! This is best way to keep it relevant, support us, keep the content here free and allow the idea to reach as many people as possible. **
---
💸💸💸💸💸💸
👇 👇 👇 👇 👇 👇
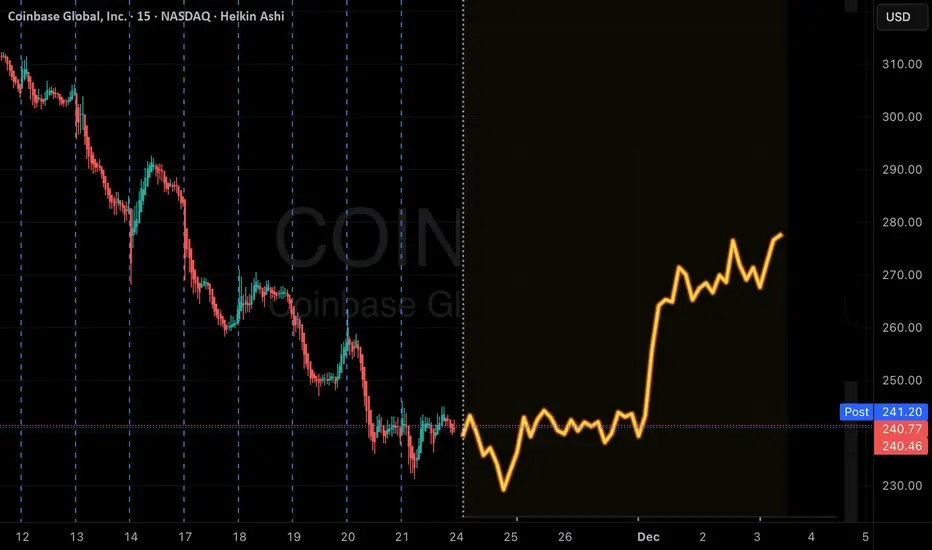
COIN Swing Alert! QuantSignals V3 Predicts Strong Put MoveCOIN | QuantSignals V3 Swing Trade Alert (2025-11-20)
Signal Overview
Direction: BUY PUTS (Short)
Confidence: 72% (Medium Conviction)
Horizon: 15 days → Expiry 2025-12-05
Strike: $240.00
Entry Price: $17.83
Target 1: $25.50 (+43%)
Target 2: $32.00 (+79%)
Stop Loss: $12.50 (-30%)
Position Size: 2.5% of portfolio
Market Context
1W Move: -7.35% | 2W Move: -13.26%
Swing Range: $246.88 – $287.92
Technicals: Bearish momentum, RSI oversold (21.2), MACD bearish, EMAs aligned bearish
News Sentiment: Mixed → Coinbase prediction market + regulatory tailwinds, but BTC < $90k weighs on crypto stocks
Trade Rationale
Katy AI shows neutral-to-bullish bias, but overwhelming bearish technical evidence supports PUT
Price at lower swing range → high probability for continuation or controlled bounce
Elevated VIX (23.66) → increased premiums, use moderate position size
Tight stop loss mitigates premium decay and oversold risk
⚠️ Risk Warning
Oversold conditions may cause sharp reversals → monitor closely
Moderate confidence → reduce position size
BTC correlation → track crypto market closely
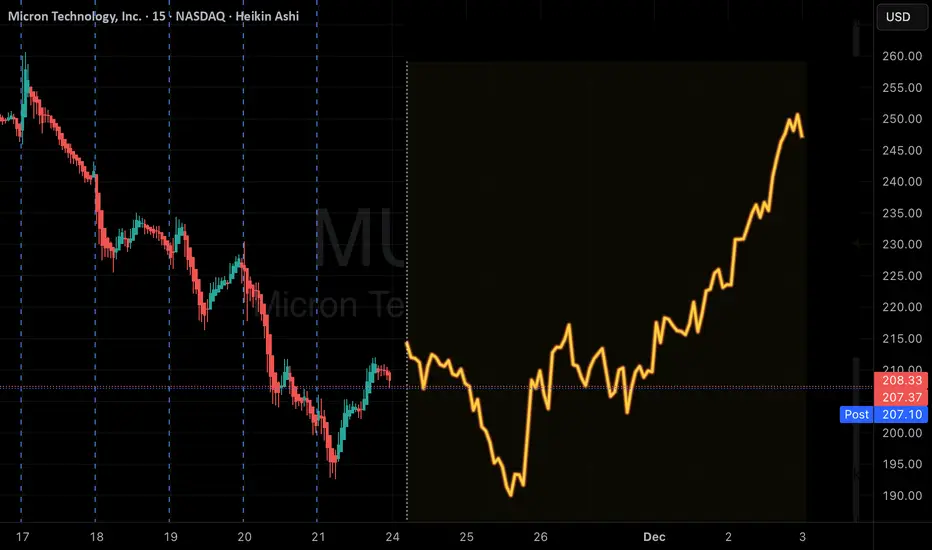
MU Trade Alert: Katy V3 Sees Late-Week UpsideMU | QuantSignals V3 Weekly Trade Alert (2025-11-21)
Signal Overview
Direction: BUY CALLS (LONG)
Confidence: 58% (Low Conviction)
Expiry: 2025-11-28 (7 days)
Strike: $212.50
Entry Price: $7.75
Target 1: $11.63 (+50%)
Target 2: $15.50 (+100%)
Stop Loss: $5.43 (-30%)
Position Size: 2% of portfolio
Market Context
Weekly Momentum: Bullish +3.64%
Flow Intel: Bearish PCR 2.31 → likely institutional hedging
Technical Support: $207.05 | Resistance: ~$230
Current Price Action: Strong late-week bullish trajectory, recovering from Nov 24 lows toward Katy target $224.11
Trade Rationale
Katy AI shows NEUTRAL overall confidence but a late-week bullish trend
PCR bearishness interpreted as hedging, not conviction, creating asymmetric opportunity
Friday gamma effects may accelerate price movement toward $224 target
Conservative sizing mitigates risk while capturing potential upside
⚠️ Risk Warning
Low Katy confidence → use small position size
Friday expiration → higher gamma risk
Mixed signals → consider scaling in cautiously
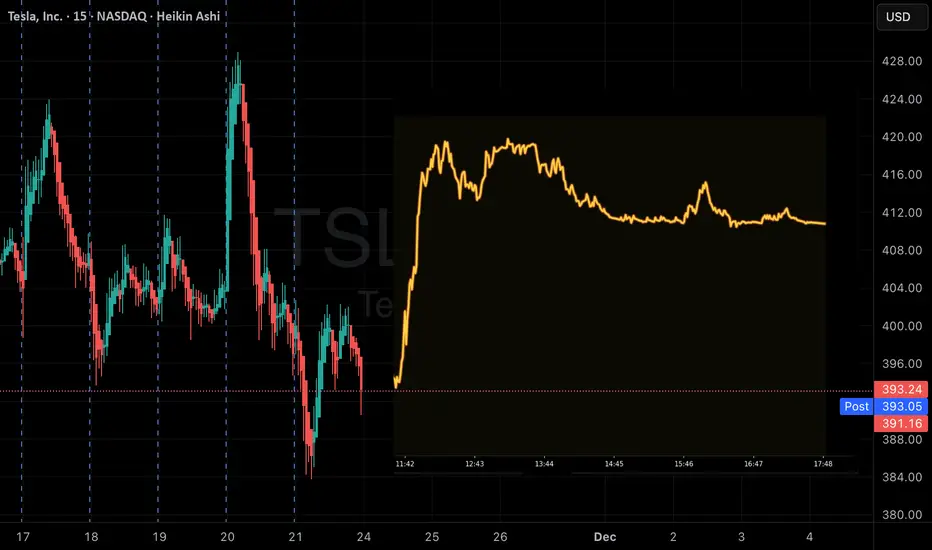
TSLA Momentum Play: QuantSignals V3 Sees Strong UpsideTSLA | QuantSignals Katy 1M Prediction (2025-11-21)
Current Price: $385.51
Predicted Close: $396.06 (+2.74%)
30-min Target: $393.15 (+1.98%)
Trend: Bullish
Confidence: 75%
Volatility: 27.4%
Trade Signal
Direction: CALL
Entry: $385.51
Target: $393.95
Stop Loss: $379.73
Expected Move: +2.74%
Summary: 1 trade signal generated from 1 successful analysis.
NVDA PUT Trade — QuantSignals Katy High-Conviction ShortNVDA | QuantSignals Katy 1M Prediction (2025-11-21)
Current Price: $178.81
Predicted Close: $173.03 (-3.23%)
30-min Target: $177.19 (-0.91%)
Trend: Bearish
Confidence: 75%
Volatility: 49.6%
Trade Signal
Direction: PUT
Entry: $178.81
Target: $174.18
Stop Loss: $181.49
Expected Move: -3.23%
Summary: 1 trade signal generated from 1 successful analysis.

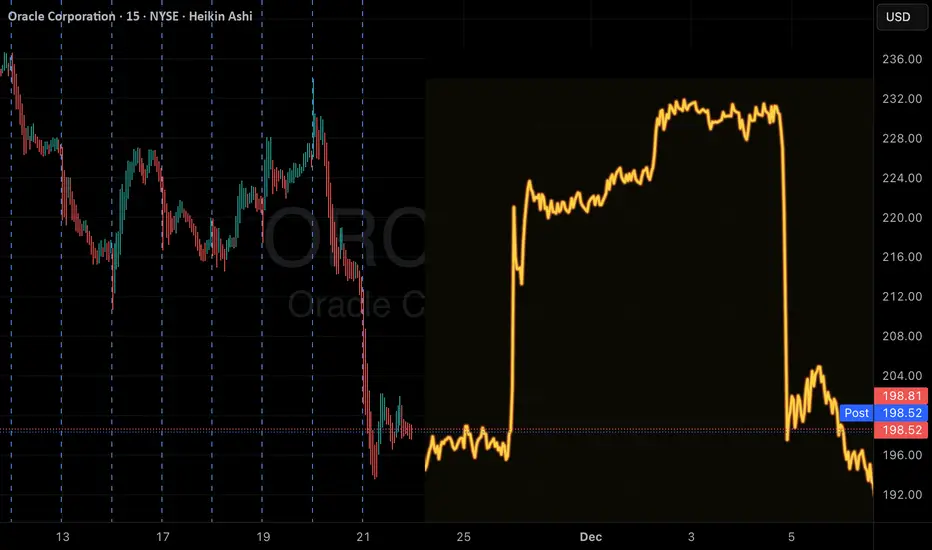
ORCL Momentum Play: Go Long with QuantSignals V3!ORCL — QuantSignals Katy (1M Prediction | 2025-11-21)
Current Price: $198.11
Predicted Close: $200.82 (+1.37%)
30-min Target: $197.64 (-0.23%)
Trend: Bullish
Confidence: 69.1%
Volatility: 113.3%
Trade Signal
• Direction: Long
• Entry: $198.11
• Target: $200.28
• Stop Loss: $195.14
• Expected Move: +1.37%
Patience pays off? Long METAI've been patient with META. I've been wanting to go long here since earnings, but I also wanted to see if we'd get closer to the lower trendline. Luckily I waited. But I'm at a point I don't want to wait longer to start my position/trade.
The reasons:
1. That lower trendline has held since October 2022. I might do something I rarely do which is set a stop loss somewhere like $530, just in case. But I think the bulls will jump back in here.
2. Look at the MACD. The last time it looked like this, Meta went on a run from $490 to about $750.
3. There's bullish divergence starting to appear in the RSI which is also oversold at 26.5
4. For the past 2 quarters, the POC is almost exactly where we are. This volume should at least slow the drop, and potentially work as a floor to bounce off of.
I'm not planning on holding this long term, but I will if I have to.
I just bought 25% of my trade and I'll DCA 3 more red days as long as it stays above the trend line. If it drops below the trendline, I'll hold and wait to see what happens with the structure.
I have 3 targes as usual:
Take Profit 1 = $650 (I think the 200day will be there) and I'll sell 50% of my position.
Take Profit 2 = $680 (there's some volume resistance there) and I'll sell 50% of my remaining position.
Take Profit 3 = $850 or if it touches the upper trendline.
Good luck!

$LCID Gains as it Opens Gravity Touring Orders in CanadaLucid Group (NASDAQ: NASDAQ:LCID ) is trading at $12.20, up 4.14%, after announcing that Canadian customers can now order the Lucid Gravity Touring, its newest luxury electric SUV. Starting at $113,500 CAD, the Gravity Touring strengthens Lucid’s presence in the premium EV SUV space. Deliveries begin early next year, and buyers can configure the model in English or French through Lucid’s “Design Yours” platform.
Interim CEO Marc Winterhoff noted that the Gravity Touring expands Lucid’s reach into a critical market segment. Built on Lucid’s proprietary EV architecture, the model blends full-size SUV practicality with mid-size dimensions and seating for up to seven people. Its 89 kWh battery delivers an NRCan-estimated 542 km of range, supported by access to Tesla Superchargers, Electrify Canada, and 1000V DC fast-charging at up to 300 kW.
Lucid’s proprietary rear-motor boost enables 220 kW charging speeds on Tesla’s network—another competitive advantage as charging infrastructure becomes a key factor in EV adoption. Performance remains a highlight: dual-motor AWD with 560 hp, 0-100 km/h in 4.2 seconds, standard air suspension, and an optional Dynamic Handling Package.
The cabin supports flexible five- and seven-seat configurations, up to 3,400 L of cargo capacity, and multiple styling choices, including a Stealth or Platinum exterior appearance. These features position the Gravity Touring as a direct challenger to Tesla, Rivian, and premium European EV SUVs.
Technical Outlook (NASDAQ: NASDAQ:LCID )
LCID remains in a bearish structure after falling from its $35 February high. Price has broken the critical $20 support and is now approaching the $10 zone, which acts as the next demand area. A bullish reversal requires reclaiming $15, while deeper weakness opens the path toward $8.

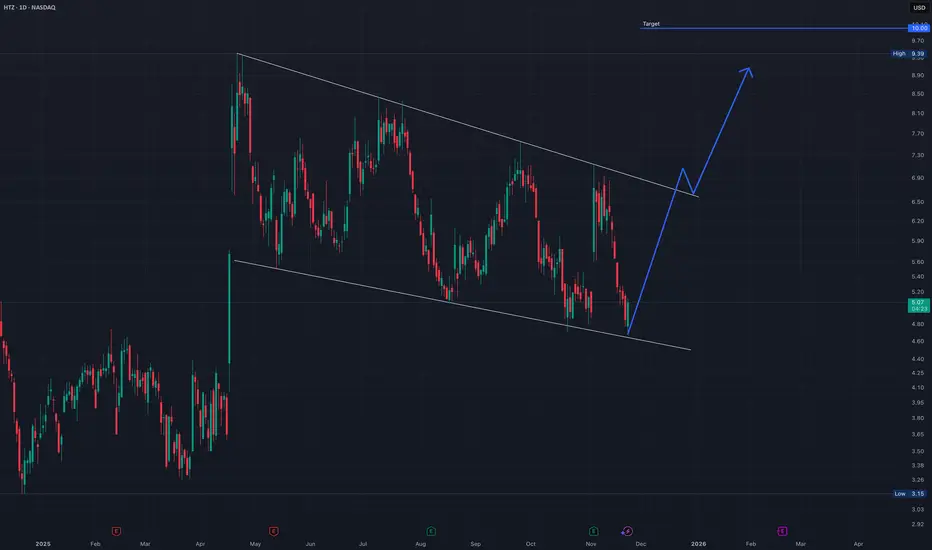
HTZ | Falling Wedge Reversal Setup - Breakout Toward $10Hertz Global Holdings (HTZ) is currently trading at the lower boundary of a well-defined falling wedge pattern, a structure that often signals a potential bullish reversal. The price has once again touched the wedge’s support line, showing early signs of reacting from this level. This repeated defense of support suggests that sellers may be losing momentum as the range continues to narrow.
If HTZ maintains support at this lower trendline and begins to push higher, the next key level to monitor is the upper wedge resistance. A confirmed breakout above that level may trigger a shift in trend, opening room for a measured move toward the $10 target area, which aligns with previous highs and the projected wedge breakout objective.
While the trend is still technically down, the structure of the wedge combined with the current bounce setup provides a constructive environment for a possible reversal. Confirmation and healthy volume on the breakout will be essential to validate the move.
(This idea is for educational purposes only, not financial advice.)
2025 Palantir Q4 Thesis Palantir is demonstrating a break in Market structure as shown over the last few weeks.
Causes:
Dollar Strength is causing the devaluation of All Assets.
Fear of an economic crisis are causing investors to take a risk off approach on Speculative assets which will create a particularly noticeable change in trend on high volatility/volume assets.
Several weeks of consistent short pressure
An abnormally high PE ratio
Hypothesis:
Palantir will range (136-207) until the next earnings call unless major news continues to catalyze growth. Further bullish movement will be dependent on Palantir continuing to grow revenue while maintaining an increased profitability while also increasing revenue. The expectation is that the company will expand so positive earnings will not immediately yield faster growth until the company better justifies its valuation.
Plan
Maintain a small qty of positions options between 136 and 153. Invalidate the plan if a break occurs below 136 on the weekly timeframe.
Duration:
2 Week contracts
Conditions:
Look to sell before Week 2
Sell at or above 153
1 Month Contracts:
Conditions:
Look to sell before Week 2
Sell at or above 153
