BA NOV 2025BA distribution 195–220, accumulation 140–120.
Upside tgt 195; downside tgts 165,145,140–120.
#BA #globaltrade #investment #investing #stockmarket #wealth #realestate #markets #economy #finance #money #forex #trading #price #business #currency

PYPL USPayPal is a rare combination of value and growth.
The company demonstrates strong fundamentals, is strategically focused on the future, and trades at record-low multiples. The combination of financial discipline, capital return, and AI innovation makes it an attractive asset for long-term investors.
The most recent quarter confirmed the resilience of PayPal's business model.
Revenue: $8.42 billion (+7% y-o-y).
Adjusted earnings per share: $1.34, exceeding analyst expectations by $0.14.
Total payment volume (TPV): $458 billion (+8% y-o-y), demonstrating the platform's scale and activity.
Free cash flow (FCF): $2.3 billion for the quarter, and the FCF margin increased 7 percentage points to 27%. This demonstrates high efficiency and the ability to generate cash.
Key Growth Drivers
Paypal isn't dependent on a single product, but is developing several promising areas.
Venmo: The main growth driver. Revenue accelerated to +14% year-on-year. The service is not only growing, but also becoming more profitable.
Buy Now, Pay Later (BNPL): Growing by more than 20% annually, in line with changing consumer behavior.
Upward Guidance: Management raised its adjusted EPS guidance for 2025 to $5.35-$5.39, implying growth of 15-16% year-on-year.
Partnership with OpenAI
This isn't just marketing, but a strategic bet on the future of commerce.
Bottom Line: PayPal is becoming the default payment infrastructure within ChatGPT. Users can instantly transition from searching for a product through an AI-powered conversation to paying with PayPal without leaving the chat.
Meaning:
For PayPal: A new, massive sales channel—"AI commerce" (agentic commerce)—is opening. The company is becoming a "commerce bus" between millions of its merchants and AI users.
For merchants: They automatically gain access to the ChatGPT storefront without the need for complex integration.
For OpenAI: ChatGPT is evolving from an assistant into a full-fledged commerce platform.
The company declared its first-ever dividend of $0.14 per share.
There is also a $6 billion annual buyback program. Shares have declined by 6.25% over the past year.
The "Dividend + Buyback" combination is a powerful signal that the company believes its shares are undervalued.
Historically low valuation
This is a key element of the investment thesis. The market completely ignores positive developments.
Multiples: PayPal trades at only ~12x expected 2026 earnings. This is lower than many less profitable fintech competitors (SoFi, Block).
The investor is paying a price that assumes a complete lack of future growth, while the company is showing double-digit profit growth, generating record cash flow, and building the business of the future.
From a technical analysis perspective , we are in the accumulation zone.
The price is near an uptrend line.
The RSI also signals divergence🌎

cmg ready to start a new cycle on mondaythe structure of cmg corrected the whole run and bouncing into new cycle at cycle lows should have a positive cycle into 2027

BMNR big move ahead?This is not likely a trade I will take, but there's lots of rumble about a big move ahead for BMNR.
Looking at the graph you can see why: it's getting squeezed.
From my side, I think it looks more bearish than bullish. Since the big drop in July, the price action is stuck in what looks like a bear pennant. In fact, it could be argued it already dropped out of the pennant and is currently retesting it.
Moreover, there's just a massive volume decline leading into earnings.
But in general, when stock prices squeeze like this, they generally lead to a big move. Earnings today could trigger that.
I could see either scenario taking place:
A breakdown which lead to a drop to the support at 40. Or if that doesn't hold, all the way to 200 day moving average at about 32.
I could also see it jumping. There's resistance starting at about 65.
For me, this trade is too much a gamble, and the risk reward is really not great.
It's better to wait for an earnings move and miss something rather than taking a risk that could cost you 20% of a position.
My plan:
1. wait for earnings. If there's a drop, I'll sell puts at an entry point I like (40 would be ideal).
2. If it doesn't move much on earnings, I might buy a late dated call option near my price target of 70.
3. If it pops up a lot on earnings, I'll chalk it up as a missed lotto ticket and leave it.
You don't need to trade everything...

Hi, i'm trying to revisit the Nvidia Journey here i'm trying to do some historical analysis , trying to find some important historical patterns which impacted the Nvidia price movement then and still valid or might impact the future price movement
I' hv a strong believe that price move within the constraint of the historical patterns and form new one for the future
full analysis will take few days, today , i'm starting with simple tl/angles formed by the first 2 monthly candles , in next 3 graphics u will find the impact of these 2 angles

SMCITake a close look at this long-term chart on a logarithmic scale. There are two distinct long-term bullish channels, as demonstrated by the different highlighted points. We are currently resting on the lower part of the steeper channel; we could even test the 27-28 levels, but I believe there will be room for a strong rally in the coming months. It could be broken by some corrective retracements, but I believe that those who start accumulating now are buying at very attractive prices.

AMD - Algorithmic Money DistributionIf you are an investor who only cares about AMDs business, fundamentals and growth and have no idea of technical analysis, this stock drives you crazy.
The fluctuations (+200$ in 6 months) have nothing to do with the underlying business. It is just algorithmic trading on steroids.
I believe the alorithms have finally reached their target on October 28th and AMD will retrace with the entire US stock market. 267$ might never be seen again.
A gap close to the 0.618 retracement at 165$ before Christmas would not surprise me at all.
This might even retrace to the 0.382 at 100$ in early 2027. Only time will tell.

Why are you buying this company ? Because some guru said so.....In investment, it is better to learn to make your own decisions than to rely on others. Learn to fish for yourself than to be fed all the time.
We can see from chart that price has fallen almost 50% from peak and is now making a possible trend reversal pattern from the support level at 273.
If this is for a short trade, maybe can enter with a SL below 255 and take profits at 368 or 414.
Just because someone in the social media preach about a certain stock, it does not mean it is a good stock to buy. Always DYODD . For example, I missed Pop Mart and discovered two great China stocks - Muyan Foods and Yantai China PetFoods .
In determining if a company has economic moat - it can be subjective and changes with time. Look at Starbucks China .
Tapping on the consumer sentiments in a big market like China is important ! But to know if it will last for many years require both science and art, imo. Take a look at EV markets in China. It is undeniably the largest manufacturer in the world and each player is now undercutting prices to outdo one another. Results ? Dwindling sales - a lose lose situation for all players. Yes, the EV market is still at its infancy stage and many countries are not fully adapting to it yet. Yes, the demand will be there but look at the share prices of these 3 players . That is why I avoid automotive companies as it is subject to lots of government policies and exports requirements !

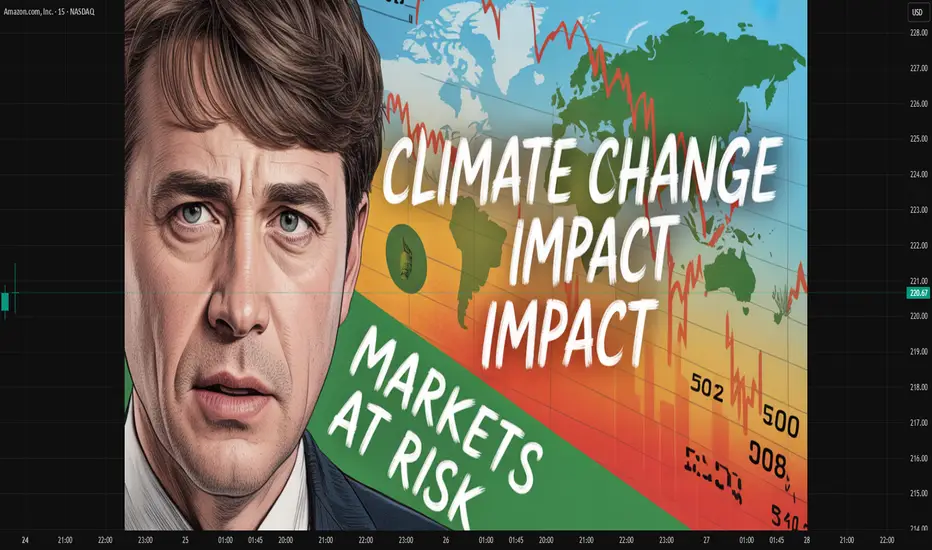
Climate Change Impact on the Global Market1. Economic Disruptions and Global GDP Impact
Climate change directly affects global economic output through productivity losses, infrastructure damage, agricultural decline, and health impacts. Increasing temperatures reduce labor productivity, especially in agriculture, construction, and manufacturing. Coastal economies face rising costs due to sea-level rise, threatening ports, factories, and tourism hubs.
Studies consistently estimate that unmitigated climate change could reduce global GDP by 10–20% by 2100, with disproportionate impacts on developing regions such as South Asia, Africa, and Southeast Asia. These regions face intensified heatwaves, droughts, and floods that strain food systems and public resources. Conversely, countries with cooler climates may experience temporary benefits, such as longer growing seasons, yet these are overshadowed by global supply-chain disruptions and market volatility.
2. Supply Chain Disruptions and Global Trade
Climate change poses a serious threat to global supply chains that depend on stable transportation networks, predictable weather, and consistent resource availability. Extreme weather events—such as floods in China, heatwaves in Europe, and hurricanes in the US—regularly disrupt manufacturing hubs, ports, and logistics networks.
For example:
Flooding disrupts industrial zones in China, Thailand, and India, impacting electronics, automobiles, and textile production.
Droughts reduce water availability for hydropower and manufacturing, affecting production costs and reliability.
Hurricanes halt shipping lanes and damage ports, slowing global trade flows.
Industry giants are now diversifying suppliers, relocating production, and investing in climate-resilient infrastructure. Companies increasingly factor climate risk into procurement and logistics decisions, making climate resilience a competitive advantage.
3. Agriculture, Food Prices, and Commodity Markets
Agriculture is among the most vulnerable sectors. Shifting rainfall patterns, extreme heat, soil degradation, and water scarcity reduce crop yields for staples like wheat, rice, maize, and soy. These disruptions trigger volatility in global food markets.
Key impacts include:
Reduced yield stability, making long-term pricing unpredictable.
Increased input costs due to water scarcity and changing pest patterns.
Price spikes in commodities such as grains, edible oils, and sugar.
Higher insurance and credit costs for farmers exposed to climate risks.
Livestock and fisheries also suffer, with warming oceans affecting fish stocks and coral reefs. As food prices rise and become more volatile, inflationary pressures build across developing economies, impacting household budgets and political stability.
4. Energy Markets and the Shift to Renewables
Climate change drives a massive transition in global energy systems. Governments and corporations worldwide are shifting from fossil fuels to renewable energy sources like solar, wind, hydropower, hydrogen, and bioenergy. This shift impacts global markets in several ways:
A. Decline of Fossil Fuels
Oil, gas, and coal sectors face decreasing long-term demand due to carbon regulations, electric vehicle growth, and renewable adoption. Major oil companies are diversifying portfolios into green energy and carbon capture technologies.
B. Rise of Renewables
Solar and wind energy markets are rapidly expanding, creating new jobs, lower power costs, and large-scale investment opportunities. Battery storage and grid modernization are also experiencing accelerated growth.
C. Energy Price Volatility
Climate-related events, such as hurricanes shutting down offshore rigs or droughts reducing hydropower output, contribute to unpredictable energy supply and price instability.
The energy transition is reshaping geopolitics: countries with strong renewable potential—such as India, China, and Brazil—gain competitive advantages in green manufacturing and energy security.
5. Financial Markets: Risks, Returns, and Regulations
Climate change increasingly influences financial markets through three major channels:
1. Physical Risks
Damage from natural disasters affects stock valuations, bond risks, and insurance claims. Companies with assets in high-risk regions face declining valuations and higher operating costs.
2. Transition Risks
Sectors slow to shift to low-carbon models face regulatory penalties, higher carbon taxes, and stranded assets (e.g., coal plants, oil fields). Investors increasingly examine decarbonization strategies before allocating capital.
3. ESG and Sustainable Investing
Environmental, Social, and Governance (ESG) investing has grown into a multi-trillion-dollar market. Climate-focused funds, green bonds, carbon-neutral portfolios, and impact investing influence stock market performance. Companies with strong climate policies attract more investment and better credit ratings.
Central banks worldwide now require financial institutions to assess climate risks through stress tests, making climate resilience a core component of global financial stability.
6. Insurance and Risk Management
Climate disasters—wildfires, floods, hurricanes—are more frequent and severe, overwhelming insurance systems. Claims have skyrocketed in recent years, forcing insurers to:
Increase premiums
Limit coverage in high-risk areas
Adjust business models toward risk prevention
Invest in climate analytics and catastrophe modeling
Some regions could become "uninsurable," which directly affects real estate prices, investment decisions, and economic development.
7. Corporate Strategy, Innovation, and Green Technology
Corporations are transforming their business models to cope with climate change. Many industries are embracing innovation to reduce carbon footprints and capture new market opportunities.
Key innovation areas include:
Renewable energy technologies
Electric vehicles (EVs) and charging networks
Smart grids and energy-efficient buildings
Carbon capture, utilization, and storage (CCUS)
Sustainable agriculture and vertical farming
Climate analytics and AI-driven risk modelling
Water-saving technologies and desalination
Companies that adapt quickly gain competitive advantages in regulatory compliance, consumer trust, and long-term profitability.
8. Consumer Behavior and Market Demand
Climate change has shifted consumer preferences toward sustainable products and green lifestyles. Demand is increasing for:
Electric vehicles
Plant-based foods
Eco-friendly packaging
Energy-efficient appliances
Ethical brands with sustainability commitments
Younger consumers, in particular, prefer brands that align with climate responsibility. Businesses that fail to adapt face declining market share.
Conclusion
Climate change is no longer a distant threat—it is a present and powerful force reshaping the global market. It affects everything from GDP growth and supply chains to financial markets, energy systems, and consumer behavior. While the risks are enormous, including economic losses, resource scarcity, and market instability, the transition to a low-carbon economy presents unprecedented opportunities. Companies, investors, and nations that innovate and adapt quickly will lead the next era of sustainable global growth.
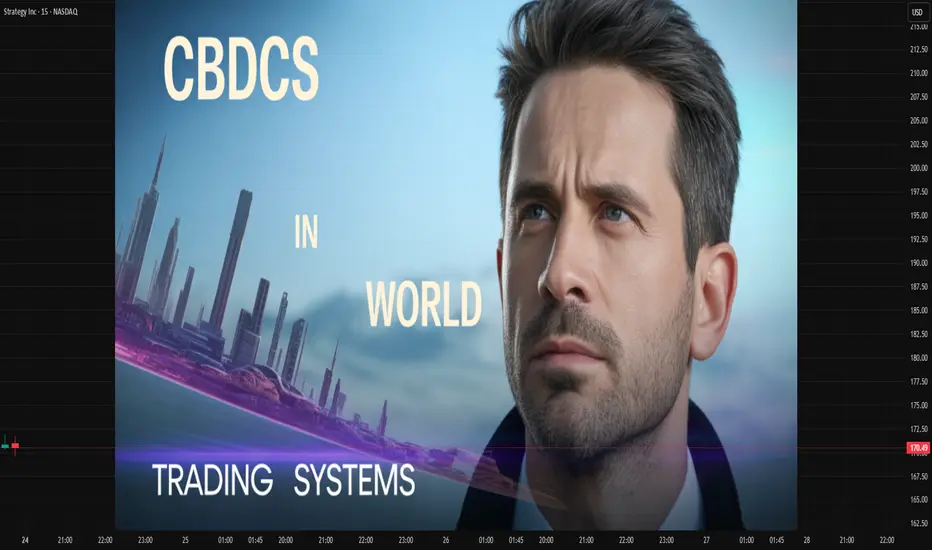
CBDCs in the World Trading System1. What Are CBDCs?
A CBDC is a digital form of legal tender issued by a country’s central bank. It is:
Sovereign-backed
Regulated and stable
A digital liability of the central bank
Designed for domestic and international use
CBDCs generally come in two forms:
Retail CBDCs – used by the general public for everyday transactions.
Wholesale CBDCs – used by financial institutions for large-value payments and settlements.
In the context of world trade, wholesale CBDCs hold greater significance due to their ability to streamline international payments and reduce reliance on intermediary banking systems.
2. Current Problems in the World Trading and Payment System
Before understanding the value of CBDCs, it's important to consider the limitations of the existing trading and settlement framework:
a. High Cost of Cross-Border Payments
International transactions often involve multiple banks, SWIFT messaging, and correspondent banking networks. This leads to:
Expensive transfer fees
Slow processing times
Reliance on intermediaries
b. Dollar-Dominated Global Trade
Over 80% of global trade is invoiced in USD. This creates:
Dependency on US monetary policy
Currency risk for emerging markets
High demand for dollar liquidity
c. Slow Settlement Processes
Cross-border trade can take days to settle due to:
Time zone differences
Compliance checks
Lack of common settlement rails
d. Fragmented Financial Infrastructure
Different countries use incompatible regulations, payment systems, and messaging formats, making interoperability difficult.
CBDCs are considered a strategic solution to all these challenges.
3. How CBDCs Can Transform the World Trading System
CBDCs have the potential to reshape global trade in multiple ways.
a. Instant and Low-Cost Cross-Border Settlements
CBDCs can enable near-instant settlements by connecting central bank systems directly through digital ledger technology (DLT).
Benefits:
Reduced transaction fees
Faster trade finance processes
Lower counterparty and settlement risk
b. Reduced Dependence on Intermediaries
Traditional cross-border payments rely on correspondent banks. CBDCs, however, enable:
Direct central bank-to-central bank transactions
Fewer intermediaries
Reduced complexity in the payments chain
This leads to greater efficiency and transparency.
c. Enhanced Transparency and Anti-Fraud Controls
CBDCs allow full traceability. This is advantageous for global trade because:
Money laundering can be detected easily
Fraud and trade-based financial crimes reduce
Compliance becomes more automated
With programmable features, central banks can embed smart compliance rules into the currency itself.
d. Strengthening of Local Currencies in Trade
If CBDCs become interoperable, nations may settle trades in their own currency instead of relying on USD.
This will help countries:
Reduce dollar exposure
Stabilize local exchange rates
Enhance monetary sovereignty
China’s Digital Yuan (e-CNY) is already being tested for cross-border trade to promote Yuan internationalization.
e. Programmability in Trade Finance
CBDCs can support programmable smart contracts, enabling automated trade functions such as:
Conditional payments
Automated customs clearance
Real-time shipment tracking linked to payment triggers
Smart invoices and escrow systems
This reduces human error, delays, and contract disputes.
4. CBDCs and Global Trade Networks
a. Interoperability Projects
Many global initiatives aim to connect CBDCs across borders:
mBridge (Hong Kong, China, UAE, Thailand, BIS)
Project Dunbar (Australia, Malaysia, Singapore, South Africa)
Project Icebreaker (BIS, Sweden, Norway, Israel)
These projects test how CBDCs can settle international trade without SWIFT.
b. Digital Trade Corridors
CBDC-enabled digital trade corridors can make it easier for regions to conduct business without dependency on legacy systems. They also facilitate:
Bilateral and multilateral trade agreements
Currency swap arrangements
Real-time settlement layers
c. Impact on SWIFT and Correspondent Banking
CBDCs could reduce global reliance on SWIFT. Although SWIFT is adapting through digital integration, CBDCs bypass many of SWIFT’s limitations.
5. Challenges and Risks of CBDCs in World Trade
Despite their potential, CBDCs face significant challenges.
a. Lack of Global Standards
Without common frameworks for:
Cybersecurity
Privacy
Settlement rules
Regulatory alignment
interoperability will be limited.
b. Cybersecurity Concerns
CBDCs increase vulnerability to:
Cross-border cyber-attacks
Systemic risk if central bank networks fail
State-sponsored digital warfare
c. Geopolitical Competition
Countries may use CBDCs to:
Avoid sanctions
Reduce dependence on dominant currencies
Create regional trade blocs
This could reshape global power balances.
d. Privacy Concerns
Governments may monitor transactions too closely, raising:
Data security issues
User privacy concerns
Risks of misuse of financial information
e. Impact on Commercial Banks
If businesses prefer using CBDCs for trade:
Commercial banks may lose transaction revenue
Deposits could shift away from banks
Banks may face funding pressure
Central banks must balance innovation without destabilizing financial institutions.
6. Future of CBDCs in the World Trading System
CBDCs are still in their experimental stage, but global momentum is strong:
Over 130 countries are exploring CBDCs
Over 20 countries are in pilot or launch phases
Major economies like China, India, UAE, and the EU are leading adoption
CBDCs will likely become a core settlement infrastructure in global trade within the next decade.
Future expectations:
CBDC-based trade hubs in Asia and the Middle East
Digital currencies replacing letters of credit (LCs)
Automation of global supply chain finance
Programmable trade contracts integrated into logistics systems
Rise of multi-CBDC platforms creating a unified digital trade layer
Conclusion
CBDCs represent a revolutionary step in the evolution of the world trading system. By providing a faster, cheaper, and more transparent method of cross-border settlement, CBDCs have the power to significantly reduce inefficiencies in global trade. They also promote monetary sovereignty, reduce dependence on the US dollar, and enable programmable trade finance. Although challenges such as cybersecurity, privacy, and geopolitical tensions persist, the direction of global finance clearly indicates that CBDCs will play a major role in shaping the future of international commerce.
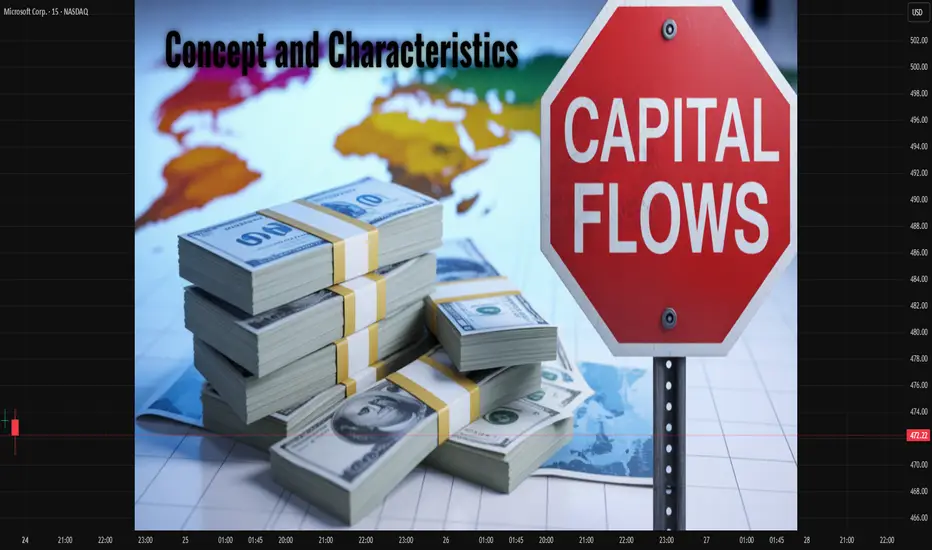
Capital Flows: Concept and Characteristics1. Concept of Capital Flows
Definition
Capital flows refer to the movement of financial resources between countries. These resources include investments in financial markets, real assets, loans, and banking transfers. The underlying motivation behind these flows is to seek higher returns, diversify risks, fund economic development, or benefit from interest rate differentials and exchange rate expectations.
In macroeconomic terms, capital flows form the capital account and financial account of a country’s balance of payments (BoP). When foreign investors invest in a country, it records capital inflows. When domestic investors invest abroad, it results in capital outflows.
Types of Capital Flows
Capital flows can be broadly categorized into two major types:
A. Foreign Direct Investment (FDI)
FDI involves long-term investments where a foreign entity acquires ownership or controlling stake in a domestic company. Examples include:
Setting up factories
Buying significant equity in a foreign company
Mergers and acquisitions
FDI is typically stable, growth-enhancing, and associated with technology transfer and employment generation.
B. Foreign Portfolio Investment (FPI)
These are investments in financial assets such as stocks, bonds, and other securities without acquiring management control. FPIs are highly liquid and sensitive to:
Interest rates
Market sentiment
Global financial conditions
Due to their volatility, FPIs are often called hot money flows.
C. Other Capital Flows
Bank loans and deposits
External commercial borrowings (ECBs)
Sovereign bond purchases
Remittances (often classified separately)
Short-term speculative flows
2. Importance of Capital Flows in the Global Economy
A. Financing Development
Capital flows help developing economies fill investment gaps. Low domestic savings often restrict capital formation, and foreign investment helps fund infrastructure, manufacturing, and services.
B. Enhancing Financial Market Efficiency
Global capital flows integrate financial markets, increasing liquidity and improving price discovery. This allows companies to raise funds more efficiently and reduces the cost of capital.
C. Boosting Productivity and Innovation
FDI brings new technologies, management practices, and skills that enhance productivity. Exposure to global competition also pushes domestic firms to innovate and modernize.
D. Supporting Balance of Payments Stability
Capital inflows help countries finance current account deficits. For example, if a nation imports more than it exports, foreign investments can help cover the gap.
E. Influencing Exchange Rates
Large inflows appreciate the domestic currency, while outflows lead to depreciation. Exchange rate movements, in turn, influence trade competitiveness and inflation.
3. Characteristics of Capital Flows
Capital flows vary in size, stability, duration, and impact. The following are key characteristics that define their behavior:
A. Mobility
In today’s digital, globalized financial system, capital flows are highly mobile. Investors can shift funds across borders with the click of a button. This mobility increases liquidity but also contributes to volatility.
For instance:
Rising US interest rates may trigger outflows from emerging markets within hours.
A geopolitical tension may cause investors to rapidly move towards safe-haven assets like gold or US Treasury bonds.
B. Volatility
Not all capital flows are stable. Portfolio investments, short-term loans, and speculative flows are extremely sensitive to:
Global interest rate changes
Investor sentiment
Currency movements
Political stability
A sudden reversal of flows can trigger financial instability, known as capital flight. Emerging markets are especially vulnerable because their financial systems are relatively smaller and more fragile.
C. Risk–Return Driven
The direction of capital flows is predominantly determined by risk–return calculations. Investors compare:
Interest rate differentials (e.g., “carry trade”)
Expected currency changes
Economic growth prospects
Political risks
Financial stability metrics
Countries with stable policies, higher returns, and sound macroeconomics attract more inflows.
D. Impact on Currency and Exchange Rates
Large capital inflows strengthen the domestic currency because foreign investors must purchase local currency to invest. This can lead to:
Cheaper imports
More expensive exports
On the other hand, capital outflows weaken the currency, sometimes resulting in inflationary pressures.
E. Short-Term vs. Long-Term Nature
Capital flows differ in duration:
FDI is long-term, stable, and less likely to exit suddenly.
Portfolio flows are short-term and highly reversible.
Short-term debts increase vulnerability during crises.
Countries with higher shares of short-term external debt face greater risks during global financial shocks.
F. Pro-Cyclicality
Capital flows often move in tandem with global economic cycles:
During global booms, flows rush into emerging markets seeking higher returns.
During recessions or crises, investors retreat to safer assets (“flight to safety”).
This pro-cyclical nature can amplify economic fluctuations in recipient countries.
G. Influence of Global Liquidity Conditions
Global financial conditions, especially monetary policies of major central banks like the US Federal Reserve and ECB, heavily influence the magnitude and direction of capital flows.
For example:
Low interest rates in the U.S. push investors toward emerging markets for higher yields.
Tightening monetary policy triggers widespread outflows.
H. Policy Sensitivity
Capital flows respond quickly to changes in:
Tax policies
Capital control regulations
FDI norms
Banking sector reforms
Political developments
Stable and transparent policies attract long-term capital, while unpredictable regulations discourage investors.
I. Impact on Domestic Financial Stability
Large capital inflows can create:
Asset bubbles (stocks, real estate)
Credit booms
Over-leveraging
Similarly, sharp outflows can lead to:
Currency crashes
Stock market declines
Liquidity shortages
Thus, managing capital flows is crucial to financial stability.
4. Policy Tools to Manage Capital Flows
Countries use several strategies to handle volatile capital movements:
A. Capital Controls
Restrictions on inflows or outflows to reduce vulnerabilities.
Examples:
Limits on foreign ownership
Taxes on short-term flows
Minimum holding periods
B. Exchange Rate Interventions
Central banks may buy or sell foreign currency to stabilize exchange rates.
C. Macroprudential Policies
Limits on external borrowing
Stress tests for banks
Higher reserve requirements
D. Building Forex Reserves
Large reserves help soften the impact of outflows and boost investor confidence.
Conclusion
Capital flows are a vital engine of global economic growth and integration. They help countries access investment, improve productivity, strengthen financial markets, and support development. At the same time, their volatility, mobility, and sensitivity to global events pose significant risks, especially for developing economies.
Understanding the concept, types, and characteristics of capital flows is essential for designing effective policies that maximize benefits while reducing vulnerabilities. Proper management of these flows enables countries to achieve sustainable economic growth and maintain financial stability in a highly interconnected world.
Global Economy Shifts1. Multipolarity and the Rebalancing of Global Power
For decades, the global economy operated under a largely unipolar structure led by the United States and its Western allies. Today, this dominance is fading as new economic blocs rise. Emerging markets—most notably China, India, Southeast Asia, the Middle East, and Africa—are becoming engines of global growth.
Rise of Asia
Asia now contributes more than half of global economic growth. China remains the world’s second-largest economy despite slowing growth, while India is emerging as the fastest-growing major economy, driven by demographics, domestic consumption, and digital infrastructure.
Shift Toward Regional Blocs
Increasing geopolitical tensions between the U.S. and China have accelerated the formation of economic blocs:
BRICS+ expansion has brought new resource-rich members.
Regional trade agreements such as RCEP and CPTPP are reshaping Asia-Pacific integration.
The European Union, despite internal challenges, is investing in strategic autonomy, green energy, and advanced manufacturing.
This move toward multipolarity is redefining investment flows, supply chains, and diplomatic alignments.
2. Technological Transformation and the Digital Economy
Technology is the most powerful force reshaping global economic structures. The accelerating adoption of AI, automation, robotics, and digital platforms is altering productivity, labor markets, and competitive advantages.
Artificial Intelligence as a Growth Catalyst
AI is transforming sectors such as finance, healthcare, logistics, and manufacturing. Countries that invest heavily in AI—like the U.S., China, and South Korea—are gaining competitive edges.
Digital Infrastructure Expansion
Digital connectivity has become the backbone of national competitiveness. Innovations such as:
5G and upcoming 6G networks
Cloud computing
Quantum technologies
Blockchain and digital payments
are enabling new business models. Digital public infrastructure (DPI), led by India’s UPI, Aadhaar, and ONDC, is becoming a blueprint for emerging markets.
Techno-Economic Fragmentation
However, technology is also driving global fragmentation:
Competing semiconductor supply chains
Restrictions on data flows
Tech-related sanctions
Global technology standards may split into competing spheres, creating challenges for multinational corporations.
3. Geopolitical Conflicts and De-Risking of Supply Chains
Conflicts such as the Russia–Ukraine war, Middle East instability, and U.S.–China tensions have triggered a significant rethinking of global supply chains.
From Globalization to “De-Risking”
Countries are not fully de-globalizing, but they are diversifying away from single-source dependencies. This has led to:
Nearshoring (e.g., U.S. companies shifting production to Mexico)
Friendshoring (production moving among geopolitical allies)
China+1 strategy (India, Vietnam, Indonesia as beneficiaries)
Resilience Over Efficiency
Companies are prioritizing:
Multi-location manufacturing
Strategic stockpiling
Strengthening logistics networks
Supply chains are becoming more regional and networked, reducing vulnerability to shocks.
4. Green Transition and the Economics of Climate Change
Climate change is reshaping policymaking and investment decisions. Governments and corporations are transitioning toward low-carbon economies, driving structural changes across energy, transportation, manufacturing, and agriculture.
Shift Toward Clean Energy
Renewables—solar, wind, hydro, hydrogen—are experiencing massive investment. Nations like China lead in solar manufacturing, Europe in wind technology, and the Middle East in green hydrogen.
Electric Vehicle (EV) Transformation
EV adoption is accelerating globally, forcing:
Auto companies to redesign supply chains
Battery manufacturers to secure critical mineral sources
Governments to provide subsidies and carbon regulations
Climate-Resilient Infrastructure
Rising temperatures and extreme weather events require substantial investment in resilient infrastructure, influencing fiscal priorities worldwide.
5. Demographic Changes and Labor Market Evolution
Demographics play a critical role in shaping economic potential.
Aging Economies
Developed nations—Japan, South Korea, much of Europe, and even China—face aging populations, shrinking workforces, and rising healthcare burdens. This leads to:
Lower long-term growth
Higher fiscal pressure
Increased need for automation and immigration
Youthful Economies
In contrast, India, Africa, and parts of Southeast Asia have young populations and rapidly urbanizing societies. These countries will be key drivers of global labor supply and consumer demand in coming decades.
Future of Work
Automation and AI will redefine jobs across sectors. While high-skilled workers benefit from rising productivity, low-skilled jobs face displacement. Upskilling, remote work, and gig economy platforms are altering labor structures.
6. Shifts in Global Trade, Currency, and Finance
Global trade patterns are being reshaped by:
Tariffs and trade barriers
Sanctions
New trade agreements
Carbon border taxes
Changing Currency Dynamics
While the U.S. dollar remains dominant, alternative currency arrangements are gaining traction:
BRICS countries exploring settlement in local currencies
Digital currencies and central bank digital currencies (CBDCs)
Bilateral trade agreements bypassing the dollar
Although the dollar’s dominance will not end soon, its relative share is gradually declining.
Capital Flow Reconfiguration
Investments are moving into:
Resilient supply chains
Green energy
Technology hubs
Emerging markets
Sovereign wealth funds, especially from the Middle East, are playing a major role in global capital allocation.
7. Consumer Behavior and Market Transformations
Consumers are shifting their preferences due to technological access, environmental awareness, and rising incomes.
Key trends include:
Increased digital consumption
Demand for sustainable products
Rapid growth of e-commerce and online services
Preference for personalized and subscription-based models
Emerging market middle classes—especially in India, Indonesia, and Africa—are becoming major contributors to global consumption growth.
Conclusion: A Transformative Decade Ahead
The global economy is transitioning through a period of deep structural change. Multipolarity, technological acceleration, shifting demographics, climate imperatives, and geopolitical tensions are transforming how nations trade, innovate, and grow.
The next decade will be defined by adaptability. Countries and companies that invest in technology, diversify supply chains, embrace sustainability, and harness human capital will emerge as winners. As economic power diffuses and the global order evolves, agility and resilience will shape the new world economy.

MSTR (possible short)Alot going on here, but its jus because I have been charting this out since around March.
BTC has a bearish setup where we could possibly see 92.5Kish.
Looking at MSTR which is a huge follower, we broke below the 200 on the daily.
My reasoning for possible short entry (red dot).
1. Trend Based Fib (3-point in green): shows we could bounce here, but extend down toe the $200 level.
2. We could bounce here because we are re-testing the monthly IB that we broke out, we are at the 50% quadrant of that IB.
3. However, we are currently trading within the 3M quarterly candle, and the HTF breakout we had was never re-tested. Sweeping this 3M candle, would put us in a good spot for long term growth.
4. Short entry would be red dot, with covering at the last high on daily ($358ish).

Technical Analysis & Trading Plan for $NGD (As of July 28th)1. Identified Pattern: Ascending Channel Formation
Beginning on Monday, July 28th, the price action for AMEX:NGD has begun to structure itself into a clear ascending channel. This is a technically significant pattern characterized by a series of higher highs and higher lows, contained within two upward-sloping parallel trendlines. This pattern typically indicates a controlled, bullish uptrend, where buyers are consistently stepping in at progressively higher levels.
2. Key Technical Levels: Support and Resistance
The boundaries of this channel have established our primary framework for trade management:
Immediate Resistance: The $7.50 level is acting as the current ceiling within the channel. This is the level where selling pressure has previously emerged, and a decisive break above it would signal a significant strengthening of the bullish momentum.
Critical Support: The $6.50 level is serving as the foundational support, aligning with the channel's lower trendline. A breach of this support would invalidate the current bullish structure and suggest a potential trend reversal or a period of consolidation.
3. Profit-Taking Strategy: A Tiered Approach
The plan outlines a three-tiered profit-taking strategy, utilizing key Fibonacci retracement levels to secure gains at various stages of a potential pullback. These are not buy targets, but rather logical areas to take profits if the price reverses and declines from its current level.
The take-profit (TP) levels are as follows, in order of priority:
TP1: $6.00 - This is the initial profit-taking level, representing a logical support zone just above the channel's lower boundary.
TP2: $5.72 (0.382 Fibonacci Retracement) - A standard and respected retracement level where one might expect a minor bounce or pause in a downward move.
TP3: $5.09 (0.5 Fibonacci Retracement) - A deeper retracement level, often considered a "golden" pullback level where the overall trend is often tested. Taking profits here captures a larger move.
4. Trade Execution Trigger
The analysis specifies a precise trigger for this profit-taking plan to become active. The strategy is initiated only if the price declines and breaches the $6.49 level, which corresponds to the 0.236 Fibonacci retracement level. A break below this level acts as an early warning signal that the immediate upward momentum is waning and that the price is likely to continue down towards the predefined take-profit targets. At this point, one would look to execute the tiered profit-taking strategy on any subsequent bounces or as the price reaches each TP level.
In Summary:
The overall thesis is that AMEX:NGD is in a short-term uptrend within an ascending channel. The trade management plan is contingent on a break of the $6.49 support. If that break occurs, the strategy shifts from a bullish hold to a systematic process of securing profits at the $6.00, $5.72, and $5.09 levels.

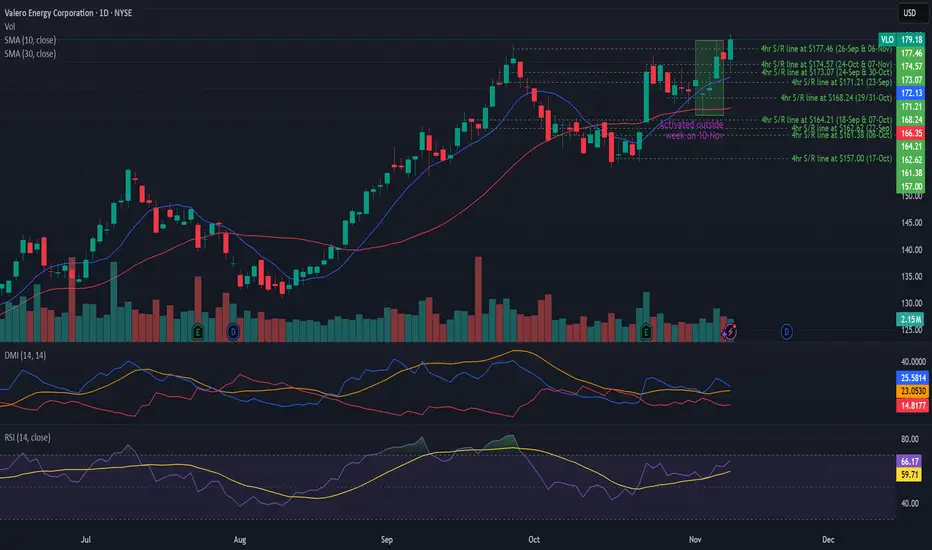
Potential outside week and bullish potential for VLOEntry conditions:
(i) higher share price for NYSE:VLO above the level of the potential outside week noted on 7th November (i.e.: above the level of $179.10).
Stop loss for the trade would be:
(i) below the low of the outside week on 4th November (i.e.: below $165.05), should the trade activate.
WaverVanir Market Intelligence — PLTR UpdatePalantir is showing one of the strongest bifurcations we’ve seen this quarter:
our Institutional ML Forecast Model projects a 63% upside toward $252,
while our SMC + Fibonacci liquidity map outlines a deeper liquidity-seek toward $111 if the current structure breaks down.
This divergence is exactly why VolanX runs multi-framework confirmation instead of relying on a single bias.
VolanX DSS Read — Key Signals
Strong Buy signal from the institutional ML ensemble
Target Range: $252.62 (30-day predictive horizon)
Prediction Volatility: 114.84% — high-velocity environment
Model Agreement: 8 of 9 bullish
Sharpe Ratio (simulation): 1.66
SMC / Fibonacci Structure Read
Price is currently sitting at the 0.886 retracement — a high-reaction zone
Clear CHoCH signaling short-term displacement
If price fails to reclaim equilibrium (~$171–$178 zone),
liquidity magnets sit at:
$133
$124
$111 (1.618 full extension)
Interpretation
Bullish bias from AI models + bearish liquidity structure = compression environment.
Historically, PLTR produces violent expansions after this setup.
VolanX plays these environments with reduced position sizing and event-driven execution until direction resolves.
Outlook
We will update our directional call once the following triggers confirm:
Daily close above equilibrium → bullish continuation
Daily close below $147.56 → liquidity sweep pathway toward $133 / $124
WaverVanir continues to monitor PLTR using both institution-grade AI forecasting and human-validated smart-money structure.

IREN 1D - Bullish Continuation PatternSaw a double-top formation on the IREN 1D, zoomed out, saw something similar back in Q2 2024.
Drew a Bar Pattern Continuation for fun to post to twitter about "Chart Squigglers".
Bullish IREN, in all seriousness.

Stock market will test yearly levels below current supportAs the yearly candle closes and the new one opens, there is an orderflow pattern that is well developed. This will play out again as always 💎

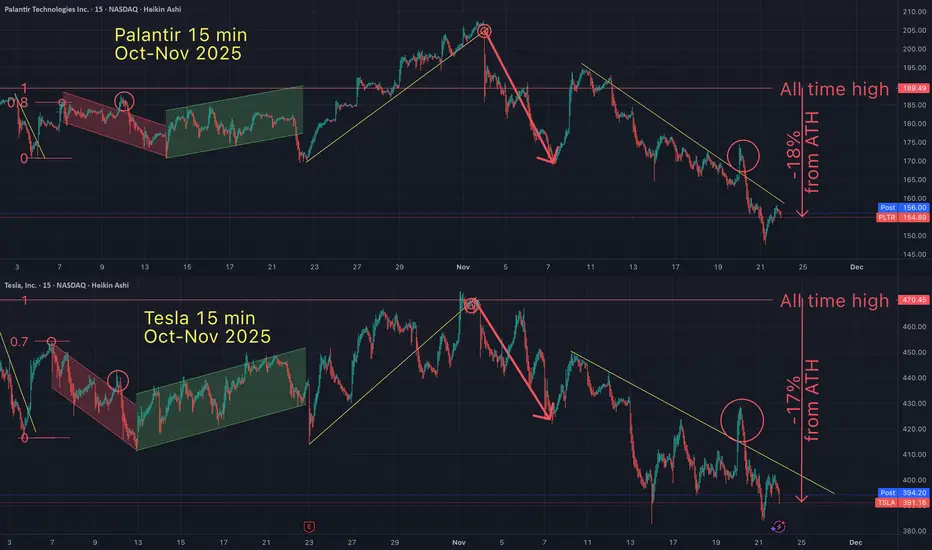
Tesla / Palantir Fractal - 50 Days of identical price action?On oct 7th I suggested that Tesla and Palantir had been in a 'fractal" pattern. Since identifying this pattern, it's been 50 days of identical price action (on the 15 minute timeframe). But this fractal goes back much further in time.
Fractals are a mathmatical anomaly, if you understand linear equations (and believe the market is "random"). All assets are doing the same patterns over and over, on all time frames. You just need to see it for what it is.
May the truth be with you.
Fundamental Rerating Ahead📌 Regional Health Properties (RHEP) – Technical & Fundamental Analysis
Company Overview
Regional Health Properties, Inc. (RHEP) is a U.S. healthcare real-estate operator focused primarily on skilled nursing and senior care facilities. The company recently completed a transformative integration with SunLink Health Systems, materially expanding its portfolio and operational footprint.
In November, RHEP also finalized the sale of the Coosa Valley Health & Rehab facility for $10.6M, generating an estimated $3.7M gain and significantly reducing debt. Together with a strong Q3 report showing ~$1.17 EPS, the company is entering 2026 with cleaner leverage, improved liquidity, and growing earnings power.
📊 Technical Analysis (Based on the Chart Provided)
1. Multi-year Volatility Cycles
The chart highlights three major historical expansion phases:
+95% expansion
+1,909% vertical rally
+239% recovery cycle
RHEP has a history of compressed bases followed by explosive percentage expansions. This pattern repeats across 2019–2025, indicating the ticker is structurally prone to high-magnitude breakouts once accumulation finishes.
2. Current Compression Zone
Price is trading in a long-duration base around $1.40–1.50, extremely tight compared to past volatility clusters. Historically, whenever RHEP compressed into low-volatility structure, it preceded a multi-hundred-percent trend.
The current zone resembles the pre-2021 buildup before the 1,900% rally.
3. Volume Profile
Although recent volume is thin (OTC characteristic), the spikes in 2024–2025 align with accumulation behavior rather than distribution. There is no large panic volume—suggesting long-term holders, not forced sellers.
4. Measured Move Projection
The chart shows a potential target at $67.91, representing a 4,164% move from today’s levels. This isn’t unrealistic within the ticker’s history—RHEP has produced >1,000% cycles multiple times.
Technically, the projection is based on:
Height of previous major expansion
Base-to-break ratio
Historical volatility signature
A breakout above ~$2.20 would confirm the structure.
📈 Fundamental Rerating Potential (Based on Our Conversation)
Q3 Earnings Power
Q3 EPS: ~$1.17
Annualized EPS: ~$4.68
Impact of Asset Sale
The Coosa Valley divestiture:
Adds approx. $3.7M profit
Eliminates ~$4.9M debt
Strengthens cash position by ~$4.7M
Adjusted earnings power becomes materially higher.
Revised Fair-Value Range (EPS-based)
From our calculations:
Conservative fair value: ~$42
Realistic fair value: $67–84
Optimistic cycle: $100–125
The $67.91 TradingView target therefore aligns perfectly with the realistic valuation band.
This is not a hype target — it is grounded in both the improved fundamentals and RHEP’s multi-year expansion behavior.
🎯 Final TradingView Summary
**RHEP is entering a classic low-volatility compression zone after a transformative balance-sheet and earnings shift. Historically, these bases have produced 95% → 239% → 1,900% expansions.
With a Q3 EPS around $1.17, a major asset sale adding ~$3.7M, and debt reduction improving leverage, the fundamental rerating supports a technical target around $67–84 in a multi-quarter horizon.
A breakout over $2.20 would confirm the launch of a new expansion cycle, with $67.91 acting as the primary measured-move target.”**

TSLA SELL++++ $360-370 to be testedAs I posted last week, and, clearly too early TSLA needs to test the $370 range where it broke out from. I do pat myself on the back for the epic bounce off support at $324.80 that needed to hold to see $426's and TSLA always goes further then we think both ways. We're way overdone and todays reversal shows it. $370's imminent in coming weeks

LULU BUY+++++ $248.79 TARGET AND RESISTANCE/ SUPPORT LEVELLULU is down 54% this year at this level which has bounced beautifully fro 2019 pre covid major support $158.70 we should have a .5 fib retracement as we did in April to a tough zone of support/ resistance, take profit at $248!
Nov 21, 2025 options open interest
CALLS 24,749 $185-$250 strike
vs
PUTS 6963 $190-$220 strike
Seasonally LULU should run up towards Christmas shopping season
.5 retracement is $248.79 a high probability retracement target which LULU retraced to the penny last drop April 9 to May 20th
marketbeat.com/stocks/NASDAQ/LULU/options/

LULU BUY+++++ reclaimed 20 DMA 50 DMA to be tested before 150DMALULU reclaimed the 20 DMA, the macd, AO, RSI all turning positive as we are trading into an ascending wedge which should break out to the .5 FIB $248.79 which is also the 150 DMA. Calls outpace puts almost 5 to 1
