$SNDK – “Last Man Standing” Short Setup After a 500% RunNASDAQ:SNDK – Last Strong Memory Stock Now Showing Cracks
NASDAQ:SNDK has been an absolute monster — up nearly 500% in just a few months — and it’s the last man standing in the memory-stock mania. But today, we finally have the first real sign of exhaustion.
🔹 The Setup:
This name has not closed below the 9 EMA for more than a day in months — pure trend monster behavior.
Today we’re printing a reversal candle with a long upper wick — the kind of signature you look for when a parabolic trend loses steam.
After such a massive run, even a normal retracement could be 20–30% down.
🔹 Sector Context:
Other memory names have already cooled off.
NASDAQ:SNDK is the last stronghold, and that’s usually the one that gets hit hardest when the tide finally turns.
When the leader cracks, the rest of the sector often unwinds together.
🔹 My Trade Plan:
1️⃣ Entry: Initiated a short in the mid-$260s.
2️⃣ Stop: Using today’s high of day — clean and tight.
3️⃣ Target: Looking for a sustained break below the 9 EMA, something we haven’t seen in months. First downswing could be brutal.
Why I Like This Short:
Reversal wick at peak extension.
Parabolic trend with no real pullback in months.
Sector softening while NASDAQ:SNDK is overstretched.
Clean stop, massive potential reward.
This is exactly the type of high-reward mean reversion trade I take after extreme exhaustion runs.

META now close to a critical trendlineMETA is approaching a significant technical region.
The trendline currently in focus originated on 31 October 2022, and it has remained relevant over time.
This same trendline was retested twice in April of this year, and price action is once again moving toward it after achieving a new all-time high.
At the moment, the asset is sitting at the Fibonacci 61.8% retracement level — a well-known zone where reversals often occur. Based on this structure, the asset may begin its upward move from the current region, or it may decline by an additional $10–$20 to retest the ascending trendline.
I have taken my initial positions in META during this pullback and may increase my exposure if price reaches the trendline.
Overall, my outlook remains bullish.
Trade responsibly.
Entry: RR is 1:3
Confidence: High

$NIO: Big move aheadNYSE:NIO seems to be forming a cup& handle pattern on the chart. The target of this pattern is 13$
After a harsh move to the downside NYSE:NIO is likley to test the blue colored SMA. This SMA has been strong resistance in the past, as shown in the chart. Now there is an opportunity to turn this SMA in to a support and push to complete the cup & handle pattern.
I imagine some consolidation before the big move.

Blue Skies or Elevator Down?Currently trading inside a chop zone.
The repeated holds on the downtrend algo suggest this entire area has been accumulation around PWH/PMH. With the Berkshire stake and the negative sentiment floating around, it’s hard to know their exact cost basis — but the structure hints accumulation took place near the 50-day (around 285) and along the downtrend algo, with the upside trigger lining up at 302.65 and BPS levels at 306.89/312+.
Key levels I’m tracking:
• Low-Vol ST 1: 290.58
• Low-Vol ST 1b: 323.20
• Buy/Defense Zones: 285 • 290.58 • 295
I trade intraday — pure scalps. My entire approach is finding the pressure points where one side gets trapped and putting them against the wall.
I’m a trading assassin. I hunt bulls. I hunt bears. I survive the market.
I see the chart, and I act.

BEFORE THE RUN: Cup & Handle SUNRUNNASDAQ:RUN is building a clean Cup & Handle setup and is now sitting right in the sweet spot of the Handle - the zone where strong bases tighten up before they break. Price action is contracting, volume has dried up, and the chart is squeezing out the last bit of supply. The breakout trigger is straightforward: a decisive push and close above the horizontal rim of the cup. Crucially, it only matters with real volume - no volume, no breakout; a genuine expansion confirms institutional interest and validates the move. Risk is tight and well-defined: the stop goes right below the recent Handle low. The structure is complete, the Handle is tightening, and NASDAQ:RUN is essentially waiting for the switch to flip. The next move could be the RUN - all eyes on the breakout level 🎯

I guess it is a bubble...When the CEO is selling, the CFO is selling, SoftBank is unloading, Peter Thiel is selling, and Michael Burry is short, you have to stop and ask the only question that matters:
Is it actually smart to buy the dip here?
I didn’t even bother checking the latest SMH holdings, but if anyone wants to post the updated weightings, it would help frame how much passive-flow risk still sits above price.
The real question is whether there’s room left on the downside and whether this is anywhere near a bottom. If you want an example of how low “too low” can go, just study META during its unwinding. Fundamentals didn’t matter. Valuation didn’t matter. Price just kept repricing until forced sellers were done.
The one positive about this environment is volatility. When liquidity thins out and ranges widen, both sides can pull money out — but only if you treat it like a scalp environment, not a swing-long hero trade.
Because think about it rationally:
Do you want to be the one buying while billionaires, insiders, and institutions are selling into strength?
We’re moving into year-end — historically the period where funds clean books, tax-loss harvest, and unwind risk. Pair that with the probability of crypto-liquidation bleed-through, and you can easily get a chain reaction. Markets don’t fall in straight lines; they fall like Jenga blocks, dominoes, or a card tower collapsing from the bottom up.
This isn’t doom posting — it’s just market structure.
Flow dictates direction, and right now the flow is one-directional.

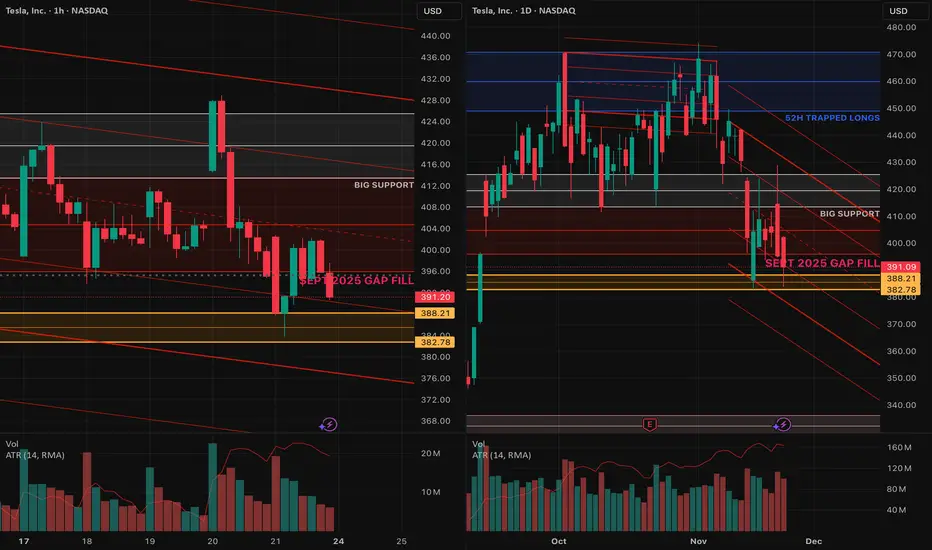
TSLA ... From darling to toxic exThere is nothing to debate.
PWL at 382.78–388.21 must hold, or buyers get steamrolled. We’re trading below the 50-day on the daily, and any strength is likely to be sold into. I hate leaning this bearish, but if there’s going to be a short-term bounce, it *starts* with the PWL holding. With heavy overhead supply near 400, this is not a name where you want to be the early hero.
If the PWL breaks, downside opens to the 200-day near 338 or the beige pocket between 328–336.
Negative headwind:
Forget Musk's latest pay package, his last one could wipe out years of Tesla profits
By Chris Kirkham
www.reuters.com
AMD Under Watch ⇌ Sellers Strengthening at Major Supply Zones🔥📉 AMD “ADVANCED MICRO DEVICES INC.” – Bearish Profit Playbook | Thief Layers Deployed 🚨
Hey traders! 😎🔍
Here’s my bearish swing/day-trade playbook on AMD, crafted with a fun + professional thief-style twist while staying within TradingView rules. Let’s break it down 👇💼
📉 Plan: Bearish Outlook Active
Price action remains heavy, momentum cooling off, and sellers showing presence near key zones.
Thief Squad preparing for controlled entries 😎🧤.
🎯 Entry Plan (Thief Layering Strategy)
This setup uses a layered limit-style approach — also known as multiple staggered entries to smooth positions.
📌 Proposed Sell-Limit Layers:
230
220
210
(You can extend layers based on your own system — thief flexibility ALWAYS 😎)
⚠️ Note: These are example layers for illustration, not fixed instructions. Adjust based on your own risk model.
🛑 Stop-Loss (Thief Safety Net)
SL Zone: 240
Dear Ladies & Gentlemen (Thief OG’s) 💼🕶️
This SL is simply my reference point — NOT a rule.
You decide your own SL based on your risk appetite, not mine.
Make money? Then take money… at your OWN risk 💰😄.
🎯 Target Zone
Price has a strong support cluster aligning with:
Moving Averaging acting as dynamic support
Oversold zone building
Trap mechanics likely
So the quick escape target is:
👉 TP: 180
Dear Ladies & Gentlemen (Thief OG’s) 💼😄
My TP is not mandatory — adjust yours as you wish.
Take your profits and leave before the “police” catches our position 🚓💨😆.
🔗 Related Pairs to Watch (Correlation Insights)
These assets often move with similar sentiment due to tech-sector correlation, semiconductor supply chain, and risk-on/off flows:
💻 NVDA (NVIDIA)
Strong semiconductor leader — AMD often shadows NVDA’s volatility and sector direction.
📱 QQQ (NASDAQ 100 ETF)
AMD is inside the NASDAQ index. When QQQ sells off, AMD typically follows the broader tech flow.
🌐 SMH (Semiconductor ETF)
Tracks the entire chip sector. Helps understand overall industry strength or weakness.
⚡ TSLA (Tesla)
Not directly connected, but both ride similar high-beta risk cycles. Weak tech sentiment can drag TSLA and AMD simultaneously.
Watching these helps confirm momentum, risk appetite, and sector-wide signals 📊🔍.
🧠 Additional Notes
This setup is for educational, fun, strategy-style illustration purposes.
NOT forcing a fixed entry, SL, or TP on anyone.
Trade smart. Manage risk. Thief style = creativity + discipline ✨😎
✨ “If you find value in my analysis, a 👍 and 🚀 boost is much appreciated — it helps me share more setups with the community!”

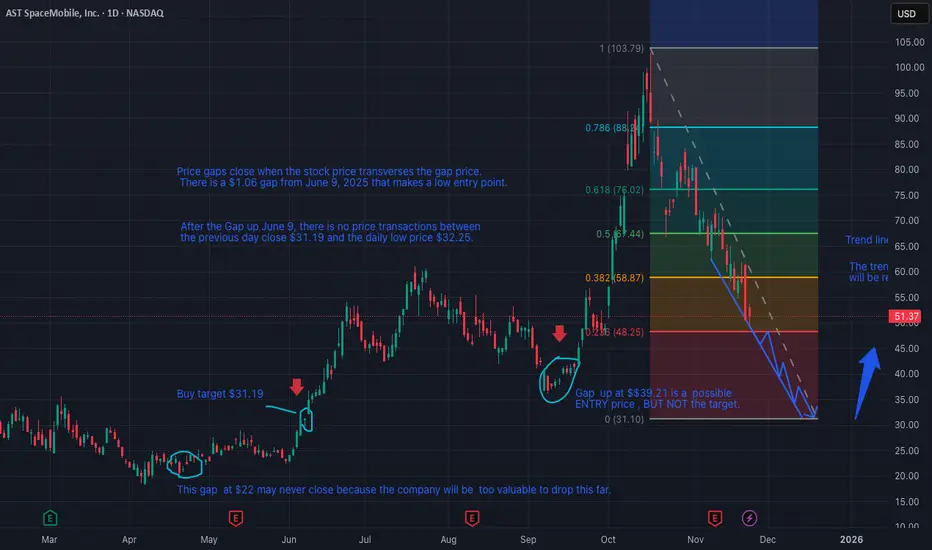
ASTS gap up $31.19 is Buy Target - chart revision 2I am long ASTS and have been accumulating it over the year. I plan to hold long term as I expect ASTS to have explosive growth with a divided in the future.
When a stock price gaps up, that gap gets filled eventually (most of the time). The bottom of the gap is a good entry point as the price will come back down to fill it before returning to its uptrend. ASTS has two gaps that I am watching: $39.21 and $31.19 I made this chart to use the downward trend line to determine when the gaps might get filled.
The gap between $31.19 - $32.25 ($1.06 gap) from June 6 - June 9, 2025, is the lowest gap that I will consider buying. ( I will place a buy order at $31.20 to assure it can get filled. Sometimes gaps will get filled right on the money and sometimes it goes below. ) The gap is on target to be filled mid- December. ASTS is launching satellites on December 15. If the launch is successful the price is likely to rise with positive news.
There is a higher gap at $39.21 - $39.85 from September 12 - September 15, 2025. There is a gap at $22, but I don't think the price can get that low. It is possible the gaps WILL NOT GET FILLED, so keep that in mind if you are accumulating.
From press release: "AST SpaceMobile, Inc. ("AST SpaceMobile") (NASDAQ: ASTS), the company building the first and only space-based cellular broadband network accessible directly by everyday smartphones, designed for both commercial and government applications, today announced BlueBird 6, a U.S. licensed satellite, is scheduled to launch on December 15th from the Satish Dhawan Space Center in India."
I believe these gaps will fill in December because the company is close to operational and the world wide interest in owning shares will re-rate the value of the company making it unlikely that the price will drop below these prices again. This is my opinion and not financial advice. This is an update chart and text, version 2. Your comments and suggestions are welcome.
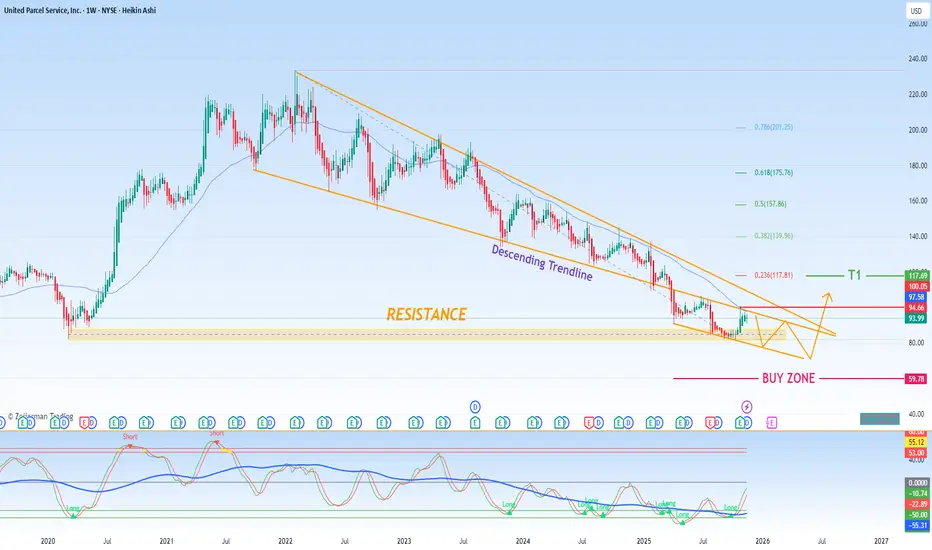
Technical Analysis Report: $UPS (United Parcel Service)1. Historical Price Context & Trend Identification
The long-term chart for NYSE:UPS reveals a significant period of depreciation that initiated around Monday, October 4th, 2021. This established a clear and persistent downtrend. However, a critical technical development occurred on Monday, March 31st, 2025, when the price action conclusively broke above the primary descending trendline that had governed the stock's movement for over three years. This breakout is a technically significant event, as it suggests a potential exhaustion of the prior bearish momentum and a shift in market structure. While not a guarantee, this breach of a long-standing resistance line opens the possibility for a new, bullish phase to begin.
2. Key Technical Levels & Trading Strategy
Based on the current chart structure, we can identify several critical price levels that will be pivotal for determining the next major move.
Immediate Resistance: $80.00
This is the most critical short-term hurdle. A confirmed and sustained breakout above the $80.00 level, preferably on high volume, would serve as the strongest confirmation yet that the new bullish trend has validity. It would signal that buyer conviction is strong enough to overcome a key area of previous selling pressure.
Projection & Buy Zone: $60.00 - $70.00
It is important to manage expectations following a breakout. A common market behaviour is for the price to retrace back towards the newly established support level (the former descending trendline, now acting as support). This retracement offers a more optimal and lower-risk entry point. Therefore, our primary accumulation or buy zone is identified between $60.00 and $70.00. A pullback into this zone would be viewed as a healthy consolidation within the nascent bullish structure, providing a favourable risk-to-reward setup.
The "Red Line" Support: ~$100.00 (Re-evaluation Required)
Your mention of a "red line" at $100.00 is noted. Given the current price context (with the stock trading below $80), a move to $100 would actually represent a significant rally from current levels. Therefore, this level would likely act as a secondary profit-taking target or a resistance zone on the way up, rather than a buy zone. A more logical interpretation of a key support level to "buy" would be the newly formed ascending trendline or a significant moving average that aligns with the $60-$70 zone.
3. Profit-Taking Target
Upon a successful entry in the $60-$70 buy zone, with a confirmed hold of support, the initial medium-term profit-taking target is projected at the $120.00 level. This objective is based on measuring the potential impulse wave following the breakout from the long-term downtrend and aligns with a prior area of significant price history.
Summary & Outlook
In conclusion, the breakout on March 31st, 2025, is a constructive development for $UPS. The trading plan is as follows:
Wait for a pullback into the $60.00 - $70.00 zone for an optimal long entry.
Use a stop-loss below this zone (e.g., below $58.00) to manage risk in case the breakout fails.
Watch for a decisive break above $80.00 as confirmation of strengthening bullish momentum.
Take profits in stages as the price approaches the $120.00 target.
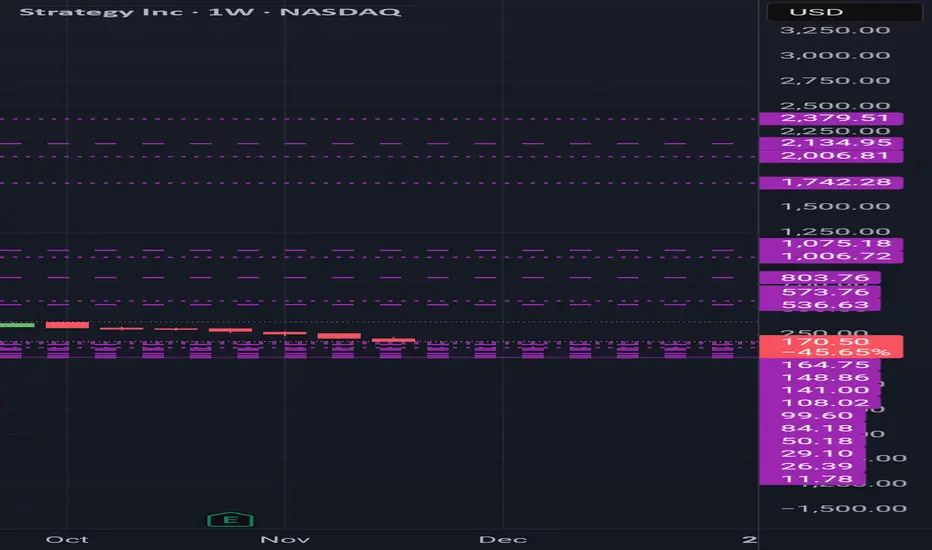
DECODED ANALYSIS STRATEGY (MSTR)MSTR is currently in the second phase of its second quarterly grand cycle, with a long way to complete this cycle.
Currently near upper support at $164.75,
⭐Pattern support is noted at $141, and if this pattern support breaks, than next
support noted at $108.2.
Multiple skip supports are noted at $29.1 and lowest at $11.78,
After correcting, a huge pump will occur,
Resistance for 2026, 2027 are noted at $536.63, $573.76, $803.76, $1006.72, $1075.18,
Resistance for 2030 are noted at $1742.28, $2006.81, $2134.95, $2379.51,
Resistance for 2034, 2035 are noted at $6046.67, $6979.31,
Important note, all my analysis is based strictly on actual factual supports and resistance with no predictions,
This message is for educational purposes only.
Always DYOR.
Where It Started — Retail Never Heard the MSCI Whispers⚡️ Where It Started — The Perpetual Offering Nobody Took Seriously (MSCI Was Only Whispers Back Then)
🌐 Referenced Tweet (Announcement of the Perpetual Preferred Offering):
x.com
⸻
⚡️ The Moment No One Realized Was the Start
When this perpetual preferred offering was announced, retail shrugged it off.
But this tweet was the first real signal that something bigger was shifting beneath the surface.
At that moment:
• The MSCI exclusion risk was only industry whispers
• Retail had zero clue
• Macro liquidity was tightening
• Crypto-heavy balance sheets were getting risky
• Companies were quietly positioning early
This offering wasn’t loud.
It wasn’t marketed as defensive.
But it was — and now the charts expose exactly what they were preparing for.
⸻
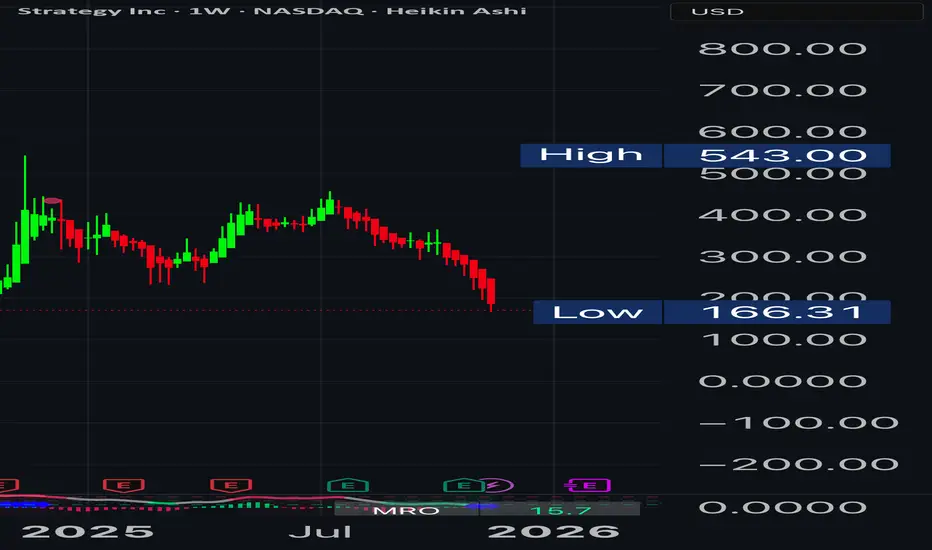
📉 MSTR Weekly (June ’25 → Now)
• Peak near $543
• Now near $374
• Low of $166
• Multi-month distribution
• Slow, steady derisking — NOT a panic crash
This is exactly what happens when institutional flows dry up slowly after classification risk rises.
Retail didn’t see it.
The chart did.
⸻
📉 BTC Weekly (June ’25 → Now)
• High: $126K
• Current: $104K
• Low: $74.5K
• Lost upward trendline
• Not a blow-off — a slow liquidity fade
Again, the signature of structural deweighting.
Not fear.
Not news.
Flows.
⸻
⚡️ The Link to MSCI
When this perpetual offering was issued:
• MSCI exclusion wasn’t public
• Analysts were only hinting
• No press releases
• No retail coverage
• No major alerts
But companies close to the fire knew classification rules were shifting.
So they raised capital early.
Retail had no idea.
They wouldn’t know for months.
⸻
⚡️ The Takeaway
This tweet marks the starting point of a long structural shift that retail didn’t understand until it was already deep in motion.
The perpetual offering was the tell.
The MSCI rules were the trigger.
MSTR and BTC’s breakdown was the confirmation.
MSTR Monthly & Quarterly Waterfall Crash In MotionI'm adding MSTR (MSTU 2x, MSTZ -2x ETFs) to my trading portfolio.
If there is a knife that I do not want to catch, THIS IS IT! MSTR is going to the toilet, even if you thought it's already in it... it's not in the toilet yet.
This Monday there's a possibility of a single-day reaction HIGH which could give us a new SHORT entry window. I will open a SHORT Monday night or Tuesday morning if the Indicators confirm a Bearish Divergence. If Tuesday closes higher than Monday then the bounce should last a bit longer.

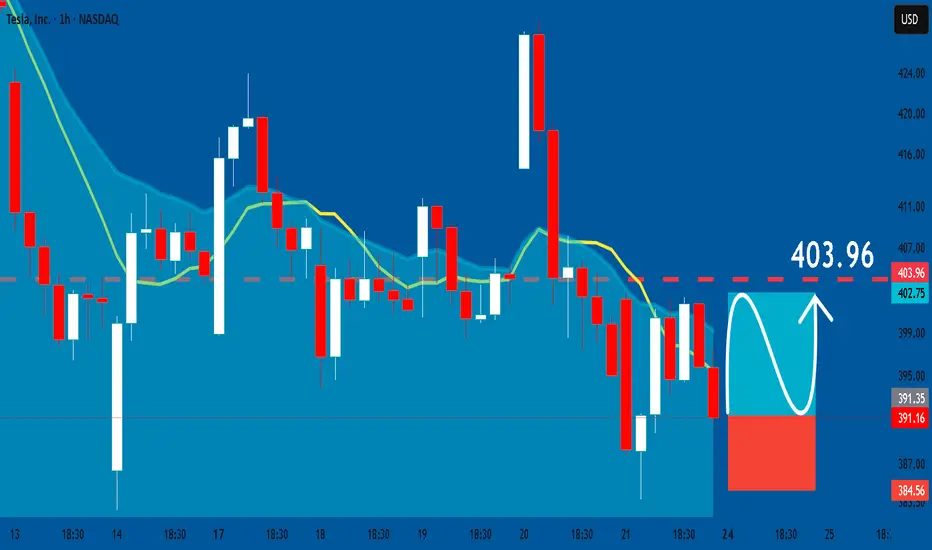
TESLA: Long Signal Explained
TESLA
- Classic bullish pattern
- Our team expects retracement
SUGGESTED TRADE:
Swing Trade
Buy TESLA
Entry - 391.16
Stop - 384.56
Take - 403.96
Our Risk - 1%
Start protection of your profits from lower levels
Disclosure: I am part of Trade Nation's Influencer program and receive a monthly fee for using their TradingView charts in my analysis.
❤️ Please, support our work with like & comment! ❤️
Biglots --- big reversal The structure looks to be that of a leading diagonal. This most recent drawdown is looking like the 2 wave downward. If correct, wave 3 should follow... This should target to atleast the 1.618 fib.

One last puff or green monsnterEnviva Inc. is the world's largest producer of wood pellets used for energy production. Will they survive or declare bankruptcy?
According to the chart, this most recent drop has wicked through the 2.618 for wave C of the expanded flat. We'll see soon what is to come.

NVTA - Amazon of Genonomics or BankruptInvitae Corp. (NVTA) engages in the provision of genetic information into mainstream medical practice. It includes comprehensive panels for hereditary conditions in cancer, cardiology, neurology, pediatric, and rare diseases.
If you look at this from an Elliot Wave point of view the B wave up wicked through the golden ratio (1.618). Over the past 2 years, NVTA has slowly moved down in price. Most recently, based on news that bankruptcy is coming in the coming week price has crashed from .40 to .015. The most interesting part of this is this move down, or the C wave, hit the 3.14 ratio. Lets see if this wicke turns into the 2.618 by the end of the month. According to Elliot, 2.618 is rare for expanded flats, but still an option.
Let's see if NVTA declares bankruptcy in the coming weeks or still has a bit juice still in the tank. To add, largest shareholder CW, has capitulated.
To be continued...

QRETAQurate Retail, Inc. engages in the business of video and online commerce industries. It operates through the following segments: QxH, QVC International and CBI. The QxH segment markets and sells a wide variety of consumer products in the U.S., primarily by means of its televised shopping programs and via the Internet through their websites and mobile applications. The QVC International segment markets and sells a wide variety of consumer products in several foreign countries, primarily by means of its televised shopping programs and via the Internet through its international websites and mobile applications. The CBI segment consists of a portfolio of aspirational home and apparel brands in the U.S. that sell merchandise through brick-and-mortar retail locations as well as via the Internet through their websites. The company was founded on March 28, 1991 and is headquartered in Englewood, CO.
May get a dump sub .20 for the pump.
For entertainment purposes

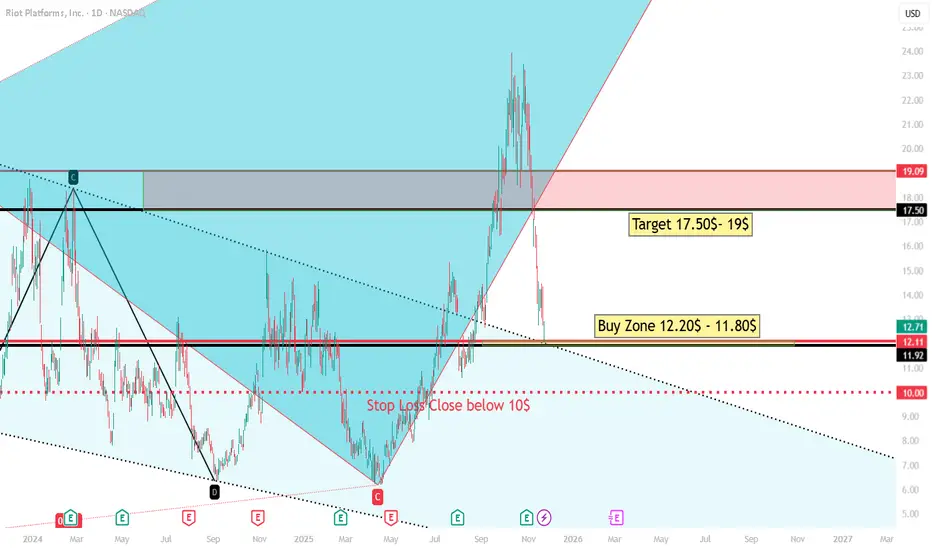
Riot📊 Riot Platforms (RIOT) – Technical Analysis
1. Current Price Action
The stock is trading around $12.7, showing a sharp pullback after a strong rally. The recent decline brought price back into a previously established demand/support region.
2. Key Levels
🔵 Buy Zone: $12.20 – $11.80
This zone is clearly marked on your chart and aligns with:
A previous support–resistance flip
The lower boundary of the recent breakout area
A potential Fibonacci retracement region (based on the structure)
Price is currently sitting just above this area, meaning the stock is approaching an attractive risk-to-reward entry level.
🔴 Stop Loss: Close Below $10
The $10 level is critical because:
It’s a major psychological support
It aligns with the bottom of a broader descending trendline zone
A close below it would break the bullish structure and invalidate the long setup
This makes it a logical and conservative stop-loss placement.
3. Target Zones
🎯 Target 1: $17.50
This level corresponds to:
The previous consolidation / supply zone
A Fibonacci extension / measured move region
A strong horizontal resistance visible on the chart
🎯 Target 2: $19.00
This is the upper boundary of the supply zone and a likely strong resistance point if momentum continues.
These targets provide a 3:1 to 4:1 risk-to-reward ratio, making the trade setup attractive if the buy zone holds.
4. Trend Structure
Your chart highlights:
A completed harmonic/gartley-like formation (C-D leg)
A breakout from a long-term descending trendline
A bullish channel formation after the breakout
The current pullback appears to be a healthy retest of:
The breakout zone
Major support
Demand region
If price stabilizes around $12.20–$11.80, the uptrend may resume.
5. Volume & Momentum
Although not explicitly shown in the screenshot, the price behavior indicates:
A sharp decline but without major capitulation volume
A possible formation of a higher low (if Buy Zone holds)
This suggests sellers may be losing strength as price approaches support.
📈 Summary – Professional Outlook
Bias: Bullish as long as price stays above $10
Entry Area: $12.20 – $11.80 (high-probability demand zone)
Targets:
First: $17.50
Second: $19.00
Stop Loss: Close below $10
Setup Type: Pullback to support / trend continuation
KTOS
KTOS Test - testing this on paper trade - turns out there was a false breakout on a upwards trend

AppLovin’s Turning PointFew listed companies have moved from relative obscurity to the centre of a global industry as quickly as AppLovin. A decade ago it was known mainly in mobile gaming circles. Today, it sits at the core of how thousands of mobile applications acquire users and make money, powered by an increasingly influential advertising platform built on artificial-intelligence techniques.
That transformation is now colliding with two powerful forces: exceptional financial momentum on one side and rising regulatory scrutiny on the other. Understanding the current state of AppLovin means looking at both stories at once.
What AppLovin Actually Does
At its core, AppLovin is an infrastructure company for the mobile application economy. It provides a technology platform that helps:
Developers of mobile applications show advertising inside their apps and get paid for those impressions.
Advertisers reach the right users at the right moment inside those apps, and measure whether those campaigns are actually profitable.
The company positions itself as an “outcome-driven” marketing platform: instead of simply maximising the number of ad impressions, its tools try to maximise the advertiser’s return on each unit of advertising spend. Its products help clients:
acquire new users for their apps
monetise those users through in-app advertising
track and analyse the performance of campaigns across different ad networks and channels.
In practical terms, a mobile game studio, a shopping application or a streaming service can plug into AppLovin to outsource much of the heavy lifting of advertising technology.
From Game Publisher to Advertising Infrastructure
AppLovin began with deep roots in mobile gaming, including publishing and operating its own titles. Over time, however, the strategic emphasis shifted decisively from being a game studio to becoming the “picks and shovels” provider powering many studios at once.
That shift is now largely complete. In 2025, AppLovin sold its mobile game studio to Tripledot Studios in a transaction worth around eight hundred million dollars, a clear signal that management wants a cleaner, asset-light profile focused on software and data rather than content ownership.
The long-term bet is simple: there are far more economics to be captured in running the rails of mobile advertising than in betting on individual game hits.
The Axon Engine: AppLovin’s “Brain”
The centre of AppLovin’s current strategy is its proprietary engine known as Axon. Axon is a large-scale decision system that evaluates every potential advertisement impression in real time. It decides:
which advertisement should be shown to which user
how much to bid for that impression on behalf of an advertiser
how to balance short-term revenue with longer-term campaign objectives such as retention or in-app purchases.
The latest generation, often referred to as Axon 2, is described by the company and external analysts as a powerful recommendation engine that learns from billions of data points to optimise campaigns. It sits inside a closed ecosystem that combines both “supply” (the apps showing advertising) and “demand” (the advertisers buying it), allowing continuous feedback loops and optimisation.
In 2025 AppLovin rebranded the platform as “Axon by AppLovin” and introduced Axon Ads Manager, a self-service interface that lets advertisers manage campaigns directly through a dashboard. Initially, access is by referral only, emphasising a controlled ramp-up with selected partners. The goal is explicit: to position Axon as a high-return alternative to the advertising ecosystems of very large technology platforms such as Meta and Google.
Financial Momentum: Growth With Extraordinary Margins
The numbers behind this strategy help explain why AppLovin has attracted so much attention in public markets.
For the full year 2024, the company generated approximately 4.71 billion dollars in revenue and about 1.58 billion dollars in net income, implying a net profit margin in the mid-thirties. That is already a highly attractive profile for an advertising technology business.
The acceleration continued into 2025. In the third quarter of 2025:
revenue reached about 1.4 billion dollars, an increase of roughly sixty-eight percent compared with the same period a year earlier
net income rose to around 836 million dollars, up more than ninety percent year on year
Analysts highlight an adjusted operating profit margin above eighty percent in the latest quarter, an extremely high figure even by software standards and far above the typical advertising technology peer.
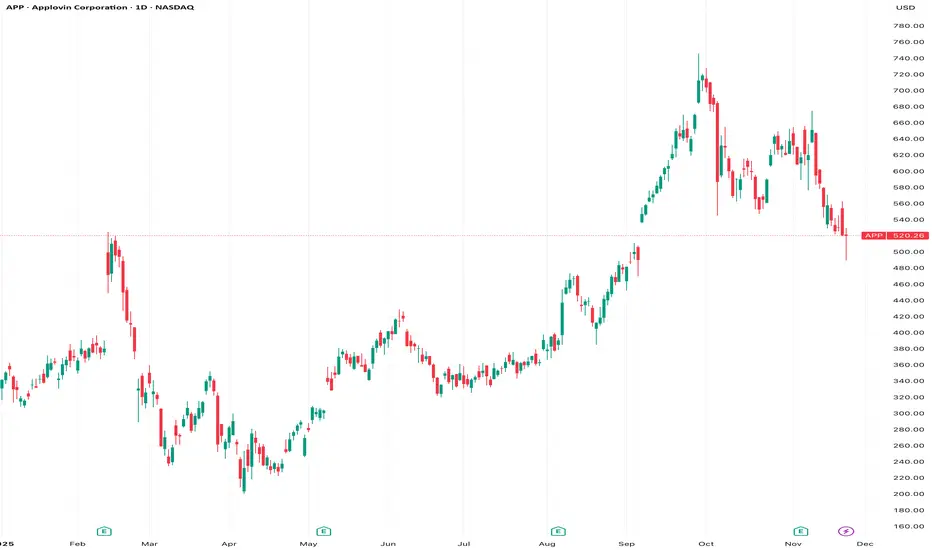
Management has guided for roughly 1.59 billion dollars in revenue in the fourth quarter (mid-point of guidance), ahead of the average analyst expectation of about 1.55 billion dollars.
The stock market has responded accordingly. Over the past year, AppLovin’s share price has more than quadrupled and it has been added to the main large-capitalisation equity index in the United States. In calendar year 2025 alone, the shares have more than doubled. At the time of writing, AppLovin’s shares trade around five hundred and twenty dollars, giving the company a market value in the region of two hundred billion dollars.
This combination of rapid top-line growth, very high margins and a strong stock-market performance has led some commentators to describe AppLovin as a rising leader in artificial-intelligence-driven advertising platforms.
The Shadow on the Story: Data and Regulation
Against this backdrop of financial success, however, the company faces a serious challenge: growing regulatory scrutiny over how it collects and uses data.
In October 2025, reports emerged that the United States Securities and Exchange Commission had opened an investigation into AppLovin’s data-collection practices, following a whistle-blower complaint and several reports by short-selling firms. These critics allege that AppLovin may have violated service agreements with large platforms in order to gather data for advertising purposes, and that certain products enabled more intrusive tracking than disclosed.
Further reporting has suggested that multiple state attorneys general are also examining whether AppLovin’s practices might have breached privacy rules, including regulations designed to protect children online. One controversial product, known as Array, has already been shut down after accusations that it enabled unauthorised application downloads and tracking behaviour.
AppLovin strongly denies wrongdoing. The company says that its systems require user consent and comply with industry standards, and it has hired the law firm Quinn Emanuel to conduct an independent review of the allegations. At this stage, the Securities and Exchange Commission has not formally accused AppLovin of any violation, but the overhang is real: the initial news of the investigation triggered a double-digit percentage fall in the share price in a single session.
For investors and industry observers, the key question is whether the company’s growth has relied on practices that may not be acceptable under tightening privacy rules, or whether it can demonstrate that its edge comes primarily from better modelling and integration, not from cutting corners on compliance.
Strategic Ambition at Global Scale
Regulatory questions aside, AppLovin is clearly playing for very high stakes.
The company has already paused and then reopened access to its flagship Axon platform in order to manage growth and product quality. It is investing heavily in new formats such as dynamic product advertisements that automatically generate image-based creatives for commerce clients, and it is expanding well beyond gaming into sectors such as online retail and services.
Its ambitions extend into deal-making as well. Reports indicate that AppLovin has made a bid for the non-China assets of TikTok, underlining management’s willingness to contemplate very large acquisitions that could reshape the digital advertising landscape.
If Axon Ads Manager gains traction as a self-service tool, AppLovin could increasingly look like a third major “walled garden” in performance advertising, alongside the largest social and search platforms. That would strengthen its bargaining power with advertisers and partners but might also invite closer attention from regulators and competitors.
How to Think About the Current Situation
For readers who are new to the story, AppLovin today can be summarised in three points:
It has become critical mobile infrastructure. Its tools help a large portion of the mobile application ecosystem to acquire users and monetise attention. This gives it scale advantages and a rich data environment that are hard to replicate.
Its financial profile is unusually strong. Revenue is growing rapidly, profitability is very high and cash generation is robust. The market has rewarded this with a very high valuation.
It is operating under an intensifying regulatory cloud. Allegations around data privacy and user tracking, plus formal investigations by regulators, introduce non-trivial legal and reputational risk.
The balance between those three forces will determine the next chapter. If AppLovin can demonstrate that its competitive edge is sustainable within stricter privacy norms, continue to roll out Axon successfully and avoid major legal penalties, it could consolidate its position as a long-term winner in performance advertising. If, however, investigations uncover serious issues or lead to restrictive settlements, the current profitability and valuation could prove difficult to justify.
For now, AppLovin is both one of the most impressive growth stories in digital advertising and one of the most closely watched from a regulatory perspective. Anyone following the mobile economy over the next few years will need to keep an eye on this company, its Axon platform and the evolving rulebook that governs how personal data can be used in the pursuit of advertising performance.
This article is for information purposes only and does not constitute investment advice or a recommendation to buy or sell any security.
RSI DivergenceHello fellas,
This is a very classic textbook RSI divergence scenario where we see that rising price tops with lower RSI tops.
It means that even though price increased, the momentum has decreased.
When you see rising price + decreasing momentum = it usually means buyers are exhausted.
Buyers exhausted = weak buying = strong selling = price down.
Thank you,
-not a buy or sell recommendation. just sharing my idea regarding a very classic RSI divergence pattern and how did it look like.
Don't over complicate, don't think of ideas out of place. If there is confusion, it means you don't know what's happening. If it is clear as day light, it means it is clear as day light.
The market is the market, you can't control it. However, you can control your actions and learn from yourself. Though preferably not the hard way.
Easy to learn new things, but 10x harder to unlearn wrong things.

$MSTR: Monthly down trend...GM lads, looks like we have a fully confirmed monthly down trend in $MSTR...this likely is bad news for all of crypto.
Stay safe out there...
Cheers,
Ivan Labrie.
