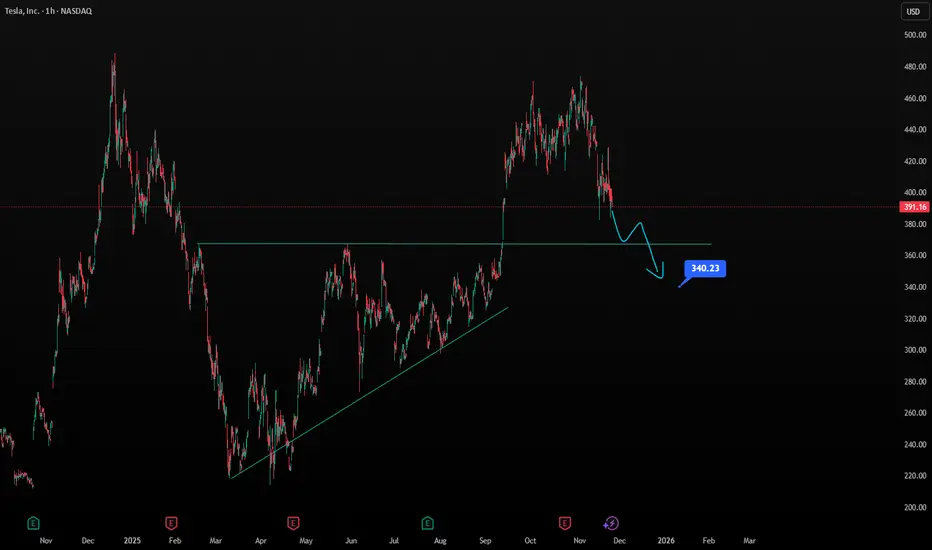
Midterm Stock Forecast for TeslaNASDAQ:TSLA at $391 shows weakening technical structure, suggesting a continuation toward $340. H1 trendlines indicate fading bullish pressure. Fundamentals remain mixed: energy storage grows, but auto margins face pressure and competition intensifies. The $340 zone is a key demand area for potential midterm stabilization.
Midterm Stock Forecast for METANASDAQ:META At $594, Meta enters a buy zone after the sharp decline since late October. H1 technicals show stabilizing momentum. First target stands at $660, and extension toward $760 remains possible if ad revenue and AI-driven engagement trends stay strong. Valuation still supports midterm upside after the recent correction.

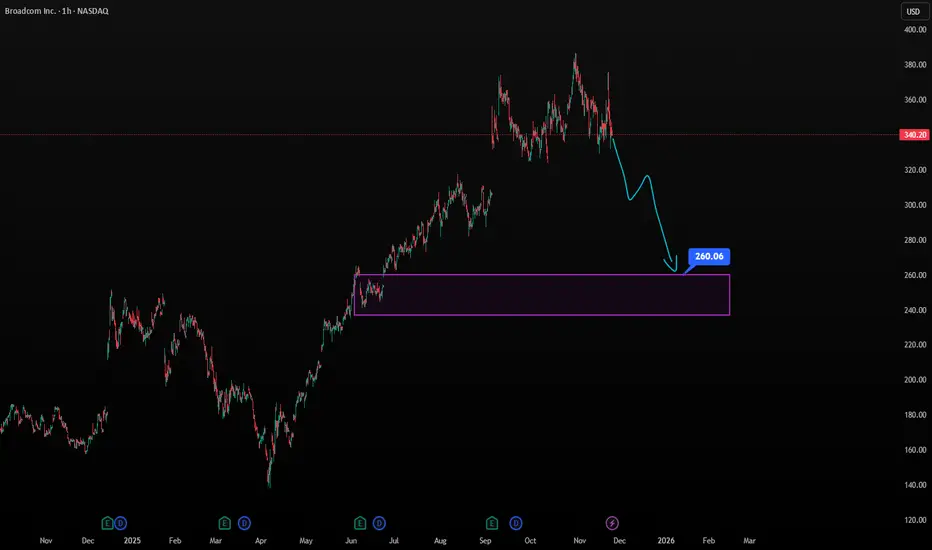
Midterm Stock Forecast for BroadcomNASDAQ:AVGO trades near $340, consolidating after significant gains. A drop below $320 may trigger selling toward $260 as H1 trend support breaks. Conversely, holding current levels and breaking $373 unlocks a move toward $480. Strong semiconductor demand and AI-networking exposure support long-term bullishness despite short-term volatility.
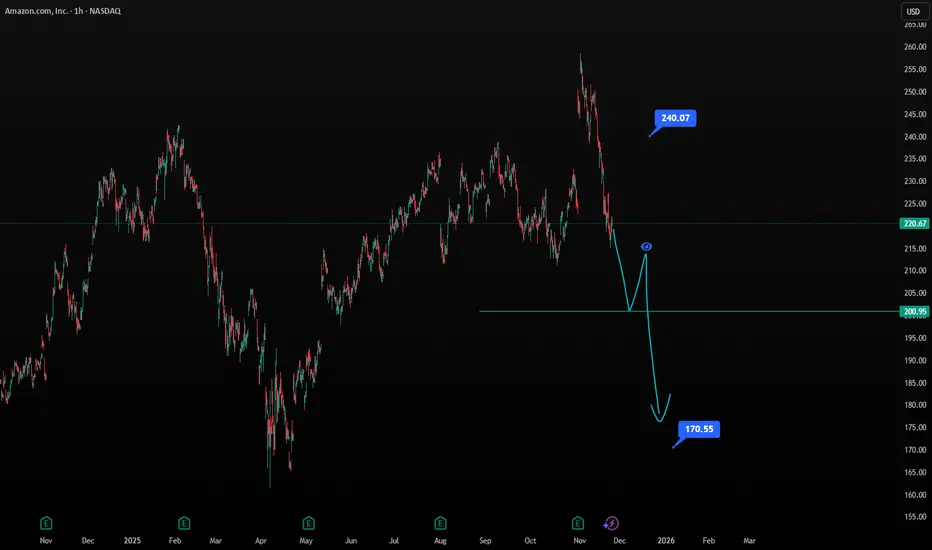
Midterm Stock Forecast for AmazonNASDAQ:AMZN At 220, Amazon sits at a pivotal midterm level. Holding $200 keeps bullish structure intact with upside potential toward $244. A breakdown below $200, however, exposes $170 as a downside target. Fundamentally, AWS growth and retail margin improvements support the bull case, but macro softness could trigger deeper corrections.
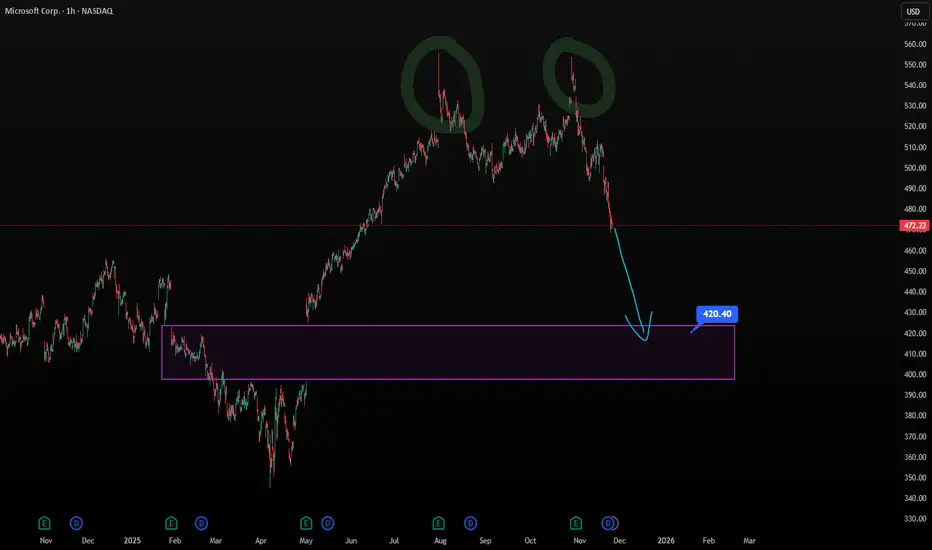
Midterm Stock Forecast for MicrosoftNASDAQ:MSFT appears set for a healthy correction from $472 to $420, consistent with H1 overextension and cooling RSI. Despite powerful fundamentals—Azure growth, AI integration, and strong enterprise demand—the stock is pricing in perfection. A move to $420 would offer a balanced risk-reward area as markets reassess AI monetization timelines.
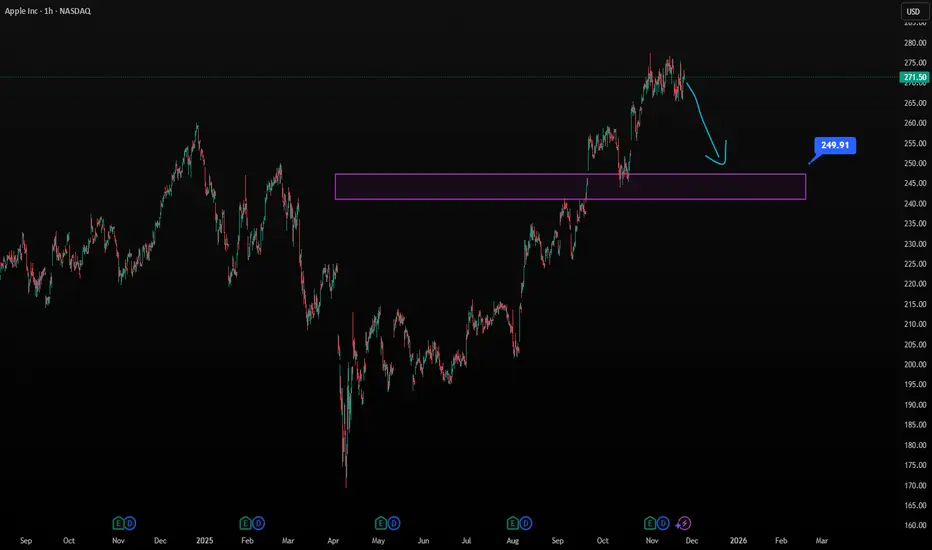
Midterm Stock Forecast for APPLENASDAQ:AAPL 's H1 chart suggests a midterm pullback from $271 toward $250 as trend strength softens. Technically, momentum indicators show divergence after a steady climb. Fundamentally, stable services revenue supports the stock, but softer global device demand may limit upside near term. A correction to $250 would align price with fair-value zones.
Midterm Stock Forecast for NVIDIANASDAQ:NVDA shows weakening momentum after its extended rally, with H1 structure signaling a corrective phase. A drop from $178 toward $150 aligns with cooling AI-driven sentiment and stretched valuation multiples. Fundamentally the long-term demand for GPUs remains strong, but midterm pricing pressure and slowing data-center spending could weigh on sentiment. A retracement to $150 would reset indicators and create a healthier base for long-term buyers.

Global Currency Adventure in the Trade Market1. The Foundation of the Global Currency System
At the heart of global trade lies the exchange of currencies. When a country imports goods, it must purchase the exporter’s currency. Similarly, when firms invest across borders, they need to convert money into the host country’s currency. This constant exchanging gives value to each currency based on supply and demand.
Today’s global currency system operates under floating exchange rates, meaning currencies move freely based on market forces. Unlike the earlier gold-standard era or the post–World War II Bretton Woods system, most currencies now fluctuate day-to-day. This flexibility has increased financial freedom but also created higher volatility—making currency markets more adventurous and risky.
2. Major Players in the Currency Adventure
The global currency journey is shaped by several participants:
Central Banks
Institutions like the Federal Reserve (USA), European Central Bank, Reserve Bank of India, and Bank of Japan influence currency values through interest rate policies, inflation control, and monetary interventions. Their announcements often create dramatic market moves.
Commercial Banks
These banks facilitate currency conversion for businesses, governments, and individuals. Their massive transactions give them significant power in the forex market.
Multinational Corporations
Global companies like Apple, Toyota, and Samsung hedge currency risks because their revenues come from multiple countries. Their transactions often shift supply and demand for specific currencies.
Investors and Traders
Speculators search for profit by predicting currency movements. Their rapid trades increase market liquidity and volatility.
Governments
Policies like trade tariffs, sanctions, or foreign investment regulations can strengthen or weaken a currency.
Together, these players create a vibrant, never-ending cycle of currency flows that keeps the global trade market alive.
3. Currency Value: What Makes It Rise or Fall?
Currency movements are driven by a combination of economic, political, and psychological factors:
a. Interest Rates
Higher interest rates attract foreign investors seeking better returns. This increases currency demand and strengthens it. Lower rates often weaken currencies.
b. Inflation
Low inflation makes a currency more valuable because purchasing power is preserved. High inflation erodes value.
c. Economic Data
GDP growth, unemployment rates, retail sales, manufacturing output, and trade balance reports influence how strong a country’s economy appears—impacting its currency.
d. Political Stability
Countries with stable governments attract investment and boost currency strength. Political uncertainty weakens confidence and triggers currency sell-offs.
e. Global Market Sentiment
Fear or optimism fuels speculative behavior. During global crises, safe-haven currencies like the U.S. dollar, Swiss franc, and Japanese yen strengthen.
Understanding these factors is crucial for navigating the adventure of currency markets.
4. Currency Wars: When Nations Compete to Devalue
A notable chapter in the global currency adventure involves currency wars—situations where nations try to intentionally weaken their own currencies to make exports cheaper. A weaker currency helps domestic industries by increasing their global competitiveness.
However, currency wars can lead to:
Trade tensions
Retaliatory responses
Inflation challenges
Global market instability
Examples include Japan’s attempt to weaken the yen in the 2010s, China’s devaluation strategies, and emerging market interventions to protect exports.
5. Currency and Global Trade: A Symbiotic Relationship
The strength of a currency directly affects trade.
Strong Currency Effects
Imported goods become cheaper
Exports become expensive
Trade deficits may widen
For example, a strong U.S. dollar makes imported electronics cheaper for Americans but makes American agricultural exports costly for foreign buyers.
Weak Currency Effects
Exports become cheaper
Imports become costlier
Domestic industries benefit
Trade surplus may improve
Countries like China have historically benefited from controlled currency management to boost exports.
The balance between export competitiveness and import affordability is a delicate dance that shapes trade policies worldwide.
6. The Technological Revolution in Currency Trading
Advancements in technology have transformed the forex market:
Algorithmic Trading
Computer-driven strategies execute millions of trades within milliseconds. Algorithms detect patterns, news events, and price anomalies faster than humans.
Blockchain and Digital Currencies
Cryptocurrencies like Bitcoin have introduced decentralized finance into global markets. Central banks are also developing CBDCs (Central Bank Digital Currencies) to modernize monetary systems.
AI & Machine Learning
AI predicts price movements, analyzes sentiment, and automates risk management.
These innovations add new layers to the currency adventure, making markets more accessible yet more complex.
7. Currency Hedging: Managing Risks in International Trade
Since currency values fluctuate continuously, businesses face the risk of losing money if rates move unfavorably. To protect themselves, they use:
Forward Contracts – agreements to exchange currencies at a future date at a fixed rate.
Futures Contracts – exchange-traded versions of forward contracts.
Options – the right (but not obligation) to buy or sell at a predetermined rate.
Swaps – exchanging currencies and interest payments over time.
Hedging ensures stable profits and predictable costs, especially for exporters and importers.
8. Currency Crises: When the Adventure Turns Dangerous
History shows that currencies can collapse dramatically:
Asian Financial Crisis (1997)
Argentine Peso Crash (2001)
Russian Ruble Crisis (2014)
Turkish Lira Hyper-Inflation (2018-2022)
These crises often involve:
Excessive foreign debt
Weak economic fundamentals
Political instability
Market panic
When a currency collapses, inflation skyrockets, imports become unaffordable, and economies suffer deep recessions.
9. The Future of Global Currency Adventure
The currency landscape is evolving rapidly. Trends shaping the future include:
Digitalization of Money
CBDCs will modernize cross-border transactions, reduce settlement time, and bring transparency.
De-Dollarization Efforts
Many nations are reducing dependency on the U.S. dollar to avoid geopolitical risks.
Rise of Regional Currency Alliances
Groups like BRICS are exploring unified digital payment systems and currency baskets.
Greater Speculation and Liquidity
With technology connecting global traders 24/7, volatility and opportunities will continue to grow.
Conclusion
The global currency adventure in the trade market is a complex, thrilling journey filled with risk, opportunity, and constant change. Currencies are the heartbeat of global trade; they influence prices, profits, investments, and economic power. As nations develop, technologies advance, and geopolitical dynamics evolve, currency markets will remain one of the most fascinating and essential components of global finance.

Investors, Traders, and Policymakers in the Global Market1. Investors in the Global Market
Investors are individuals or institutions that allocate capital with the expectation of earning returns over time. They play a crucial role in providing long-term funds for companies, governments, and global economic growth.
Types of Investors
Retail Investors – Individuals investing in stocks, bonds, mutual funds, ETFs, or real estate. Their participation has increased globally due to online trading platforms and financial awareness.
Institutional Investors – Large entities such as:
Pension funds
Sovereign wealth funds
Insurance companies
Mutual funds
Hedge funds
Endowments
These investors manage trillions of dollars and have significant influence on asset prices.
Foreign Institutional Investors (FIIs) – Non-local institutions investing in global markets. FIIs affect exchange rates, liquidity, and capital flows.
Angel Investors & Venture Capital Firms – Provide capital to startups, influencing innovation and technological development.
Role of Investors
Capital Formation: Investors provide long-term capital that fuels business expansions, infrastructure projects, and technological advancement.
Market Depth and Liquidity: Institutional investors add liquidity, allowing efficient price discovery.
Risk Distribution: Through diversified portfolios, investors help redistribute economic and financial risks across the market.
Corporate Governance: Large shareholders influence company management and strategic decisions.
Economic Growth: Investments create jobs, improve productivity, and stimulate economies.
Investor Behaviour
Investor decisions are influenced by:
Expected returns
Interest rates
Geopolitical conditions
Macroeconomic indicators (GDP, inflation, fiscal policies)
Corporate earnings
Risk appetite
Long-term investors focus on stability and compounding, while others maximize returns through active asset allocation.
2. Traders in the Global Market
Traders are market participants who seek short-term profits from price movements of financial assets. Unlike investors who focus on long-term value, traders capitalize on volatility and momentum.
Types of Traders
Day Traders – Open and close trades within the same day.
Swing Traders – Hold positions for days to weeks based on trend patterns.
Scalpers – Execute dozens or hundreds of trades daily for small price differences.
Algorithmic & High-Frequency Traders – Use automated systems to trade large volumes within milliseconds.
Prop Traders – Trade using a firm’s capital to generate profits.
Arbitrage Traders – Exploit price differences between markets or assets.
Role of Traders
Providing Liquidity: Traders keep markets fluid, enabling buyers and sellers to transact easily.
Efficient Pricing: They quickly incorporate new information into asset prices.
Market Discipline: Through speculation and short selling, traders expose weak companies and overpriced assets.
Market Support During Volatility: During high volatility, traders provide counter-orders that reduce extreme price swings.
Tools Traders Use
Technical analysis (charts, indicators, patterns)
Fundamental analysis (earnings, news, macro data)
Algo-trading systems
Options, futures, commodities, currencies, crypto
Global market correlations (oil, gold, dollar index, bond yields)
Behavioural Aspects of Traders
High risk tolerance
Dependence on market psychology
Quick decision-making
Emphasis on timing rather than long-term value
Traders thrive on volatility; hence global uncertainties often create profitable opportunities.
3. Policymakers in the Global Market
Policymakers include governments, central banks, regulatory bodies, and international economic institutions. Their decisions shape the macroeconomic environment and influence market behaviour worldwide.
Key Policymakers
Central Banks – Such as the Federal Reserve (US), ECB (Eurozone), RBI (India), Bank of Japan, etc.
Government Fiscal Authorities – Ministries of finance, treasury departments.
Market Regulators – SEBI (India), SEC (USA), FCA (UK).
International Institutions – IMF, World Bank, BIS, WTO, OECD.
Trade and Commerce Departments – Regulate tariffs, quotas, and trade agreements.
Major Roles of Policymakers
Monetary Policy: Managing interest rates, money supply, and inflation.
Fiscal Policy: Government spending, taxation, incentives, or austerity measures.
Financial Regulation: Ensuring market transparency, stability, and investor protection.
Currency Management: Adjusting exchange rate policies to support trade competitiveness.
Crisis Management: Responding to recessions, banking failures, or market crashes.
Trade Policies: Deciding tariffs, sanctions, treaties, and economic partnerships.
Impact of Policymakers on Global Markets
Interest Rate Decisions: Affect borrowing costs, investment activity, and global capital flows.
Inflation Control: Rising inflation leads to tight monetary policy and volatility.
Geopolitical Policies: Sanctions, wars, and trade agreements influence commodities, currencies, and stock markets.
Regulatory Changes: New rules can attract or restrict investment.
Stimulus Packages: Boost consumption and liquidity during downturns.
Policymakers set the environment within which investors and traders operate.
4. Interactions Between Investors, Traders, and Policymakers
The global market functions through dynamic interactions among these three groups.
How Policymakers Influence Investors
Lower interest rates make equities and riskier assets attractive.
Fiscal stimulus boosts corporate earnings prospects.
Regulatory stability attracts long-term capital.
How Policymakers Influence Traders
Economic data releases (CPI, GDP, employment numbers) trigger high volatility.
Monetary policy decisions create price movements that traders profit from.
Unexpected announcements (rate hikes, sanctions) cause sharp market reactions.
How Investors Influence Policymakers
Large institutional investors can lobby governments for favorable tax laws or policies.
How Traders Influence Markets
Heavy trading can increase liquidity and drive short-term price trends, which investors may consider in their decisions.
Conclusion
Investors, traders, and policymakers form the backbone of the global financial system. Investors provide essential long-term capital and stability, traders add liquidity and efficiency through rapid transactions, and policymakers create the economic framework and maintain stability. Their combined actions shape global economic growth, determine market cycles, and influence asset prices worldwide. Understanding their roles helps anyone—from beginners to professionals—grasp how the global market operates and how financial decisions ripple across countries and economies.
Nvidia loses steam despite exceptional 3Q performance
Nvidia (NVDA) posted a record-breaking 3Q performance, with revenue surging 62% YoY to 57 bln USD. Its 4Q guidance points to another 65% increase, reinforcing optimism that growth momentum will continue to accelerate. CFO Kress noted that the guidance does not include any contribution from China sales, while CEO Huang pushed back against recent AI-bubble concerns raised by Michael Burry.
Nevertheless, AI valuation risks remain elevated. Beyond strong earnings, the scale of AI infrastructure spending and the surge in bond issuance required to fund it continue to dampen investor sentiment.
Goldman Sachs (GS) has warned about the fragility in the private credit market. The firm highlighted that Blue Owl Capital, with more than 295 bln USD in AUM, over half of which is credit-exposed, has seen its share price fall nearly 30% since Sep. Major credit-heavy players such as KKR and Blackstone are also showing signs of pressure, underscoring how AI-driven anxiety is spilling into private credit.
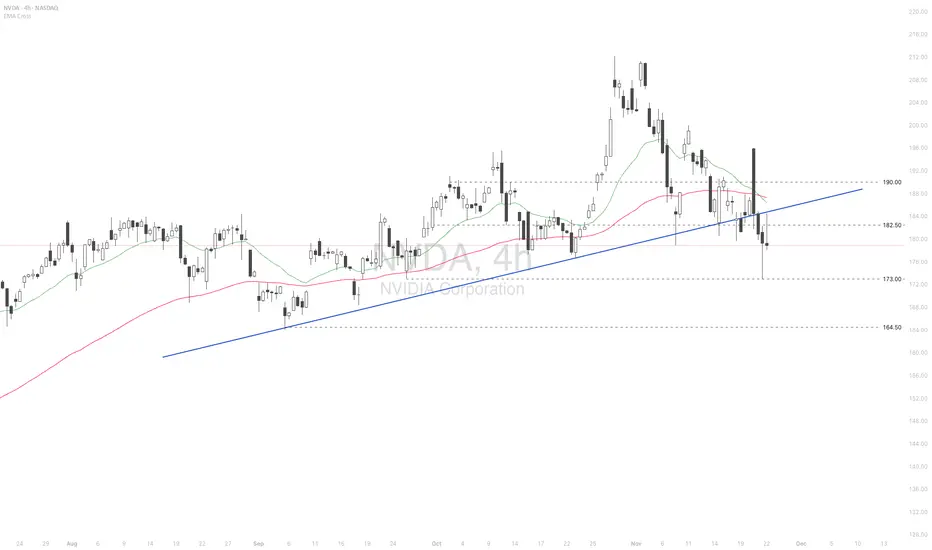
NVDA briefly breached above the psychological level at 195.00 but surrendered all gains, falling back below 182.00. The price remains under the death-crossed EMAs, indicating a potential expansion of the bearish bias.
If NVDA breaks below the support at 173.00, the price could decline further toward the following support at 164.50.
Conversely, if NVDA breaches above the resistance at 182.50 and the ascending trendline, the price may advance toward the subsequent resistance at 190.00.
$ASMLExecutive Summary:
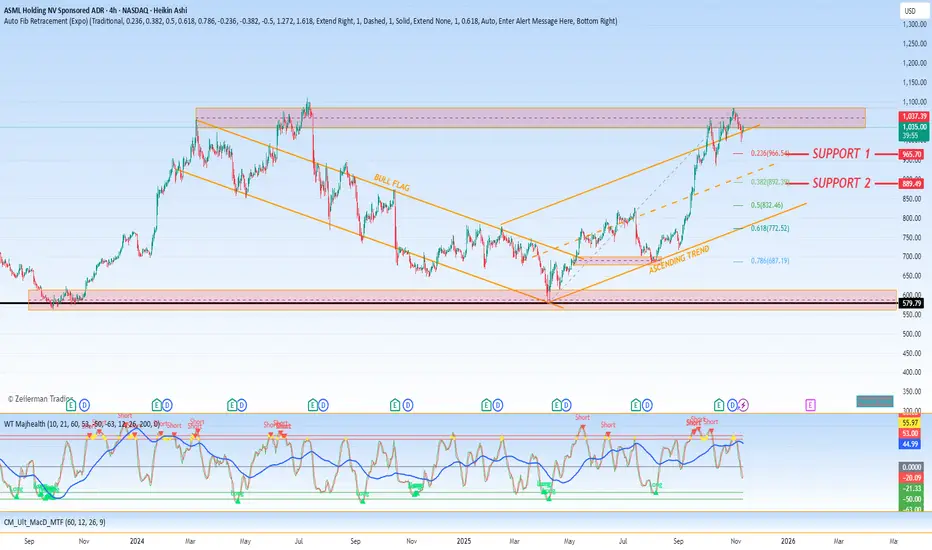
ASML ( NASDAQ:ASML ) is exhibiting a compelling technical picture defined by a period of consolidation within a larger bullish structure. The chart has formed a clear Double Top pattern followed by a Double Bottom, signaling a battle between buyers and sellers that has now resolved to the upside. This sequence, coupled with the recent formation and subsequent breakout from a Bull Flag pattern, indicates a resurgence of bullish momentum. Our analysis confirms a renewed upward trajectory, with key Fibonacci retracement levels at $966.54 and $892.39 established as critical support zones for any future pullbacks.
Detailed Technical Breakdown:
1. Pattern Evolution: From Consolidation to Breakout
The recent price action can be interpreted as a cohesive, multi-stage pattern signaling a healthy consolidation before a continuation of the primary uptrend:
Phase 1: Distribution & Testing (Double Top): The initial formation of a Double Top pattern near the highs represented a period of distribution and failed breakout attempts. This pattern indicated that selling pressure was sufficient to halt the advance at a specific resistance level, leading to a subsequent decline. In this context, it served as the distribution phase within the larger consolidation.
Phase 2: Accumulation & Base-Building (Double Bottom): The decline from the Double Top's neckline found firm support, forming a Double Bottom pattern. This is a classic reversal indicator, demonstrating that buyers were aggressively defending a specific price level and that the selling pressure from the Double Top had been exhausted. This pattern represented the successful test of a major support level and the accumulation phase.
Phase 3: Bull Flag & Momentum Renewal: Following the Double Bottom's confirmation, the price ascended into a Bull Flag pattern—a tight, downward-sloping consolidation characterized by declining volume. This pattern is typically a pause in a strong uptrend, reflecting a brief period of profit-taking before the next leg higher. The recent breakout above the flag's upper boundary signals the conclusion of this consolidation and the resumption of the dominant bullish trend.
2. Hierarchical Support Framework:
In the context of this renewed uptrend, the following Fibonacci retracement levels (derived from the most significant prior upward move) provide a structured roadmap for potential pullbacks, offering strategic entry points:
Primary Support (Shallow Pullback): 23.6% Level at $966.54
A retracement to this level would represent a minimal and healthy withdrawal within a strong trend. A bounce from this zone would signify potent underlying momentum and would be the most bullish of the potential pullback scenarios, suggesting a swift continuation toward higher highs.
Secondary & Major Support (Moderate Correction): 38.2% Level at $892.39
A deeper pullback to the $892.39 level would constitute a more significant test of buyer conviction. This level, known as the "shallow retracement," is a common area for institutional re-entry. While indicating greater near-term weakness than a test of the 23.6% level, a successful hold here would reaffirm the overall bullish structure and present a high-value opportunity for capital allocation.
3. Strategic Outlook and Price Projection:
The confluence of the Double Bottom reversal and the Bull Flag breakout provides a high-confidence bullish signal. The pattern's resolution suggests that the consolidation period has effectively recharged momentum for the next advance.
Implication: The path of least resistance is now firmly to the upside. The breakout from the Bull Flag projects a measured move target that is typically equivalent to the length of the preceding "flagpole," which points to a significant upward projection (a specific target can be calculated by adding the flagpole's height to the breakout point).
Strategy: The tactical approach is to view any pullback as a potential buying opportunity within the larger bullish trend. The identified Fibonacci levels at $966.54 and $892.39 serve as defined zones for strategic entry. A decisive break below the deeper $892 support, however, would necessitate a re-evaluation of the immediate bullish thesis, suggesting a broader correction may be underway.
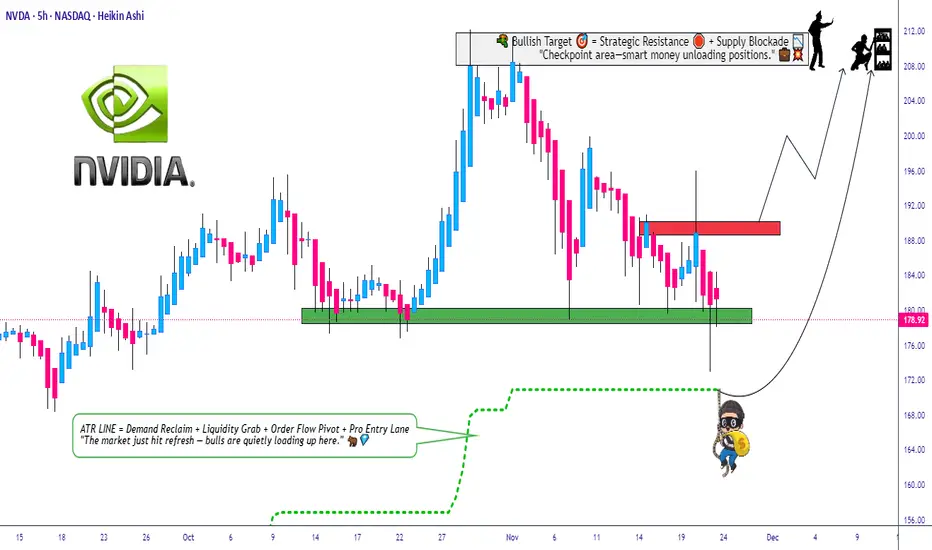
Can NVDA Hold the Pullback Zone and Extend the Uptrend?🔥 NVDA Bullish Pullback Playbook – Thief-Style Swing Setup 🚀🕵️♂️
Hey traders & my fellow Thief OG’s 😎🕶️ — here’s a clean, polished, TradingView-friendly version of my NVDA Swing Trade Playbook with a professional + funny touch. Let’s get to the setup 👇🔥
📌 Asset
NVDA – NVIDIA Corporation (NASDAQ)
Swing Trade | Momentum | Trend-Following Setup
📈 Plan: Bullish Pullback Strategy (Pending Orders Active)
The trend is strong, the buyers are steady, and NVDA is still delivering clean higher-lows. We're waiting for either a breakout continuation or a discounted pullback entry. 📊⚡
🎯 Entry Zones
1️⃣ Breakout Entry – Momentum Thief Mode 🥷⚡
Enter after clearing the nearest resistance at $191.00
• Clean breakout
• Volume confirmation
• Trend continuation strength
2️⃣ Pullback Entry – SuperTrend ATR Sniper Entry 🎯📉
Watch for a discounted pullback near $170.00 around the SuperTrend ATR zone.
• Trend support retest
• Lower-risk entry
• Ideal for swing traders who wait for “patience-pays entries” 😎
🛡️ Stop-Loss (Thief Style – Risk First)
Breakout Entry SL → $180.00
SuperTrend Pullback SL → $160.00
Note: Dear Ladies & Gentlemen (Thief OG’s) ❤️
I’m NOT recommending you use only my SL. Choose your own levels — you make the money, you protect the money. Trade at your own risk 🔐⚠️
🎯 Target (Take-Profit Zone)
Our target → $210.00
Why?
• Strong resistance zone
• Overbought region historically
• Buyer trap zone where police force 🚔👮♂️ usually waits — so escape with profits early 😂💨
Note: Dear Ladies & Gentlemen (Thief OG’s) 🙌
I’m NOT recommending you set my TP only. Choose your own TP — your money, your exit. Trade with responsibility 💼💰
🔍 Related Pairs to Watch (Correlation Insights + Key Notes)
NASDAQ:AMD
• High positive correlation with NVDA
• When AMD shows volume expansion, NVDA often follows
• Good for momentum confirmation 🔥
NASDAQ:SOXX (iShares Semiconductor ETF)
• NVDA is a major weighted component
• ETF direction confirms big-money flow 🧠💸
• Great for spotting sector-wide risk-on / risk-off shifts
NASDAQ:QQQ (NASDAQ 100 ETF)
• NVDA is one of the heaviest weights
• If QQQ trends strongly → NVDA often mirrors
• Macro sentiment index for tech strength 📊⚡
NASDAQ:SMH (VanEck Semiconductor ETF)
• Clean supply/demand signals
• NVDA mirrors SMH breakouts frequently
• Helps confirm breakout validity before taking the trade
All these help you avoid fakeouts and align with overall semiconductor market strength.
✨ “If you find value in my analysis, a 👍 and 🚀 boost is much appreciated — it helps me share more setups with the community!”
⚠️ This is a thief-style trading strategy created just for fun. Trade responsibly.
ROBINHOOD HOOD Bearish Playbook — Thief on Duty!📉 ROBINHOOD MARKETS INC. (HOOD) — Bearish Profit Playbook
🔥 Swing / Day-Trade Thesis with Thief Layer Strategy
🧭 Market Context & Core Idea
The bearish outlook is confirmed after HULL Moving Average shows a downside breakout, signaling momentum shifting toward sellers. This forms the backbone of today’s playbook 📉⚔️.
The setup focuses on a layered entry (Thief Strategy) — a structured way of placing multiple limit orders at different price levels to average into premium zones with precision.
🎯 Plan: Bearish Setup with Thief-Style Layered Execution
This plan uses multiple SELL LIMIT layers, allowing flexibility and better control across volatility zones:
🔻 Layered Entry Zones (Sell Limit Layers)
125.00
120.00
115.00
110.00
(You may increase the number of layers based on your own approach — thief style is flexible.) 😎🧤
🛑 Stop-Loss (Thief SL)
SL @ 130.00
⚠️ Dear Ladies & Gentlemen (Thief OGs), this SL is not a recommendation — adjust your stop according to your own risk appetite. You make the money, you take it at your own risk.
🏁 Target Zone
The Moving Average is acting as strong support, and current structure suggests oversold conditions + a possible bullish trap scenario.
🎯 Target @ 92.00
⚠️ Dear Ladies & Gentlemen (Thief OGs), this TP is not fixed — targets must match your personal risk-to-reward logic. Manage wisely.
📊 Why This Setup Works (Key Technical Notes)
✨ HULL Moving Average breakout confirms bearish flow
✨ Multi-layer entries help capture stretched price spikes
✨ Oversold conditions hint at potential profit-taking zones
✨ Support zones + price traps increase snap-back volatility
✨ Ideal for swing/day-traders who prefer structured scaling
🔍 Related Pairs to Watch (Correlation Radar)
Tracking correlated or sentiment-linked assets helps understand broader flows:
🧩 Tech / Growth Sentiment Links:
NASDAQ:QQQ — reflects overall high-beta sentiment & liquidity
CBOE:ARKK — tracks innovation/growth appetite
NASDAQ:COIN — crypto-linked sentiment often spills into HOOD
NYSE:XYZ — fintech risk appetite correlation
NASDAQ:SOFI — retail-driven growth behavior overlaps with HOOD
🧲 Key Takeaways:
When growth ETFs weaken, HOOD typically accelerates momentum
Retail-heavy assets show higher reaction to volatility spikes
Watching these helps confirm whether HOOD’s breakdown has strength
✨ “If you find value in my analysis, a 👍 and 🚀 boost is much appreciated — it helps me share more setups with the community!”
Disclaimer: This is a thief-style trading strategy just for fun.

COIN Short Trade Setup — Smart Entry Levels Revealed!🎯 COIN "The Crypto Exchange Heist" 💰
Stock Market Profit Playbook for Swing & Day Traders
📈 Analysis Overview 🔍
Asset: NASDAQ:COIN | Coinbase Global Inc. ⚡
Current Price: $295.22 (Nov 7, 2025) 💵
Market Cap: $79.60B 🏆
Trading Volume: Bullish liquidity ✅
Technical Bias: BEARISH CONFIRMED ⬇️
🎲 The Setup: Bearish Hull Moving Average Breakout
We've identified a critical bearish breakdown pattern with Hull Moving Average (HMA) confirmation. The rejection from the $350 resistance zone combined with oversold conditions creates the perfect "HEIST" opportunity for disciplined traders.
Key Technical Signals 🚨:
✅ Hull MA showing downtrend confirmation
✅ Price rejection from upper resistance
✅ Volume compression into breakdown
✅ RSI divergence in overbought territory
✅ Support trap formation at key levels
🎪 ENTRY STRATEGY: The "Layering Heist" Technique 💎
Method: Multiple Limit Order Layers (Position Stacking Strategy)
Instead of chasing ONE entry, we deploy the Thief OG Layering System — multiple entry levels to average down as the bearish thesis develops:
📍 Entry Layers (Top to Bottom):
Layer 1: $340.00 💎
Layer 2: $330.00 💎
Layer 3: $320.00 💎
Layer 4: $310.00 💎
Pro Tip: Feel free to add MORE layers based on your risk tolerance and account size! The more precise your layers, the better your average entry price. 🎯
🛑 Stop Loss Placement (Risk Management Critical)
Thief OG's Recommended SL: $350.00 🚫
This sits above the rejection zone — if price reclaims $350+, the bearish thesis is invalidated, and we exit.
⚠️ DISCLAIMER: This is YOUR trade. We recommend this SL, but YOU control your risk. Adjust based on your position size and risk appetite. No feelings — just math! 📊
🎁 PROFIT TARGET (The "Escape Plan")
Primary Target: $240.00 🎯
Target Type: Strong Support + Oversold Zone + Trap Confirmation
Why $240?
Historical support confluence 📍
RSI reaching oversold extremes 📉
Previous institutional accumulation zone 🏦
Fibonacci 0.618 retracement level ✨
⚠️ CRITICAL NOTE: This is YOUR profit target decision. Once you're in profit, TAKE YOUR MONEY — don't be greedy! Secure gains at comfortable levels. Risk management > Ego. 💪
📊 Correlation Pairs to Watch 🔗
Keep an eye on these related assets for confluence signals:
Bitcoin (BTC)
Price Action: CRYPTOCAP:BTC is COIN's strongest correlation driver
Why?: Crypto market sentiment flows through BTC first → COIN follows
Watch For: BTC breaking $100K could trigger COIN capitulation 📉
Ethereum (ETH) 💠
Price Action: CRYPTOCAP:ETH directional bias impacts institutional flows
Why?: ETH derivative volume is massive on COIN's platform
Watch For: ETH breaking below $3,500 = bearish acceleration ⬇️
Nasdaq 100 (QQQ) 📈
Price Action: NASDAQ:QQQ tech sector health matters
Why?: COIN correlates with tech rallies & risk-off dumps
Watch For: QQQ support breaks = COIN weakness confirmed 🔴
Fear & Greed Index 😨😊
Watch: Extreme Greed (75+) = Potential top | Extreme Fear (25-) = Potential bottom
Why?: COIN is highly sentiment-driven
Action: Lower entries during Fear zones for better risk/reward 🎰
📋 Trade Checklist Before You Enter ✅
Confirm HMA bearish alignment on your timeframe
Check BTC & ETH correlation for confluence
Position size = Max 2-3% portfolio risk per trade
Set alerts at each layer level
NEVER move SL in the red (that's a LOSS, not protection)
Secure profits on the way up (don't wait for PT)
Journal every trade (you learn more from losses)
💡 Pro Trading Tips 🧠
Size Down in Uncertainty — If volume is low, position smaller
Trail Your SL — Once profit doubles, move SL to breakeven
Partial Profits — Take 50% at $280, let the rest run to $240
Never Average-Up — Only add on confirmations going DOWN
Time Your Layers — Don't slam all orders at once; space them out
📢 Join The Community 🚀
✨ If you find value in my analysis, a 👍 and 🚀 boost is much appreciated — it helps me share more setups with the community!
#COIN #Coinbase #CryptoTrading #SwingTrade #DayTrade #TechnicalAnalysis #BearishSetup #TradingStrategy #CryptoExchange #NASDAQ #HullMovingAverage #TradingIdeas #CryptoMarkets #RiskManagement #ProfitPlaybook #ThiefStrategy #EditorPick 🚀✨

PayPal Under Pressure! Bearish WMA Break Signals Downside🎯 PYPL: The "Weighted MA Breakout Heist" 💰 | Bears Taking Control
📊 Asset Overview
PayPal Holdings Inc. (NASDAQ:PYPL) - Digital payments heavyweight showing bearish signals after weighted moving average breakdown.
🔍 The Setup: When Moving Averages Tell Tales
The chart's singing a bearish tune, folks! 🎵 We've got a Weighted Moving Average breakout to the downside — and when WMA breaks, it usually doesn't ask for permission to keep falling. Think of it like gravity... but for stock prices! 📉
💡 Trade Blueprint
🚪 Entry Zone
Flexible entry approach - Current market price works as entry. The beauty of this setup? The trend is your friend, so catching this wave at various levels could work. Just don't chase it blindly!
💭 Pro Tip: Scale in rather than going all-in at once. Dollar-cost averaging on the way down can be your best friend in bearish plays.
🛡️ Risk Management (The "Safety Net" Level)
Stop Loss: $68.00 🚨
Look, I'm calling this the "thief SL" because if price touches this level, you need to exit stage left — no questions asked! This isn't financial advice, just a technical level where the bearish thesis breaks down.
⚠️ Important: Set YOUR OWN stop loss based on your risk tolerance and account size. This is just a technical reference point, not a commandment carved in stone!
🎯 Profit Target (The "Escape Route")
Target: $60.00 💵
Why $60? Three compelling reasons:
📍 Moving Average Support Zone - Historical MA convergence area
📉 Oversold Territory - RSI/momentum indicators suggest potential bounce zone
Liquidity Trap Alert - Big money often parks orders here
⚠️ Reality Check: Markets don't move in straight lines. Take profits along the way! Suggested approach: Scale out 30% at $63, another 40% at $61.50, and let the final 30% ride to $60.
🔗 Related Pairs to Watch (Correlation Play)
Keep your eyes on these tickers — they often move in sympathy with PYPL:
SET:SQ (Block Inc.) - Fellow fintech, similar payment space dynamics 🔄
$V (Visa) - Traditional payment processor, inverse correlation during fintech weakness 💳
NYSE:MA (Mastercard) - Same logic as Visa, watch for divergence 🏦
NASDAQ:COIN (Coinbase) - Crypto exposure correlation with digital payment sentiment 🪙
NASDAQ:SHOP (Shopify) - E-commerce correlation, PYPL's merchant base overlap 🛒
Key Correlation Note: When fintech stocks sell off, traditional payment processors often see inflows. Watch the $V and NYSE:MA strength as potential confirmation of PYPL weakness!
📈 Technical Highlights
✅ Weighted Moving Average breakdown confirmed
✅ Volume supporting the bearish move
✅ Lower highs and lower lows pattern forming
✅ Key support zones identified below
✅ Risk-reward ratio favors the short side
⚡ The "Thief Style" Philosophy
This isn't about being greedy — it's about being strategic! 🎭 We identify the setup, execute with precision, and exit with profits before the crowd realizes what happened. That's the art of tactical trading!
Remember: The market doesn't care about your opinion. Price action is king 👑
✨ If you find value in my analysis, a 👍 and 🚀 boost is much appreciated — it helps me share more setups with the community!
#PYPL #PayPal #DayTrading #BearishSetup #TechnicalAnalysis #MovingAverageBreakout #SwingTrading #StockMarket #TradingView #ThiefStyle #PriceAction #RiskManagement #Fintech #NASDAQ #ShortSetup #TradingStrategy #ChartAnalysis #MarketAnalysis #TradingIdeas #StockTrading

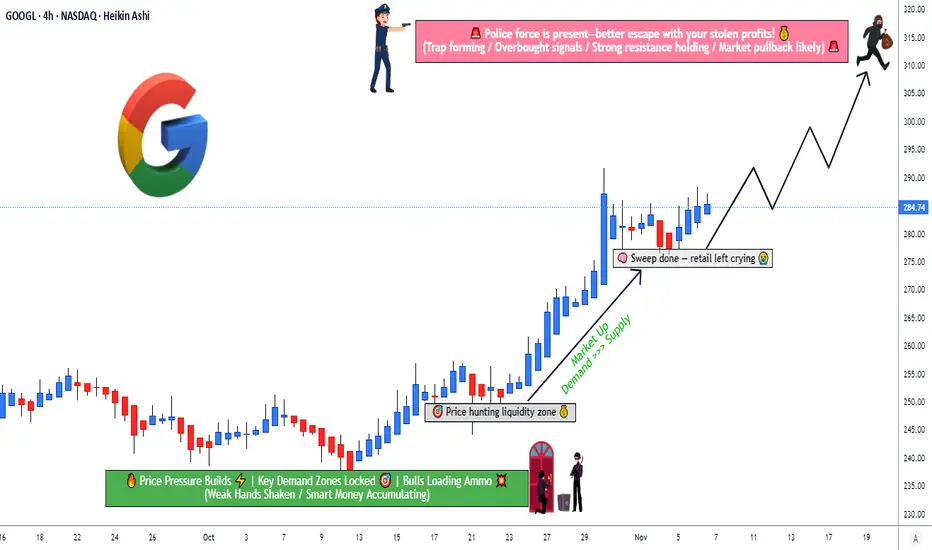
Can GOOGL Sustain Its Bullish Run Before 320 Resistance Hits?🎯 GOOGL HEIST: Operation Alphabet Escape Plan 💰
Alphabet Inc. (NASDAQ) - Swing Trade | Multi-Layer Entry Strategy
📊 THE SETUP
Sentiment: 🟢 BULLISH | Timeframe: Swing Trade | Risk Level: Medium
🎲 ENTRY STRATEGY: "THIEF LAYERING"
Strategic multi-level buy accumulation using limit orders
Layer-by-Layer Approach:
🔵 Layer 1: $270.00 (Initial entry - 30% position)
🔵 Layer 2: $275.00 (Support zone - 35% position)
🔵 Layer 3: $280.00 (Strength builder - 35% position)
Why This Works? Multiple entries reduce average cost basis and allow maximum capital efficiency. If price rejects higher, you've got fills at lower zones. If it pumps, you're already in! 💡
🛑 STOP LOSS PROTECTION
Hard Stop: 🚨 $265.00 (Below support structure)
This represents a 1.9% risk from Layer 1 entry — disciplined risk management at its finest.
⚠️ Risk Acknowledgment: Your stop loss, your rules. We're traders, not financial advisors. Adjust based on YOUR risk tolerance and account size. This is educational strategy sharing, not personalized financial advice.
🎖️ PROFIT TARGETS & ESCAPE ROUTES
Primary Target: 📈 $310.00
Strong resistance zone forming
Overbought conditions developing
Action: Take 50-60% profits here
Secondary Target: 🏆 $320.00
Police barricade zone (extreme resistance)
High trap probability at this level
Action: Scale out remaining 40-50% OR tighten stops to breakeven
Exit Philosophy: Greed kills traders. Take profits systematically. The best trade is one where you sleep well at night. 😴
⚠️ Profit Note: Your targets, your timing. Scale exits based on market conditions, volume confirmation, and YOUR comfort level.
🔗 RELATED PAIRS TO MONITOR (Correlation Watch)
🔵 NASDAQ:MSFT 📱 — High Correlation (Tech Sector) | If MSFT breaks down, GOOGL faces sector headwinds. Watch for divergence signals here first.
🔵 NASDAQ:QQQ 🔺 — 0.85+ Correlation (Nasdaq-100) | QQQ weakness = potential GOOGL pullback signal. This is your sector health check before entry.
🔵 AMEX:IWM 📊 — Inverse Correlation (Rotation Risk) | Russell 2000 strength = growth money leaving mega-caps. If small-caps pump, tech might cool off.
🔵 NASDAQ:TLT 💳 — Interest Rate Proxy | Rising bonds = tech pressure; falling bonds = tech friendly. Fed policy flows directly through here.
🔵 TVC:VIX 😰 — Volatility Index | VIX spike = risk-off, potential GOOGL liquidation. Above 20 = reduce position exposure.
Key Insight: Watch QQQ and MSFT first. They're your canary in the coal mine. If sector is weak, reconsider your entry conviction. 🚨
💎 STRATEGY SUMMARY
✅ Bullish bias with disciplined multi-entry accumulation
✅ Defined risk with hard stop at $265
✅ Staged profit-taking to lock gains systematically
✅ Correlation awareness prevents surprise sector rotations
🎬 FINAL THOUGHTS
Remember: This is the Thief Strategy™ — a fun, educational framework for swing trading, NOT financial advice. Trade at your own risk. Position sizing, stop losses, and profit targets should reflect YOUR unique situation, risk tolerance, and account size.
The heist only works if you ESCAPE with profits. Don't get caught holding the bag! 💼🚪
✨ If you find value in my analysis, a 👍 and 🚀 boost is much appreciated — it helps me share more setups with the community!
#GOOGL #AlphabetInc #SwingTrade #TechAnalysis #TradingStrategy #NASDAQ #TradingIdeas #MultiLayers #RiskManagement #Bullish #ThiefStrategy #TradingCommunity #TradingView #Technical #StockMarket
HOOD to $31Not in a straight line, but the general rule for a broken parabolic advance is an 80% decline

META: Daily Oversold, Weekly Vulnerable — Key Levels to WatchBull Case:
META is testing a long-term ascending trendline and a major demand zone between $579–$595. Daily RSI is oversold, suggesting a potential short-term reversal. If buyers defend this level, key upside pivots sit at $635, followed by $676–684, and a full mean-reversion target near $691. The broader uptrend remains intact as long as the stock holds above $562.
Bear Case:
While the daily chart is positioned for a bounce, the weekly structure is still weakening. META has lost multiple EMAs on the weekly timeframe, momentum remains bearish, and weekly RSI has broken its bull range. A breakdown below $579 opens downside continuation toward $562 and $548, with deeper support near the mid-$400s if selling pressure accelerates.
Summary:
The daily chart shows potential for a near-term rebound, but the weekly trend still favors caution. A sustained close back above $635 strengthens the bullish scenario, while a failure to hold $579 shifts control firmly to the bears.
Key Levels to Watch
Bullish Levels
$595 / $579 — must hold (trendline + demand)
$635 — first resistance / short-term trend flip
$676–$684 — major supply zone
$691 — full mean-reversion target
Bearish Levels
$579 — breakdown trigger
$562 — next liquidity zone
$548 — deeper support
$480s — weekly structural support if selling accelerates
How the Stock Is Leaning:-
Short-term (daily): Leaning bullish for a bounce — oversold, testing major support.
Medium-term (weekly): Leaning bearish — trend damaged, EMAs rolling over, RSI in a downtrend.
Overall: Two-timeframe divergence. Daily wants a reversal, weekly still argues for lower levels unless $635 is reclaimed.

Strongest Technical Chart - MagneraMagnera Corporation was flashing in my screener list and upon further digging, their technical charts seem exceedingly strong.
1. On a monthly time frame, it seems to have completed its ABC correction at around 9$ mark
2. Stock was making ending diagonal pattern on monthly since Jan 2023
3. Volumes have been increasing significatly for last 12 months with prices moving sideways, talking about 4-10x increase in volumes - depicting institutional accumulation
4. Multiple indicators of MACD, RSI, MOM, Chaikin money flow are showing strong divergences on monthly/weekly/daily time frames
5. Demark indicators are flashing strong buy
CMP price 11.59, target 50. Set for a multi month massive bull run.

Short Play Incoming? Airbnb’s Bearish Pullback Unfolds🎯 AIRBNB ( NASDAQ:ABNB ) - The Triangular Pullback Heist 🏠💰
Asset: NASDAQ:ABNB | Airbnb Inc.
Trade Type: Swing/Day Trade | Bearish Setup ⚡
Strategy: Thief's Layered Entry System 🎭
📊 THE SETUP
Bears are throwing a house party 🐻🎉 and ABNB just got the invitation! We're seeing a triangular pullback pattern forming, which is basically the market's way of saying "hold my beer" before dropping.
Current Status: Bearish momentum confirmed ✅
Pattern: Triangular Moving Average Pullback
Bias: Short 📉
💎 THE THIEF'S LAYERED ENTRY PLAN
Instead of going all-in like a casino gambler, we're using the Thief Strategy - multiple limit sell orders (layering method) to build our position like a professional bank robber planning multiple escape routes:
Entry Zones (Pick Your Poison 🎯):
Layer 1: $127.00
Layer 2: $126.00
Layer 3: $125.00
Note: You can add more layers based on your risk appetite and account size. Scale in, don't dive in! 🏊♂️
🛡️ RISK MANAGEMENT (Save Yourself First!)
Stop Loss: $128.00
⚠️ CRITICAL DISCLAIMER: Dear Thief OG's 👋 - This is MY stop loss based on MY analysis and MY risk tolerance. You're the captain of your own ship 🚢. Set your SL based on YOUR account size, risk management rules, and pain threshold. If you can't handle the heat, don't jump in the kitchen! 🔥
🎯 TARGET ZONE (Where We Cash Out!)
Primary Target: $112.00
Why this target? 🤔
Strong historical support zone 💪
Oversold conditions expected 📊
Bull trap territory (where longs get rekt) ⚡
⚠️ PROFIT-TAKING DISCLAIMER: Again, Thief OG's - this is just MY target. You do YOU! Take profits when you're comfortable. Nobody ever went broke taking profits. Scale out, secure the bag, and live to trade another day! 💰✨
🔍 RELATED PAIRS TO WATCH (The Correlation Game)
Keep your eyes on these correlated assets:
🏨 Travel & Hospitality Sector:
NASDAQ:BKNG (Booking Holdings) - Big daddy of online travel
NASDAQ:EXPE (Expedia) - Direct competitor vibes
NASDAQ:MAR (Marriott) - Traditional hotel exposure
📊 Why Watch These?
When ABNB sneezes, these stocks catch a cold. If you see weakness across the travel sector, it confirms our bearish thesis. Sector rotation is REAL! 🌊
💵 Macro Correlation:
Watch AMEX:SPY / NASDAQ:QQQ - Tech weakness = ABNB weakness
TVC:DXY (Dollar Index) - Strong dollar = weaker travel stocks
🧠 KEY TECHNICAL POINTS
✅ Triangular pattern breakdown in progress
✅ Moving average convergence showing bearish crossover
✅ Volume profile suggests selling pressure building
✅ Risk/Reward ratio: ~1:13 (Not financial advice, just math!) 🧮
✅ Price action respecting the layered entry zones
⚡ FINAL WORDS FROM THE THIEF
This setup is clean, the risk is defined, and the reward potential is juicy 🍊. But remember - trading is a marathon, not a sprint. Protect your capital first, make money second.
Position sizing matters! Don't bet the farm on ONE trade. That's how accounts go to zero and dreams get crushed. Trade smart, not hard! 🧠💪
📢 COMMUNITY LOVE
✨ If you find value in my analysis, a 👍 and 🚀 boost is much appreciated — it helps me share more setups with the community! ✨
#ABNB #Airbnb #BearishSetup #SwingTrading #DayTrading #ShortSetup #ThiefStrategy #LayeredEntry #TechnicalAnalysis #StockMarket #TradingIdeas #PriceAction #RiskManagement #TravelStocks #NASDAQ #TradingView #ForexTrading #StockTrading
Keep it thief, keep it real, keep it profitable! 🎯💰

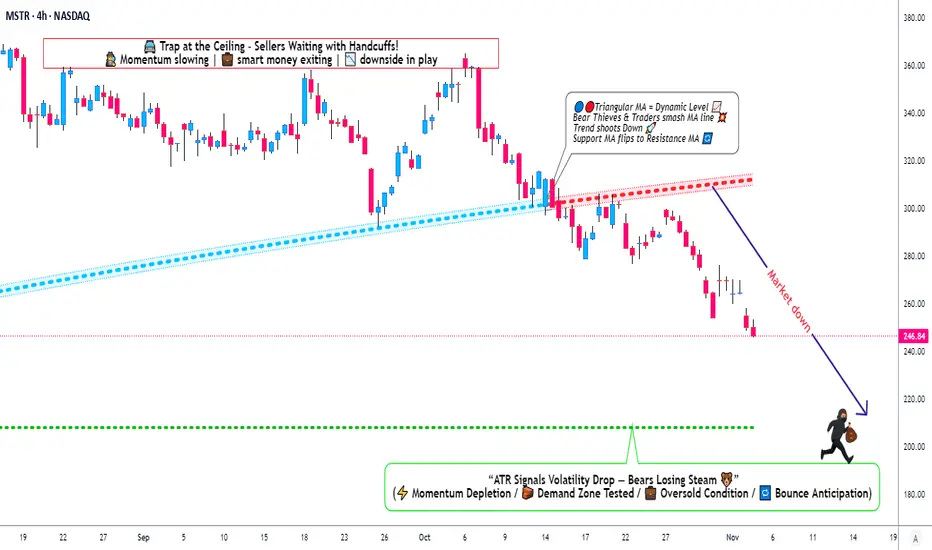
MicroStrategy Under Pressure: Bearish Playbook in Action🎯 MSTR: The "Thief's Playbook" - Strategic Bear Trap Setup! 💰🔥
📊 Asset Overview
MicroStrategy Inc. (MSTR) - Bitcoin's Proxy Play in the Stock Market
🎭 The Setup: When Bears Come to Party
Alright folks, gather 'round! We've got ourselves a textbook triangular moving average breakdown on MSTR that's screaming "short opportunity" louder than my portfolio after a bad trade week! 😅
Current Market Sentiment: 🐻 BEARISH CONFIRMED
The technicals are aligning like planets before a lunar eclipse - and trust me, this eclipse might cast some shadows on those long positions!
🎯 The "Thief Strategy" Game Plan
🚪 Entry Zones - The Layering Approach
Here's where it gets spicy! 🌶️ Instead of going all-in like a degen at a casino, we're using the "Thief Layering Method" - multiple limit sell orders to scale into this position:
Suggested Entry Layers:
🥇 Layer 1: $300
🥈 Layer 2: $290
🥉 Layer 3: $280
💎 Layer 4: $270
🔥 Layer 5: $260
Pro Tip: You can add MORE layers based on your risk appetite and account size. More layers = Better average entry = Smoother sleep at night! 😴
🛡️ Risk Management - The "Oh Sh*t" Line
Stop Loss: 🚨 $320
⚠️ IMPORTANT NOTICE: Dear Thief OGs, Ladies & Gentlemen! This SL is MY line in the sand. YOU need to decide YOUR own risk tolerance. Trade at your own risk, manage your own money, and don't blame me if things go sideways! This ain't financial advice - it's entertainment with charts! 🎪
🎁 Target Zone - Where We Cash Out
Take Profit Target: 🎯 $210
Why $210?
💪 Strong historical support level
📉 Oversold territory expected
Classic bull trap zone where longs get liquidated
⚠️ ANOTHER IMPORTANT NOTICE: Thief OGs! This is MY target. You do YOU! If you see profits earlier and want to secure the bag - DO IT! Don't be greedy. Take profits when YOU feel comfortable. Your account, your rules, your responsibility! 💼
🔗 Related Assets to Watch - The Correlation Game
Keep your eyes on these bad boys for confirmation:
📈 Direct Correlations:
NASDAQ:MARA (Marathon Digital) - Bitcoin miner, moves with crypto sentiment
NASDAQ:RIOT (Riot Platforms) - Another BTC miner, similar volatility pattern
NASDAQ:COIN (Coinbase) - Crypto exchange, sentiment indicator
CRYPTOCAP:BTC (Bitcoin spot) - The godfather! MSTR holds massive BTC, direct correlation
🧠 Key Points:
MSTR trades with ~1.5x-2x Bitcoin beta (more volatile than BTC itself)
When Bitcoin dumps, MSTR often dumps HARDER 📉
Watch BTC support at $60K - if it breaks, MSTR likely follows to our target zone
Tech sector weakness ( NASDAQ:QQQ , AMEX:SPY ) adds bearish pressure
⚡ Trading Psychology - The "Thief Mindset"
Look, this setup requires PATIENCE! 🧘♂️ Don't FOMO in at market price. Layer in like a professional thief planning a heist - calculated, methodical, strategic! This isn't gambling; it's probability management with a side of humor! 😎
🎪 Final Word from Your Friendly Neighborhood Chart Thief
Remember: Markets are wild, unpredictable, and don't care about your feelings OR your bills! This analysis is for educational and entertainment purposes ONLY. The "Thief Strategy" is MY trading style - it's risky, it's aggressive, and it's definitely NOT for everyone!
Do your own research. Manage your own risk. Trade what you can afford to lose. And for the love of all that's holy, don't mortgage your house based on some random internet chart analysis! 🏠❌
✨ If you find value in my analysis, a 👍 and 🚀 boost is much appreciated — it helps me share more setups with the community!
🏷️ #MSTR #MicroStrategy #ShortSetup #BearishBreakdown #SwingTrade #DayTrade #ThiefStrategy #BitcoinStocks #TechnicalAnalysis #MovingAverageCrossover #LayeringStrategy #RiskManagement #StockMarket #TradingIdeas #BTC #CryptoStocks #BearTrap #SupportAndResistance #ChartAnalysis #TradeSmart
🎯 Trade smart, layer in, manage risk, and may the profits be ever in your favor! 💰🚀
Let’s keep an eye on Lululemon (LULU)Let’s keep an eye on Lululemon (LULU).
The stock has been holding this level for a while, and it may offer a good buy opportunity if momentum confirms. Because the chart is still in a weak zone, the safest approach is to enter with a small stop loss to protect downside.
If the stock holds this support and starts pushing up, we could see a solid short-term bounce.

JNJ Price Target Summary (This Week)
Johnson & Johnson (JNJ) is currently trading around $204.
Analyst consensus price targets for the next 12 months are mostly in the $200–$207 range, with the highest targets around $230, but these are long-term estimates — not short-term.
A move to $228 this week is unlikely, as JNJ is a large, stable stock and there is no major catalyst expected that could push the price up ~12% in a few days.
In the short term, JNJ is more likely to trade sideways or see modest gains, unless unexpected positive news or strong sector momentum appears
