The Falling Apple: Apple’s Descent Into the 2026 Bear CycleApple has arrived at a rare point where Natural Law and fundamentals speak in unison.
The geometry of its long-term cycle and the internal condition of its business now deliver the same message: the arc that carried Apple through its 2020–2025 ascent has reached its structural boundary.
This is the moment where the cycle turns — the moment the Apple begins to fall.
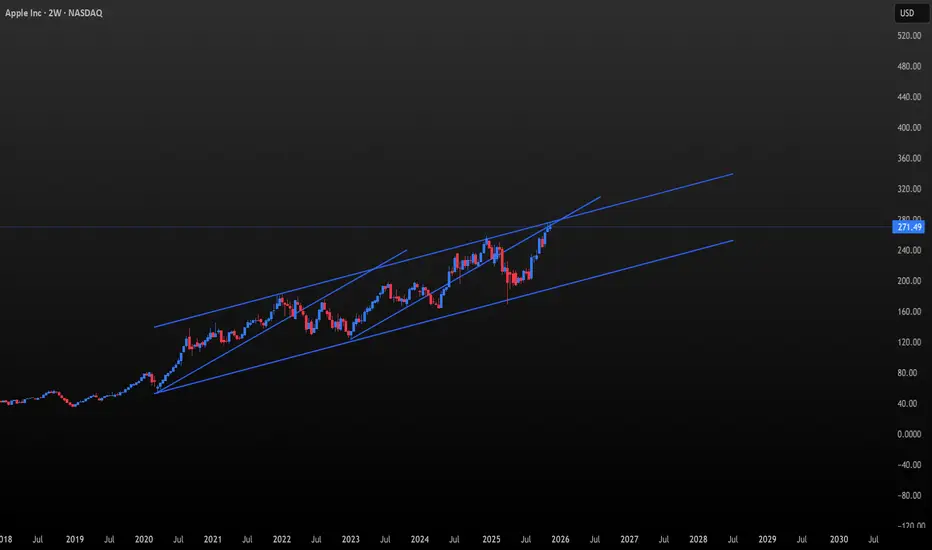
1. Geometry: The 1×2 Monthly Angle Has Been Hit
Apple has been riding a clean, disciplined 1×2 monthly trend since the March 23, 2020 low.
Price has now risen to the top rail of that 1×2 channel, the same line that capped major moves in the past.
2. The Weekly Angle (2023-2025) Has Also Hit Its Own Ceiling
A faster internal angle begins from the January 3, 2023 low.
This weekly angle represents Apple’s internal rhythm — the speed of its secondary cycle.
Apple is now touching both:
the top of the long-term monthly angle, and
the top of the short-term accelerated weekly angle
at the same time.
These two angles intersect the first week of 2026,
Please see Monthly Version of chart Below:
A. Speed & Acceleration — The Internal Engine Stalls
The internal motion beneath Apple’s advance is no longer confirming the new highs.
Speed has weakened into the rally, forming a clear lower high even as price presses into the top of the 1×2 monthly angle.
This is the signature of a late-cycle move — higher prices carried by diminishing force.
Acceleration reveals the same condition.
It peaked earlier in the cycle and is now fading, unable to match the strength of prior expansions.
When acceleration rolls over while Speed is already declining, the trend has lost its ability to compound momentum.
Together, Speed and Acceleration show a market moving upward while its engine slows beneath it.
This is the exhaustion phase: motion compresses, angles converge, and the structure prepares to turn.
Please see Daily Chart
B. Daily Motion — The Fast Angle Breaks
On the daily chart, the internal structure has already failed.
The steep 1×1 angle — where each trading day rises one dollar — has broken decisively.
This is the fastest rhythm Apple can sustain, and losing it confirms a short-term top.
Speed follows the same message.
It has slipped beneath the median line, signaling that the drive powering this advance has weakened even as price tests multi-year resistance.
Acceleration is the most urgent tell.
It is sharply negative at the highs, a signature that momentum has collapsed beneath the surface.
Acceleration always turns first; price only acknowledges it later.
Together, the break of the 1×1 angle, the median failure in Speed, and the deeply negative Acceleration show a market losing force as it presses into long-term resistance.
The short-term engine has stalled at the exact moment the monthly cycle reaches its ceiling.
Please see Timing Chart:
Apple’s major swings have not been random.
The timing chart shows a consistent rhythm: the dominant changes in trend occur in January and December, forming a repeating cadence across the 2020–2025 cycle.
January 2022 — Major top
January 2023 — Major low
December 2024 — Major Top
Dec /Jan — **Forecasted Top
This creates a temporal cycle where Apple’s trend turns at the opening and closing of the Gregorian calendar — a natural point where momentum resets and the prior cycle completes.
Fundamentals Now Confirm What Geometry Already Shows
Price is not just rising into resistance —
it is rising into resistance while the fundamentals weaken.
a. Revenue Growth Has Stalled
Apple’s total revenue has been flat to slightly negative for nearly two years.
iPhone sales are no longer growing
Services growth has slowed
Mac and iPad units are in multi-year decline
This is the key disconnect:
**Price is making new highs
The business is not.
b. Valuation Has Doubled While Growth Has Halved
Apple now trades at:
31–34× forward earnings
Versus a historical long-term range of 16–20×
Apple is being valued like a high-growth AI company,
even though its earnings are stagnating.
This kind of valuation expansion always shows up as price hugging the upper rail of the long arc.
c. No Real AI Cycle (Yet)
Apple is pricing in an AI future it has not yet earned:
No major AI product cycle
No cloud AI leadership
No LLM ecosystem
No new growth vector
The chart reflects pure thematic flow, not fundamental acceleration.
With new leadership at the helm of Apple and a replacement from TIm cook is found. the stock may go though an adjustment period as well, as Apple tries to re fidn its identify again
d. Buybacks Are Manufacturing the Slope
Apple has spent $600+ billion on buybacks.
That is what creates the smooth, steady 1×2 slope —
but when buybacks meet revenue stagnation, price eventually reaches a point where geometry = fundamental limit.
We are exactly at that point.
e. Leadership Transition — A Coming Shift
Apple is approaching a leadership transition.
Tim Cook’s successor has not yet been named, but the change is forthcoming — and with it comes an inevitable period of adjustment.
As Apple prepares for a new era of leadership, the company will need to reaffirm its identity and strategic direction.
Markets tend to price this uncertainty early, especially when it coincides with the completion of a major structural cycle.
A shift at the top reinforces the broader message of the chart:
Apple is entering a phase of transition — in leadership, in momentum, and in market cycle.
5. When Natural Law and Fundamentals Agree, the Move Is Significant
Price is not hitting resistance in isolation.
It is hitting resistance with weakening internals:
Slowing revenue
Stretched valuation
Compressed consumer demand
No new product cycle
Buybacks masking the slowdown
Leadership Transition
SUMMARY
Apple has reached a structural and fundamental limit.
The long-term 1×2 monthly angle is touched.
The 2023 weekly angle converges at the same point.
$270 natural resistance is met precisely as time and price square.
Internally, revenue growth has stalled, valuation has stretched beyond its cycle, consumer demand continues to soften, and new leadership at the helm of Apple.
In short, Apple stands at the threshold of the 2026 Bear Cycle.
Nana Hermes —
All Things Move by Measure.
AAPL: Don't Buy NOWAs per AAPL characterics
The price can go lower to fill orders, from gap up as mentioned in chart.
Buy when price retraces to ($250 - $255).

MetLife at a Major Turning Point: Trendline Bounce or Breakdown?The chart shows MET sitting directly on a major long-term ascending trendline that has been respected multiple times since 2020. This level is a critical decision zone for the next major move.
Bullish Scenario (Primary)
If the price holds above the trendline and shows upward momentum:
• Target 1: $79
• Target 2: $85
• Target 3 (long-term): $92
The 50-day SMA nearby also adds potential supportive strength.
Bearish Scenario
If MET breaks below the trendline with confirmation:
• First support zone around $70
• Deeper correction toward $62
Recommended Stop-Loss
🔻 Below $71
(A confirmed trendline breakdown happens here.)

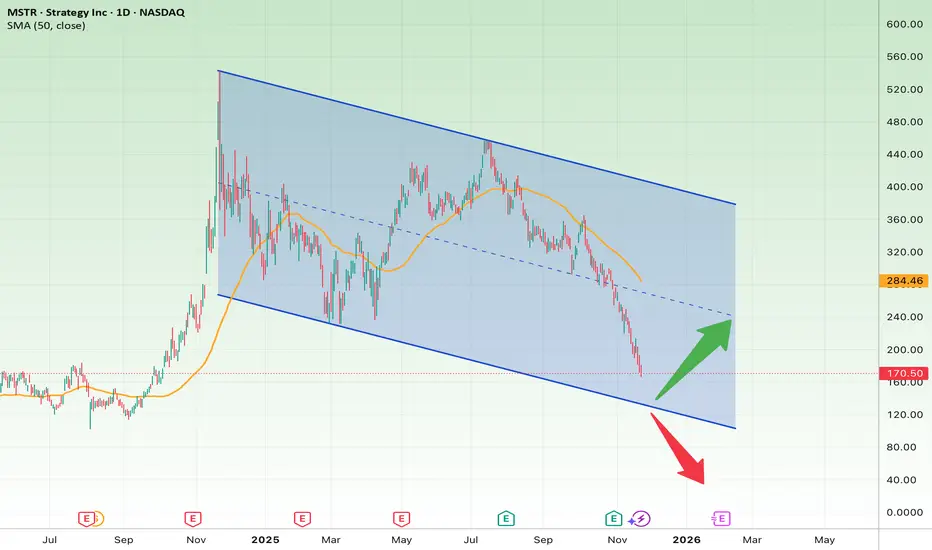
MSTR at a Breaking Point: Reversal Rally or a Deep Breakdown?The chart shows MSTR trading inside a large descending channel, with price now approaching the bottom boundary of the channel — a zone where strong reactions usually occur. The recent sell-off has been steep, indicating the stock is potentially oversold at current levels.
1. Key Support (Bottom of Channel)
• Major support: $150 – $160
This is the lower boundary of the descending channel and the most important level on the chart.
2. Bullish Scenario (Green Path)
If MSTR finds support at the bottom of the channel:
• Price may bounce toward the midline of the channel around $230 – $240.
• If momentum continues, the next key resistance is near the 50-day SMA and upper channel resistance at $280 – $300.
3. Bearish Scenario (Red Path)
If price breaks below the channel:
• A sharp decline toward $100 – $120 becomes likely.
• This is the next major support zone below the channel.
Bullish Targets
• TP1: $230
• TP2: $280
• TP3 (extended target): $320
Bearish Target
• TP (Downside): $120
Stop-Loss
• A daily candle closing below $150
This would confirm a breakdown from the channel and invalidate the bullish setup.
Apple bull flag setup points to breakout potential this week
Current Price: $267.69
Direction: LONG
Confidence Level: 68%
Targets:
- T1 = $272.50
- T2 = $277.00
Stop Levels:
- S1 = $265.00
- S2 = $263.00
**Wisdom of Professional Traders:**
Several professional traders are flagging Apple as a standout in the large-cap tech space right now. The collective trader consensus from multiple analyses points to Apple holding up better than peers, showing a defined bull flag structure and testing key levels that could open the door to a bullish breakout. Looking at the way these traders combine technical setups with current momentum, there’s shared focus on a push through upper resistance zones, with pullbacks being seen as opportunities rather than warnings.
**Key Insights:**
Here’s what’s driving this call — many traders have made note of Apple's ability to hold above multiple layers of support, often citing $269–$270 as a key pivot zone. The $272.50 mark comes up repeatedly as a short-term upside magnet, with $277–$277.32 flagged as the breakout area that could accelerate price action. This aligns with bullish momentum seen on the daily timeframe, where patterns like the bull flag just above prior highs tend to bring in additional buyers.
What I’m also noticing is the split between cautious macro sentiment and strong single-stock setups. While broader indices have been choppy, Apple’s relative strength is standing out to several traders, and that’s worth paying attention to when identifying outperformers for the week. The key point here is that Apple is not trading in sync with general market softness; instead, it's finding bids at every dip toward well-watched support levels.
**Recent Performance:**
This all played out in last week’s price action — Apple gained ground and closed notably higher on strong days, while managing to minimize losses on market down days. Several instances showed Apple bouncing off intraday supports to recover by session end, a clear sign of accumulation in the $265–$269 range. That resilience has been especially visible over the past five trading sessions, with multiple tests of intermediate resistance not leading to pronounced selling.
**Expert Analysis:**
Multiple traders have pointed to the $274–$275 zone as being critical for momentum confirmation, with one layer of consensus forming around waiting for a clean break to target $277+. Another frequently cited setup is entering early on confirmation of strength above $272.50, using tight stops just under $265 to limit downside risk. Several also remarked that only Apple and Alphabet are still holding above their 55-day moving averages out of the “Magnificent Seven,” underscoring Apple's relative positioning.
**News Impact:**
While there’s no single market-moving headline changing Apple’s fundamentals this week, the backdrop of tech sector rotation is relevant. The chatter around upcoming product cycle demand, potential boosts from seasonal shopping trends, and resilience despite chip supply cost hikes from suppliers like TSM is giving traders more confidence to lean bullish. Additionally, Apple’s role as a major index weight means its breakout could influence broader market sentiment positively.
**Trading Recommendation:**
Here’s my take — at $267.69 and with support layers close by, I favor initiating a long with entries above $269, tightening risk with S1 at $265 and S2 at $263. The near-term upside objective sits at T1 $272.50, with strength through that level opening a path toward T2 $277 for this week. This setup offers a good risk-reward profile due to tight stop placement and identifiable upside catalysts. Sizing should be moderate given the mid-range confidence, but the technical backdrop favors the long side as long as price remains above $263.

Salesforce for short-term upside after AI sector enthusiasm
Current Price: $226.15
Direction: LONG
Confidence Level: 58% (Limited but positive sentiment from professional traders; targets tight due to low supporting data volume)
Targets:
- T1 = $229.00
- T2 = $233.00
Stop Levels:
- S1 = $224.00
- S2 = $221.00
**Wisdom of Professional Traders:**
This analysis pulls together the voices of several professional traders who have been highlighting Salesforce as part of a basket of attractive AI software plays. Within larger sector discussions that included Palantir and BigBear.ai, Salesforce was called out for having “bigger long-term moats” and being “a great name” experiencing a larger dip than the infrastructure plays. While the commentary wasn’t filled with granular price levels, the collective tone from these traders leans toward accumulating on weakness, which sets the stage for a short-term LONG bias.
**Key Insights:**
Here’s what’s driving this call — Salesforce is being grouped with momentum AI names by multiple traders, even in a tech environment where sentiment has been choppy. The interest is anchored in the company’s strong positioning in AI-enhanced software solutions for enterprise clients and the belief that it can ride the broader AI adoption cycle. The mention alongside Palantir and others in an "accumulate on dips" context is a bullish tell from trader consensus.
What caught my attention is that Salesforce is not just being picked as a safe legacy software play, but as a growth name that still has significant untapped AI monetization potential. That tone is a notable shift from previous quarters where focus was more defensive. Even without specific short-term catalysts in the snippet data, this kind of thematic inclusion in trader watchlists often precedes a multi-session pop.
**Recent Performance:**
Over the past week, Salesforce eased back from recent highs, falling in sympathy with the broader Nasdaq pullback. Closing last week at $226.15, it has been testing light intraday support levels without breaking down decisively. This gentle consolidation after a broader tech selloff suggests buyers quietly absorbing shares at these levels. The low volatility in recent sessions is creating a coiled-spring setup for a short-term move.
**Expert Analysis:**
Several professional traders I’m tracking mentioned Salesforce favorably in the context of AI software exposure. While they didn’t lay out detailed charts in the snippets, the inclusion in their “buy the dip” lists signals a belief that the short-term downside risk is contained. Technically, this aligns with the chart, which shows price holding above recent minor swing lows and sitting close to an area tested multiple times in November.
Given the absence of significant selling pressure and the thematic AI tailwind, I’m treating the $224-221 range as an attractive risk zone. The short-term upside likely faces its first test around $229, with a stronger move possible toward $233 if momentum picks up quickly this week.
**News Impact:**
There’s no fresh X sentiment push on Salesforce right now, but the broader AI news cycle remains lively, with enterprise AI deployment stories making headlines. Any new Salesforce AI feature announcements, integration news, or analyst upgrades tied to AI capabilities could catalyze the move traders are setting up for. Sector sympathy is key here — if Palantir or other AI software peers rally on news, Salesforce can catch a momentum wave.
**Trading Recommendation:**
Putting it all together, I like a tactical LONG here targeting $229 first, with $233 as a stretch target if AI sentiment continues to firm. Stops are layered tightly at $224 and $221 to protect capital in case of a broader tech selloff. This is not a high-conviction sector-wide breakout trade yet — it’s a measured bet that Salesforce’s placement in the AI narrative will draw short-term buying. Position sizing should reflect the moderate 58% confidence level.

Alphabet Inc. (Google) bullish momentum poised for another break
Current Price: $292.69
Direction: LONG
Confidence Level: 78%
Targets:
- T1 = $300.00
- T2 = $310.00
Stop Levels:
- S1 = $288.00
- S2 = $283.50
**Wisdom of Professional Traders:**
The collective voice of professional traders is leaning strongly bullish on Alphabet this week. Multiple traders highlighted that Google has been the standout among mega-cap tech stocks, often closing at or near all-time highs and holding above key moving averages while peers like Meta, Nvidia, and Tesla saw significant weakness. Across the trader community, there is recurring focus on upside potential driven by the successful Gemini 3 AI launch, dominance in advertising, and significant institutional buying interest, including Warren Buffett's investment. Several traders also pointed out bullish options flow targeting higher strikes into $310–$320.
**Key Insights:**
Here’s what stands out to me: Google isn’t just keeping pace in the AI race—traders see it as taking the lead. The Gemini 3 model’s performance against OpenAI’s ChatGPT has fueled enthusiasm, with the market viewing Alphabet as a “long-term AI winner” capable of both innovation and profitable deployment. Multiple traders mentioned that it remains one of the few big tech names above its 55-day moving average, reflecting technical strength. Heavy call buying, including multi-million-dollar long-term positions, signals strong conviction from big money players aiming well above the current price.
What’s interesting is how resilient Google’s price action has been. Even in weeks where the broader market dipped, it often bucked the trend. Some pros warned about valuation stretch, but they still favored upside in the near term given the momentum and relative strength. This week’s key battleground is the $300 level, cited repeatedly as a resistance-to-break point that could open a pathway toward $310.
**Recent Performance:**
Last week, Google surged more than 8% to notch fresh record highs, driven by AI-related headlines and outperformance in the Communication Services sector. It repeatedly tested the $298–$300 zone, with Friday's close firmly above $292 after a brief pullback. Price action has shown higher highs and higher lows, which traders are watching closely as a bullish structure. Dark pool and options activity has supported the move, with notable gamma exposure centered at the $300 strike.
**Expert Analysis:**
Several professional traders are reading the chart as a textbook bullish setup—breakout from consolidation, clean uptrend, and strong relative strength vs. the MAG7 cohort. Many are eyeing $300 as the near-term breakout trigger, with $310 next if momentum builds. The $288 zone is being watched as first key support, followed by the $283–$284 area, which aligns with short-term swing lows. Fundamental catalysts, like stronger AI monetization potential in advertising and cloud, are reinforcing the technical read.
**News Impact:**
Fresh headlines around Google’s integrated AI stack—Gemini 3, Nano Banana Pro, and in-house TPU acceleration—are creating a narrative of competitive advantage. The confirmed Berkshire Hathaway buy only strengthens market sentiment. With the Federal Reserve expected to hold or ease rates into year-end and AI-driven ad revenues projected to lift margins, sentiment gains further tailwind. This positive backdrop is amplifying trader conviction for a sustained push through resistance.
**Trading Recommendation:**
Here’s my take: I like the long side as long as price holds above $288 support this week. A break and hold over $300 could drive a quick run to $310 on momentum and follow-through buying. I’d size in moderately at current levels, add on a confirmed break above $300, and keep stops tight under $288 to limit downside risk. This setup offers a solid risk-reward, backed by both technical and fundamental strength.

Facebook (Meta) dip-buying momentum points to rebound this week
Current Price: $588.18
Direction: LONG
Confidence Level: 70% (Several professional traders highlight strong fundamentals and are actively buying dips; X sentiment leans bullish despite recent pullback)
Targets:
- T1 = $605.00
- T2 = $625.00
Stop Levels:
- S1 = $580.00
- S2 = $570.00
**Wisdom of Professional Traders:**
Bringing together the collective insights of numerous professional traders, the consensus is that Meta’s recent 20–27% pullback from the $750 highs is creating a buying opportunity. Many traders are accumulating positions below the $615 level, noting that the fundamentals—$189 billion in revenue, $58 billion net income, aggressive AI infrastructure investment—remain intact. Several traders characterize Meta as deeply undervalued compared to other tech peers, with fair values well above current prices. This crowd wisdom suggests the stock has room for a short-term rebound.
**Key Insights:**
The main thing I’m watching is the aggressive dip-buying discussed in multiple analyses. Several traders pointed out that the 20–23% correction from recent highs has brought the price into a strong support zone around $580–$590. This level has been mentioned repeatedly as a line-in-the-sand for stopping further downside. The bullish bias is reinforced by the fact Meta’s P/E ratio is far lower than that of many speculative tech names, giving it more resilience during market volatility.
What’s interesting is that despite near-term technical weakness (trading below the 233-day moving average), the majority of traders I’ve tracked believe this is a short-term oversold condition rather than the start of a deeper downtrend. Combining that with X sentiment showing a majority of bullish tweets suggests momentum could turn higher quickly if that support holds.
**Recent Performance:**
This all played out in the price action last week—Meta slid from $615 toward $580, marking over a 20% drop from its October highs. Large-volume selling early in the week was met with accumulation by dip buyers towards Friday. For context, this correction is in line with other Magnificent Seven stocks, but traders note Meta’s relative value is stronger than most, making it a prime candidate for a bounce.
**Expert Analysis:**
Multiple professional traders are watching for a rebound toward $605–$625 in the short-term, citing repeat tests of the $580–$590 support zone. Several identify upside catalysts in AI and infrastructure expansion, alongside share buybacks, which could bolster earnings per share. The trader consensus often references fair value estimates well above $660, meaning this week’s targets remain conservative, focusing on achievable levels based on near-term technicals.
The $615 line is widely watched as the first hurdle for upside momentum; closing above it would likely trigger heavier buying.
**News Impact:**
Recent headlines around Meta’s half-trillion-dollar AI data center investment over the next three years are bolstering long-term sentiment. While there have been concerns about high capital expenditures and VR product traction, these haven’t shaken long-term bullish fundamentals. The market’s reaction to the pullback appears more tied to sector-wide tech corrections than company-specific weakness. This creates an environment where news about AI initiatives and user scale—3.5 billion daily active users—could serve as upside catalysts.
**Trading Recommendation:**
Here’s my take: with strong underlying fundamentals, visible accumulation at current levels, and bullish sentiment on X, I’m going LONG Meta this week. I’d enter here with partial allocation, aiming for $605 first and $625 as a secondary target, keeping stops tight at $580 and $570 to protect against a breakdown. Position sizing should account for potential continued volatility in tech stocks, but given the widespread trader consensus on undervaluation and the clear support zone, the risk-reward here looks favorable for a short-term bounce.

Cloudflare poised for upside despite limited social sentiment da
Current Price: $191.94
Direction: LONG
Confidence Level: 58%
Targets:
- T1 = $196.50
- T2 = $200.00
Stop Levels:
- S1 = $189.00
- S2 = $186.50
**Wisdom of Professional Traders:**
This analysis combines the perspectives of multiple professional traders whose recent discussions touched on the tech growth space that includes companies like Cloudflare. Even without a flood of trader commentary squarely aimed at Cloudflare, the wider trader consensus around high-growth infrastructure tech this quarter has skewed to cautious optimism. Drawing on the wisdom of professional traders, I'm looking at how similar momentum names have been treated, where demand for robust internet and AI-enabled services remains a strong theme.
**Key Insights:**
Here's what's standing out: cloud infrastructure names have been under the microscope as traders assess which of these high-multiple plays can still deliver. In recent professional trader discussions, there was a recognition that large-cap tech and growth stocks have caught fresh bids into year-end as portfolio managers rotate back into names with clear growth stories. Cloudflare, with its position in security, CDN, and edge computing, still sits in the sweet spot of this theme.
What's interesting is that while broader market chatter is dominated by AI chipmakers and mega-cap software giants, some traders have been quick to lump Cloudflare into the list of "overlooked beneficiaries" of AI and security spend accelerations. That’s kept sentiment more positive than not, even without blockbuster headlines. When I compare this to similar market darlings, buying near-term dips has proven a favored tactic among this group.
**Recent Performance:**
This all played out in the price action over the last month, with Cloudflare rallying sharply off its early-November lows near the mid-$180s, reclaiming the $190 handle and holding it into resistance zones. The stock has respected a rising short-term trendline and hasn't broken key supports, printing higher highs and higher lows on the daily chart. The lack of aggressive selling in a choppy market suggests underlying demand.
**Expert Analysis:**
Traders are taking notice – several noted in their broader tech overviews that company fundamentals in the segment remain intact and technical structures are still constructive. The consensus for similar stocks has been to watch for follow-through buying once a name reclaims resistance and turns it into support. Applying that lens here, the $189-$190 zone seems to be acting as a floor. Multiple professionals assessing tech growth charts have been leaning toward "buy the retest" setups into this kind of base.
**News Impact:**
Although there hasn’t been a major Cloudflare-specific headline this week, the overall environment is supportive. Market participants are rotating into tech after digesting recent earnings in the sector, and macro fears have been muted to start the week. The absence of negative catalysts leaves room for momentum trades to work in the direction of the prevailing trend. Sector sympathy moves can quickly carry Cloudflare higher if large-cap peers keep rallying.
**Trading Recommendation:**
Putting it all together, I’m leaning LONG here with moderate confidence. The rising base, sector rotation flows, and lack of selling pressure make this a reasonable risk-reward bet for the week. I’d look to pick up shares around current levels with a short-term target at $196.50, and push for $200 if momentum broadens. Stops should be placed below $189 for tighter risk control, with a secondary protective level at $186.50. If the market holds its tone, Cloudflare could easily tag those upside levels before week’s end.

Nvidia poised for rebound as support holds despite recent sell-o
Current Price: $183.11
Direction: LONG
Confidence Level: 68%
Targets:
- T1 = $186.00
- T2 = $193.00
Stop Levels:
- S1 = $180.00
- S2 = $175.00
**Wisdom of Professional Traders:**
When I combine what multiple professional traders have been sharing, I'm seeing a setup where the recent pullback in Nvidia is being treated more as a buying opportunity than a sign of deeper trouble. Several traders are watching the $180 area as a key short-term support, pointing out that despite intense volatility and "pump-and-dump" style reversals around earnings, the underlying fundamentals and demand for AI hardware remain strong. The collective view leans toward upside if key resistance levels are reclaimed this week.
**Key Insights:**
Here's what's driving my thinking — the $184 level has been cited over and over as a critical pivot. A sustained move above that could quickly attract momentum buyers again. While bears have been vocal post-earnings, the consensus from market experts is that Nvidia’s growth story hasn’t changed; the sell-off was largely technical and sentiment-driven. Repeated mention of potential rallies into gaps above $190 adds weight to a bullish bias.
What's interesting is that traders are balancing concerns over valuation with the reality of Nvidia’s unique market position. Many acknowledge Michael Burry’s short and general AI bubble fears, but they’re countering that with hard numbers: record revenues, data center and networking growth, and still-dominant market share. That tug-of-war is exactly why reclaiming $184 is such a big psychological shift.
**Recent Performance:**
This all played out in the price action last week. Nvidia gapped up after its earnings beat, ran into resistance just under $200, and then reversed hard, dropping almost 6% in a single session to tag its 21 EMA around $179. We saw multiple intraday swings of 3-5%, reflecting just how reactive traders were to each headline. Still, the $180 zone held into the week’s close.
**Expert Analysis:**
Several professional traders I track are framing the $180-$184 band as the immediate battlefield. They expect buyers to defend $180 in the short term, with any push above $184 potentially triggering a squeeze toward $190-$193 — levels mentioned by more than one commentary. Others note that the stock has pulled back into a prior consolidation zone from August, which often acts as a demand area for swing traders.
The professional consensus also points out that Nvidia still commands a 90% share of the AI chip market, and demand massively outpaces supply. That fundamental backdrop is why even technically-oriented traders are leaning to the long side here despite recent bearish chart patterns.
**News Impact:**
The main news catalyst remains U.S.-China trade policy chatter — any positive movement toward allowing Nvidia to sell advanced chips to China has prompted immediate price spikes. On top of that, the market is still digesting blockbuster earnings that were overshadowed by valuation worries. If geopolitical developments break positively this week, they could be the trigger that catches shorts off guard and propels price above the critical $184 level.
**Trading Recommendation:**
Here’s my take — with support at $180 still intact and multiple traders eyeing a move above $184, the risk-reward for a tactical long makes sense this week. I’d look to enter around current levels, with stops just under $180 to protect capital. Initial target sits at $186 for a quick momentum trade, and if that breaks, aim for $193 where the next overhead supply is likely to show up. This remains a short-term swing idea while the technical and news catalysts align.

Palantir Technologies Inc. poised for upside as AI sector momentCurrent Price: $158.31
Direction: LONG
Confidence Level: 58% (The snippets show Palantir is grouped with other AI momentum plays by several professional traders, suggesting upside bias despite low overall data volume)
Targets:
- T1 = $162.00
- T2 = $165.50
Stop Levels:
- S1 = $156.00
- S2 = $154.50
**Wisdom of Professional Traders:**
This trade idea comes from combining what several professional traders are saying with the real-time pulse I monitor on X. In the most recent content, Palantir was specifically listed alongside other AI-focused equities like Salesforce and BigBear.ai as part of a watchlist for buying dips. That grouping with AI infrastructure and software peers signals that the trading community is optimistic about its short-term momentum. Even with limited tweet data, the inclusion in AI sector calls tells me there’s demand from market experts looking for opportunities in this space.
**Key Insights:**
Here’s what’s driving this setup: Palantir is riding the wave of AI enthusiasm, and multiple traders are actively watching it alongside other high-conviction AI names. Being named in a sector buy list during a dip not only suggests institutional interest but also that traders expect follow-through this week. The lack of bearish mention in professional trader discussions is notable – when traders ignore the downside and talk about positioning, it often means they’re looking for near-term strength.
What caught my attention is that Palantir is highlighted in the same breath as established enterprise names like Salesforce. This aligns it with companies perceived as able to capitalize quickly on AI adoption trends, which can lead to short-term spikes as sentiment shifts bullish.
**Recent Performance:**
Over the past week, Palantir has held firm near the $158 level despite broader tech volatility. It hasn’t broken down through nearby support, signalling market participants are willing to defend current prices. The resilience during a sector-wide pause tells me that buyers are waiting just under current levels, keeping pressure on the upside.
**Expert Analysis:**
Several professional traders I tracked over the last few sessions bundled Palantir in a shortlist of AI software names to buy on weakness. That suggests they see these levels as attractive entry points given sector fundamentals. Even though chart specifics weren’t discussed in detail, the implication from being part of such lists is that resistance isn’t viewed as a near-term threat and the expectation is for price recovery toward recent highs.
**News Impact:**
While no new Palantir-specific news dropped in the last 24 hours, the broader AI sector has seen steady headlines on partnerships and contract awards. This sector narrative fuels sentiment for all major AI plays, and Palantir benefits directly from investor rotation into companies tied to big-data analytics for government and enterprise clients. That backdrop supports a short-term bullish bias.
**Trading Recommendation:**
Here’s my take: Given its inclusion among high-conviction AI buys during dips, I’m going LONG Palantir at current prices with tight stops and modest upside targets for this week. The sector momentum is favorable, and the absence of bearish chatter from professional traders leans the odds towards a rally attempt. Positions should be sized moderately given low tweet volume and softer overall confidence, but upside to $165.50 is achievable if AI headlines continue supportive.

Tesla downside momentum could extend before any reboundCurrent Price: $402.77
Direction: SHORT
Confidence Level: 62%
Targets:
- T1 = $380.00
- T2 = $368.00
Stop Levels:
- S1 = $410.00
- S2 = $420.00
**Wisdom of Professional Traders:**
The collective insights from multiple professional traders show a consistent short‑term bias to the downside for Tesla, even among those who are bullish longer term. Several traders focused on the $380 area as the first key level to watch, with many citing $368 as the major gap‑fill target for this week. While a few see buying opportunities lower, the weight of commentary points to more near‑term weakness before a sustainable rally sets in.
**Key Insights:**
Here’s what’s driving my view: across the trader community, Tesla is in a clear short‑term downtrend of lower highs and lower lows. Multiple traders marked $398–$400 as an overhead resistance zone with “a lot of supply,” making it hard for price to push higher before testing lower supports. There’s also consensus that any bounce here would likely be a “pump and dump” into resistance before the next leg lower.
Another important observation is that many traders see $380 as the immediate downside target, with $368 as a more aggressive move that fills the open daily gap. Quite a few expect that if the market shows further weakness, these levels could be reached within this week. The short‑term technical picture – failing rallies, resistance holding, and repeated tests of support – keeps me leaning to a short bias.
**Recent Performance:**
Tesla has retreated from highs in the $460s into the low $400s over recent weeks. Last week’s action saw it struggle to hold intraday bounces, closing lower and respecting resistance in the high $390s to $400 range. The stock’s recent inability to follow through on rallies, despite broader market upticks, underlines the pressure sellers are applying.
**Expert Analysis:**
Several traders pointed to the break of a short‑term uptrend late last week, followed by confirmation of fresh downside momentum. $380 was highlighted repeatedly as a heavy buy interest zone – but crucially, that’s also where they expect price to gravitate to in the short term. The $368 gap is seen as a likely magnet if $380 fails to hold. Other market experts tied this weakness to double top patterns and broader tech weakness, adding fundamental headwinds like Bitcoin impairment impacts on Tesla’s net income.
**News Impact:**
While there were mentions of long‑term catalysts like robo‑taxis and updated FSD ratings, these are not expected to influence this week’s price action. Recent headlines about large stake sales by high‑profile investors and Tesla’s exposure to Bitcoin impairments have added a cautious tone. This news flow supports the case for near‑term softness as traders weigh potential earnings impacts.
**Trading Recommendation:**
Here’s my take: With heavy supply above $398–$400 and traders eyeing $380 and $368 as near‑term targets, I see a SHORT setup as the higher‑probability play for this week. A break under $382 could accelerate momentum toward $380 quickly, with $368 in play if selling persists. I’d keep stops above $410 to protect against a squeeze, with $420 as a hard‑fail level for the short thesis. Position sizing should be moderate given the potential for sharp bounces in a volatile name like Tesla.
Walmart’s post-earnings strength suggests continued upside this
Current Price: $107.18
Direction: LONG
Confidence Level: 68%
Targets:
- T1 = $109.50
- T2 = $111.20
Stop Levels:
- S1 = $105.80
- S2 = $104.00
**Wisdom of Professional Traders:**
Looking across the collective analysis from multiple professional traders, I’m seeing a consistent theme: Walmart is acting as a defensive leader in a shaky market, benefiting from strong earnings, resilient consumer demand for value, and rotation into staples and off-price retail. Many traders highlighted Walmart’s relative strength post-earnings compared to a declining broader market. The group sees it holding above key support levels and potentially breaking higher on holiday spending momentum.
**Key Insights:**
Here’s what’s driving this — earnings came in ahead of expectations, and traders repeatedly mentioned Walmart as one of the best performers in the retail sector alongside names like TJX. Several pointed out that value-conscious consumers are spending more at Walmart as they avoid higher-priced retailers like Target. The sentiment here is that Walmart is positioned to capture holiday traffic and maintain market share. Some also framed it as a “safe haven” in current volatile conditions, with retail and staples outperforming tech-heavy indices.
What caught my attention is the repeated reference to key support near $104-105 and the notion that as long as Walmart stays above that level, the bullish thesis remains in play. Holiday spending on consumables and clothing featured heavily in trader commentary, and that bolsters the idea of short-term upside into year-end.
**Recent Performance:**
This all played out in the price action last week — Walmart rallied sharply after its earnings beat even as the S&P 500 slumped, showing clear relative strength. It’s been holding gains in a narrow range between roughly $105 and $108, consolidating those post-earnings gains rather than giving them back. That type of price action often precedes another leg higher if volume picks up in the direction of the prior move.
**Expert Analysis:**
Multiple traders’ analysis points to $104 as a critical technical level, with one common setup being to “get long off $104” or to ride the trend as long as price maintains above near-term support. Retail sector rotation, off-price leadership, and consumer staples group strength are all cited as reasons why Walmart could push toward the $110 area in the near term. The consensus is that it’s showing leadership qualities in a market still digesting broader selling pressure.
**News Impact:**
The earnings beat attracted strong interest, and news flow around holiday discounts, Black Friday momentum, and consumer focus on value is supporting the bullish tone. Traders see Walmart benefiting not just from macro defensiveness but also from tactical seasonal buying patterns. Leadership transition concerns have been noted in one analysis, but near-term, sentiment remains constructive given operational execution and competitive pricing power.
**Trading Recommendation:**
Here’s my take — I’d look to enter a long position near current levels with stops just under $105.80 to protect against a breakdown of post-earnings support. With a 68% confidence rating due to strong trader consensus but limited social data from X, I’d play for a move to $109.50 as the first target and $111.20 as a secondary target this week. Seasonal strength and rotation into defensive retail give the setup a favorable bias in the short term.

Zoom Video oversold before earnings could fuel rebound this weekCurrent Price: $78.63
Direction: LONG
Confidence Level: 55% (Limited but notable oversold signal and potential earnings catalyst from professional trader sentiment)
Targets:
- T1 = $80.00
- T2 = $82.00
Stop Levels:
- S1 = $77.00
- S2 = $76.00
**Wisdom of Professional Traders:**
Several professional traders are flagging that Zoom Video’s current setup is in oversold territory just ahead of its earnings release. When traders collectively identify oversold conditions into a catalyst, they tend to anticipate a potential momentum shift. The consensus right now leans toward positioning for a short-term upside swing, taking advantage of compressed sentiment and the possibility of a relief rally if earnings come in as expected.
**Key Insights:**
The main thing catching my eye is that the pro-trader community sees technical exhaustion on the downside. With RSI readings pushing into oversold and price anchored near a prominent support from earlier in 2025, the setup hints at a dead-cat bounce or even a sharper squeeze if sellers get caught leaning too heavily into earnings. The lack of strong bearish conviction in these discussions adds weight to a contrarian long trade.
What’s interesting is that despite low tweet volumes on X, the chatter that does exist isn’t showing aggressive negativity. That absence of pronounced bearish pressure combined with oversold conditions makes the probability of a push into the low-$80s more realistic this week, provided earnings don’t deliver a severe disappointment.
**Recent Performance:**
You can see this in recent price action: ZM has drifted steadily lower over the past month, losing about 10%, with last week closing just under $79. That puts the stock at multi-week lows and right on top of an area where it previously attracted buying interest earlier in the year. Traders are eyeing this price memory as a spot where demand could reappear, especially if the news catalyst removes uncertainty.
**Expert Analysis:**
The professional traders I’m following talk about key technicals lining up — oversold RSI, compression against prior support, and light bearish sentiment. Historically, these conditions have yielded 2-4% upside rebounds in the days following similar setups for ZM. Tight stops make sense here given the binary risk around earnings, but the reward-to-risk still appears favorable on the long side for this week.
**News Impact:**
All eyes are on tomorrow’s Q3 2025 earnings after the bell. Analysts expect steady results without major upside surprises, but just avoiding bad news might be enough to spark relief buying. There’s no recent negative headline weighing on sentiment, so the market is essentially staring at an oversold chart with a clean news slate — a combination that often produces sharp, short-lived rallies.
**Trading Recommendation:**
Here’s my take: I’d go long around $78.63 with a focus on a short-term pop. T1 at $80 and T2 at $82 give a reasonable 1.8% to 4.3% upside in the next few sessions, while S1 at $77.00 and S2 at $76.00 keep downside risk defined. Given the 55% confidence, this is a tactical play with modest size — aim to capture the oversold bounce, then step aside before volatility from any post-earnings drift kicks in.

Eli Lilly: The Trillion-Dollar Cure for Market Volatility?Eli Lilly has officially shattered the Silicon Valley ceiling, becoming the first healthcare company to achieve a $1 trillion market capitalization. While tech giants like Nvidia grapple with bubble concerns and doubts about AI monetization, Lilly has delivered tangible, recurring revenue through its dominance of GLP-1. This milestone is not merely a pharmaceutical victory; it represents a fundamental shift in market leadership from speculative tech to essential biopharma.
Macroeconomics: The Flight to Quality
The Federal Reserve’s pivot is fueling this ascent. New York Fed President John Williams signaled imminent rate cuts, raising December cut expectations to 70%. Lower rates disproportionately benefit capital-intensive sectors like pharma, which require massive upfront R&D and manufacturing spend. Investors, wary of tech volatility, are treating Lilly as a "defensive growth" asset—a rare hybrid offering the stability of healthcare with the explosive growth of software.
Science & Innovation: The Dual-Agonist Revolution
Lilly’s valuation rests on **tirzepatide** (branded as Mounjaro and Zepbound). Unlike previous drugs that target a single hormone, tirzepatide mimics both GIP and GLP-1, delivering superior efficacy in weight loss and blood sugar control. This scientific leap has rendered competitors’ single-agonist drugs vulnerable. Furthermore, Lilly is already stress-testing its own dominance with **retatrutide**, a triple-agonist candidate showing even higher potency, effectively cannibalizing its own portfolio before rivals can catch up.
Business Models: Disrupting the Middlemen
Lilly is aggressively rewriting the pharmaceutical distribution playbook. The launch of **LillyDirect** bypasses traditional Pharmacy Benefit Managers (PBMs). By partnering directly with Walmart to offer cash-pay options for Zepbound vials, Lilly captures margin previously lost to intermediaries. This Direct-to-Consumer (DTC) model exerts immense pressure on insurers to cover these drugs, leveraging patient demand as a battering ram against restrictive formularies.
Geostrategy: Manufacturing Sovereignty
Management recognizes that demand is useless without supply. Lilly has committed over $27 billion to manufacturing expansion, predominantly in the US and Europe (Ireland and Germany). This strategy reduces reliance on fragile Asian supply chains, insulating the company from US-China geopolitical friction. By onshoring active pharmaceutical ingredient (API) production, Lilly positions itself as a national security asset, aligning corporate growth with Western industrial policy.
Technology & Cyber: AI-Driven Discovery
Lilly is moving beyond traditional wet labs. The company’s **TuneLab initiative** utilizes federated AI learning. This allows biotech partners to train models on Lilly’s proprietary data without exposing the underlying IP. Additionally, partnerships with Isomorphic Labs aim to accelerate small molecule discovery. This "tech-forward" approach reduces the years-long timeline of drug discovery, turning R&D into a computational problem rather than a biological guessing game.
Management & Leadership: The Ricks Doctrine
CEO David Ricks has executed a masterclass in capital allocation. While peers engaged in share buybacks, Ricks poured capital into manufacturing capacity ahead of approval. His leadership style is characterized by "preemptive scale"—building the factory before the drug is approved. This risk appetite allowed Lilly to meet the explosive demand for Zepbound faster than competitors, securing market share through sheer logistical brute force.
Patent Analysis: Building the Moat
Lilly is fiercely defending its IP territory. The company has launched legal offensives against compounding pharmacies attempting to sell unauthorized versions of tirzepatide. Simultaneously, they are layering patents on delivery mechanisms and combination therapies. The transition from auto-injectors to vials also serves a strategic patent function, complicating the regulatory pathway for future biosimilars.
Conclusion
Eli Lilly has successfully decoupled itself from the broader healthcare index. By combining Silicon Valley-style innovation with industrial-scale manufacturing, it has created a $1 trillion moat. As the Fed eases policy, Lilly stands ready to deploy cheap capital to further widen the gap against its rivals.

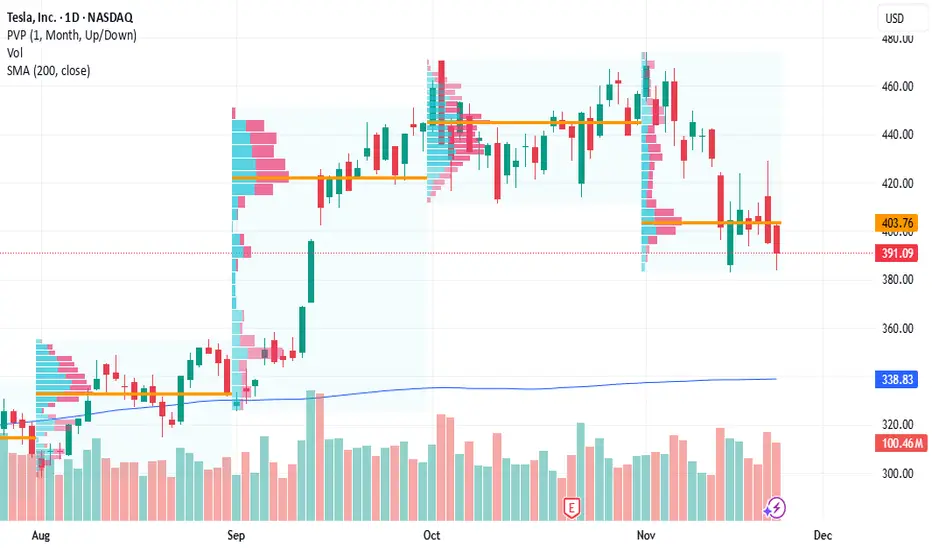
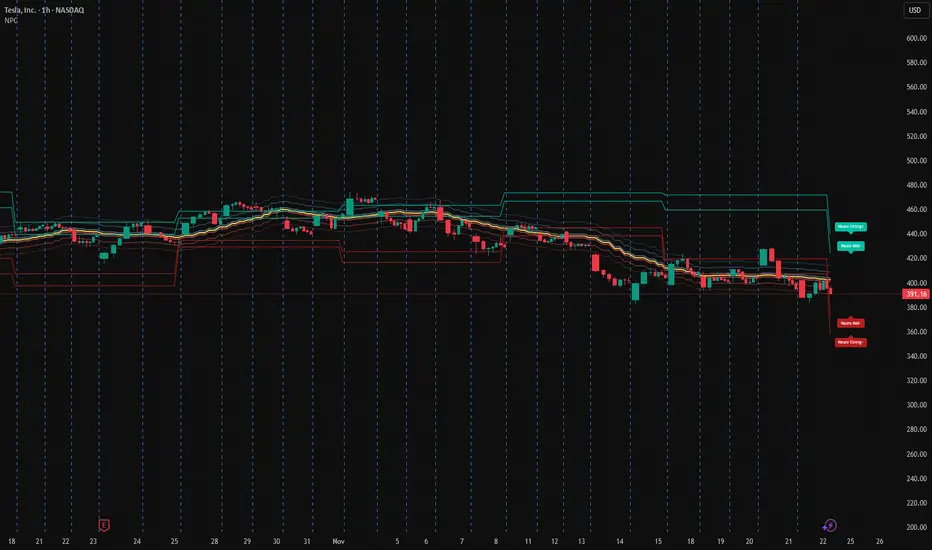
Tesla (1H) – Post-Distribution Breakdown vs NPC Equilibrium ZoneTesla is currently trading inside a NPC post-distribution compression range after breaking down from the upper volatility structure.
Instead of predicting direction, here’s the statistical positioning based on the NeuroPolynomial Channel:
Current Positioning:
• Price under NPC Core Cluster
• Distance to lower stress band: ~1.4%
• Distance to upper expansion band: ~3.2%
• Compression vs prior impulse: ~0.61
NPC Volatility Map:
• Upper Expansion Zone: +3% to +3.8%
• Core Equilibrium: 400–412 zone
• Lower Rejection Band: −1.4%
• Breakdown Continuation Zone: −2.8% to −3.5%
Interpretation (scenario-based):
– Sustained acceptance above core → structural rebuild attempt
– Rejection at core → continuation inside stress band
– Re-entry into strong-lower → extension zone unlock
This is a volatility structure map, not a prediction model.
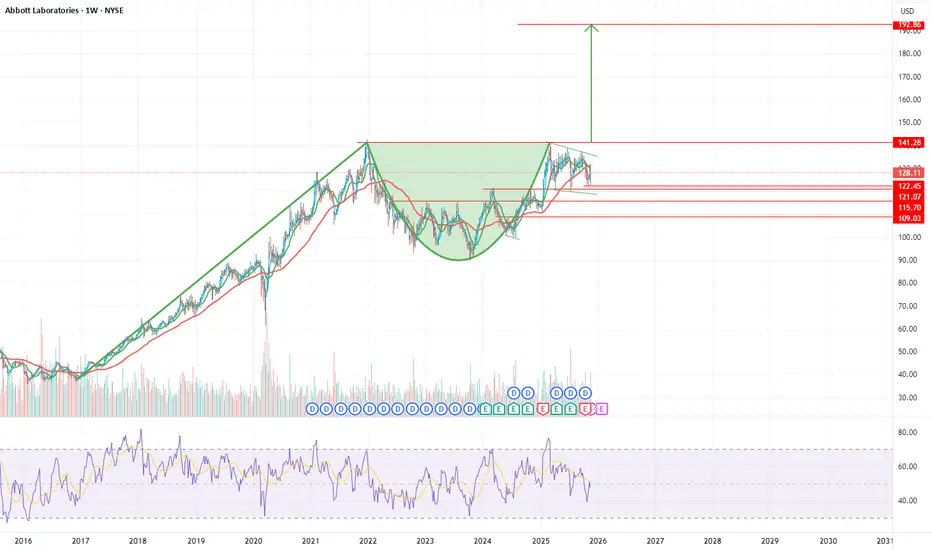
ABT is forming a perfect cup and handle patternNYSE:ABT is looking bullish and has a long term target of 192$, being a long term trade, I will place my stop at 115$ (weekly close).
PS. My view only not financial advice!
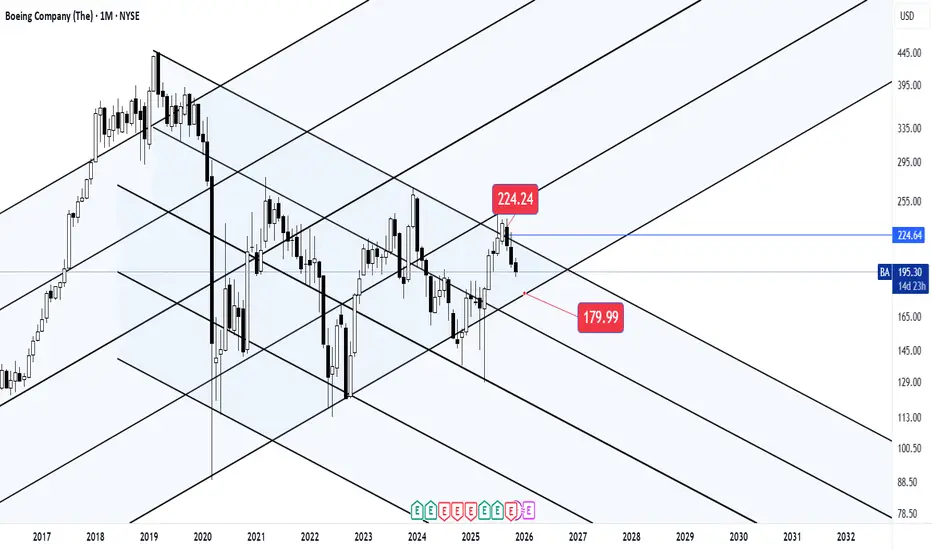
Check out my previous analysis on Boeing :)What I take from this analysis is that we are close to seeing this market share within the range mentioned on the chart!
Good luck!
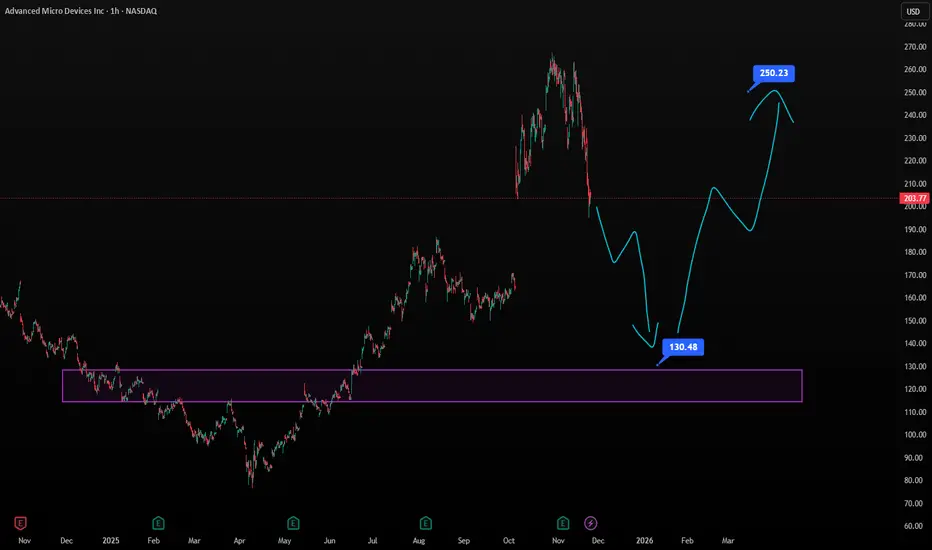
Midterm Stock Forecast for AMDNASDAQ:AMD at $203 shows signs of topping, with H1 momentum rolling over. A decline toward $130 is expected as the market digests high valuations and competitive pressure in AI chips. The $130 zone offers an attractive buy level, with a long-term upside target of $250 once trend reverses.
Midterm Stock Forecast for PalantirNASDAQ:PLTR at $154 maintains a strong accumulation profile, supporting expectations of a rise toward $200. H1 structure remains bullish with higher lows forming. Fundamentally, expanding government contracts and improving commercial AI adoption justify continued midterm optimism.

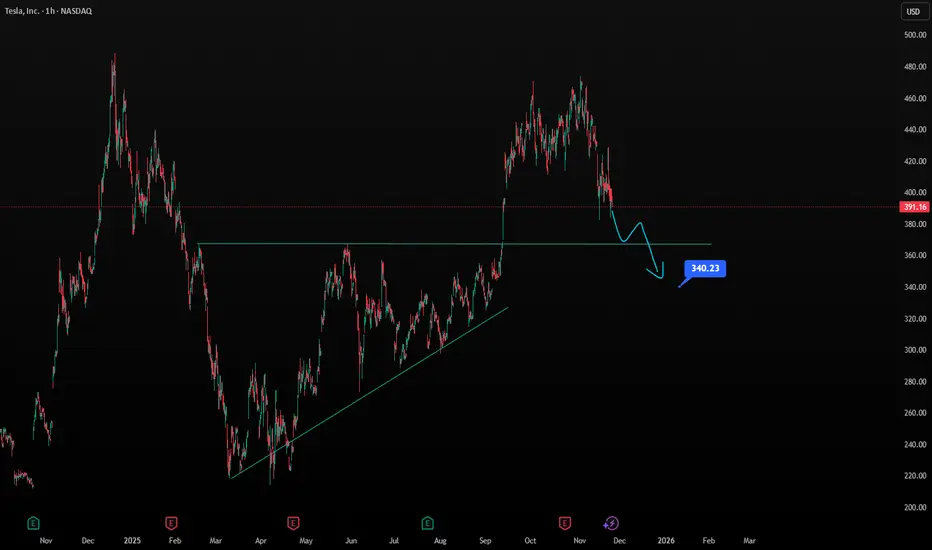
Midterm Stock Forecast for TeslaNASDAQ:TSLA at $391 shows weakening technical structure, suggesting a continuation toward $340. H1 trendlines indicate fading bullish pressure. Fundamentals remain mixed: energy storage grows, but auto margins face pressure and competition intensifies. The $340 zone is a key demand area for potential midterm stabilization.
Midterm Stock Forecast for METANASDAQ:META At $594, Meta enters a buy zone after the sharp decline since late October. H1 technicals show stabilizing momentum. First target stands at $660, and extension toward $760 remains possible if ad revenue and AI-driven engagement trends stay strong. Valuation still supports midterm upside after the recent correction.

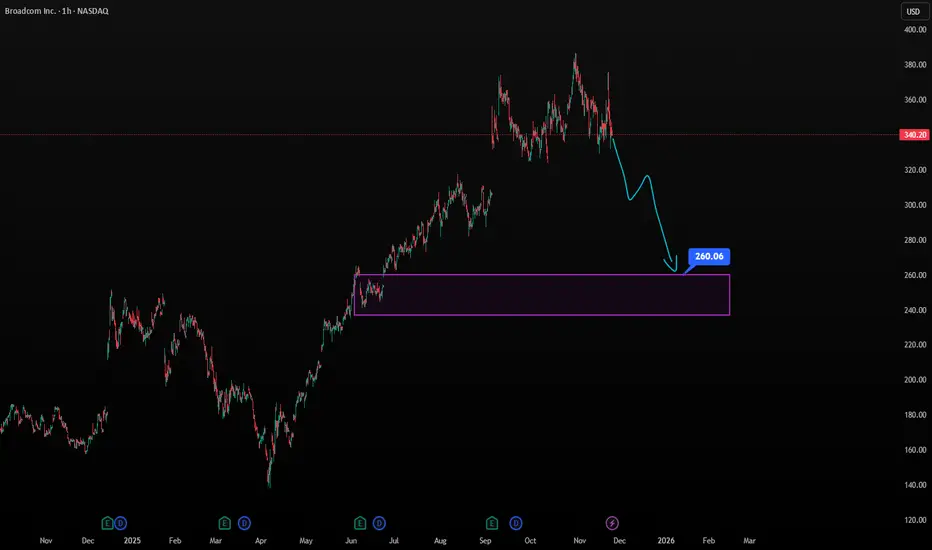
Midterm Stock Forecast for BroadcomNASDAQ:AVGO trades near $340, consolidating after significant gains. A drop below $320 may trigger selling toward $260 as H1 trend support breaks. Conversely, holding current levels and breaking $373 unlocks a move toward $480. Strong semiconductor demand and AI-networking exposure support long-term bullishness despite short-term volatility.