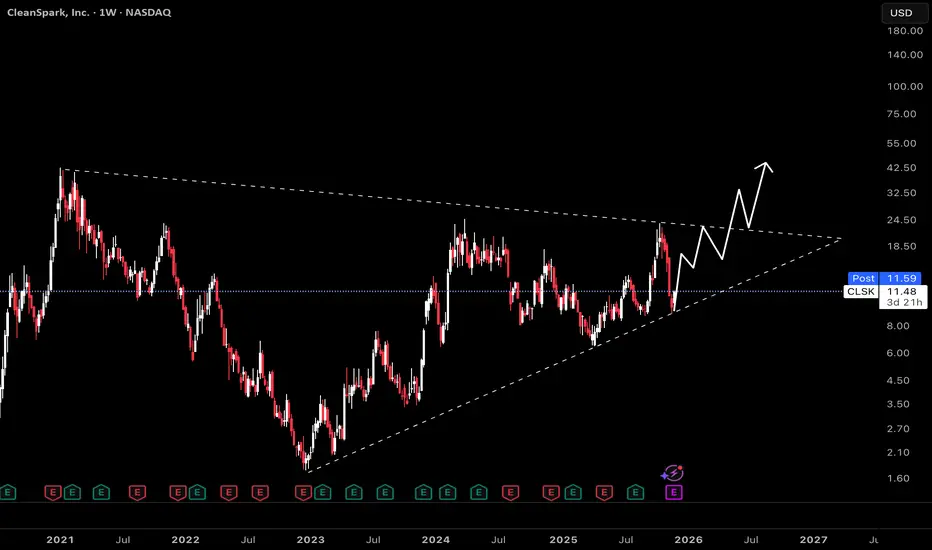
CleanSpark (CLSK): Approaching Triangle BreakoutThis weekly chart tracks CleanSpark, revealing an extended symmetrical triangle formation that has dictated price action since mid-2021. Symmetrical triangles often signal a period of compression in volatility, building up for a breakout as price coils between support and resistance trendlines.
Triangles like this signal indecision, as neither bulls nor bears have established control. The energy stored within the pattern typically results in a significant move once a breakout occurs.
Given the recent bounce off ascending support and renewed momentum, the most plausible scenario is a bullish breakout.
For a short-term opportunity, the upper resistance of the triangle offers a plausible setup for a countertrend trade. If price rallies toward the triangle's descending resistance and stalls, a short position could be initiated with tight risk management. The idea is to sell CLSK at resistance, anticipating that price may be rejected and revert lower within the triangle until a confirmed breakout occurs.
$NASDAQ:HOOD – 5 Waves done, ABC now (Long term roadmap)NASDAQ:HOOD has completed a clean 5-wave impulsive structure into the 153–160 all-time-high supply zone. After topping as Wave 5, price has begun pulling back, forming what appears to be the early stages of a larger ABC correction. Wave A looks completed near the 105 area, and the current move up is likely the developing Wave B retracement.
The B-wave bounce should run into resistance between 122 and 135, where weekly supply and Fibonacci retracements align. Once Wave B exhausts, price is expected to roll over into a Wave C decline, targeting the 80–85 demand zone, with a deeper stretch toward 73–76 if sellers remain strong.
Over the next 1–3 months, the chart favors a B-wave recovery followed by a C-wave drop. Over 6–12 months, if HOOD holds the 73-85 region and forms a higher low, a brand-new impulsive 5-wave bull cycle could begin. If the low fails, the entire bullish structure breaks, shifting the macro trend down.
Key Zones: NASDAQ:HOOD #HOOD
Weekly Supply (B-wave cap): 122 – 135
Monthly Base Support: 95 – 104
Primary C-Wave Demand: 80 – 85
Next leg up Invalidation Levels:
Deep C-Wave / Invalidation Floor: 73 – 76
Bullish Invalidation: Break and weekly hold above 153–160 cancels ABC
Bearish Invalidation: Weekly close below 73–76 kills the long-term bull count
#Robinhood #ElliottWave #ElliottWaveTheory #WaveAnalysis #ABCcorrection #TechnicalAnalysis #1WChart #StockMarketAnalysis #SwingTrading #PriceAction #SupplyDemand #TrendReversal #Investing #NASDAQ #TradingView

NVDA Katy AI Analysis – Neutral, Monitor for BreakoutNVDA QuantSignals Katy 1M Prediction – 2025-11-24
Current Price: $179.09
Final Prediction: $179.64 (+0.30%)
30-min Target: $179.46 (+0.20%)
Trend: NEUTRAL
Confidence: 55%
Volatility: 13.3%
⚠️ Trade Signal:
No trade generated – insufficient confidence and move size
🧠 Analysis Summary:
Katy AI shows minor upside but not enough for actionable entry
Low expected movement implies limited risk/reward opportunity
Traders may monitor for upcoming catalysts or volatility spikes

I'm long SMR. Risk Reward Play.I'm long SMR.
I've always been bullish Nuclear, and I like SMR. My 1 year price target for SMR is about $38.
It has been over-valued for me for a while. But this recent pullback means that I've again been looking for an entry. Today, I made the decision to jump back in.
This is an options play.
The reason I'm going long:
1. On Friday, the price bounced right off the lower trendline - now the 3rd touch to that line. It should be good support now.
2. Volume is dying which usually indicated less interest in sell pressure.
3. The price point is now at the POC which is generally a pretty good support level.
4. We were oversold, then popped out of it today at 30.
Normally, I don't buy calls. I am not a fan of watching the premium decay with time as I wait for the price to reverse. But the premiums were fairly weak to sell puts down at $16-17 where I'd like the stock. So calls it it is.
Similar to DCA'ing into a equity position, I'll do the same with calls sometimes. So to start off, I've only bought one call: a $24 strike for Jan16. The premium was $1.70. I'll explain the rest in the active trade note.

QuantSignals V3: PLTR Weekly Put Play – Strong Bearish Momentum!PLTR Weekly (QuantSignals V3 | 2025-11-24)
Direction: BUY PUTS
Confidence: 60%
Expiry: 2025-11-28 (4 days)
Strike Focus: $148.00
Entry Range: $0.52 – $0.55 (mid: $0.54)
Target 1: $0.85 (≈63% gain)
Target 2: $1.10 (≈100% gain)
Stop Loss: $0.35 (≈35% loss)
Position Size: 2% of portfolio (moderate conviction)
Weekly Momentum: BEARISH (–1.07% 1W)
Put/Call Ratio: 1.01 (Neutral flow bias)
Flow Intel: Neutral, unusual activity at $132 put
Current Price: $162.41
Risk Level: ⚠️ Moderate – elevated VIX (23.43)
📈 Technical Overview
Weekly momentum: BEARISH (–1.07%)
Support: $147.56 (weekly low)
Resistance: $174.57
RSI oversold at 24.0 → continuation possible
MACD histogram confirms downward momentum
Price below session open $170.75 → intraday weakness
Chart Tips:
Draw support at $147.56 and resistance at $174.57
Highlight entry band $0.52–$0.55
Mark targets $0.85 / $1.10 and stop $0.35
Monitor for news that could reverse bearish setup
📰 Fundamental / Sentiment Notes
Mixed news, partnerships announced but selling pressure continues
Institutional positioning suggested by unusual options activity
Katy AI predicts downward target $157.27 → confirms bearish momentum
⚠️ Risk Notes
Katy AI NEUTRAL classification (50% confidence) → conservative sizing
High volatility (VIX 23.43) → premium cost elevated, opportunity exists
4-day expiry → monitor Thursday exit or roll if needed

Lucid is going to pump to $10. Bottom in.My fibs and trend knowledge combined have me thinking lucid will pump to $10. Gpro and lucid are the meme stocks to watch. I know....

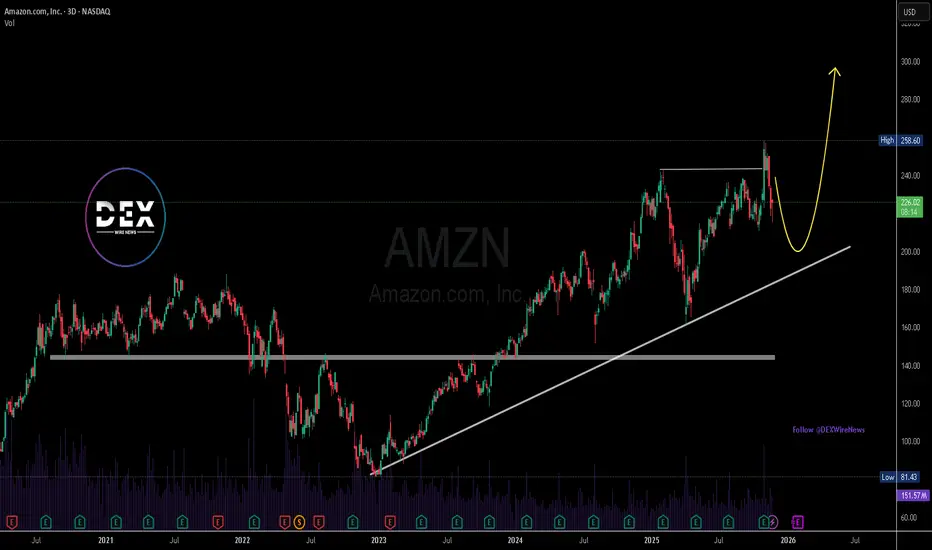
Amazon (NASDAQ: $AMZN) Expands AI Power With $50B GovCloud PushAmazon (NASDAQ: NASDAQ:AMZN ) is strengthening its position in the AI and cloud infrastructure race with a massive pledge of up to $50 billion to expand supercomputing capacity for U.S. government agencies. The investment focuses on building advanced AWS data centers across Top Secret, Secret, and GovCloud regions starting in 2026, adding nearly 1.3 gigawatts of AI and high-performance computing power. With more than 11,000 government customers, AWS aims to widen its lead as AI competition intensifies across cloud providers.
Industry analysts note that Amazon has lost some ground in AI-specific cloud growth to rivals like Google and Oracle. As companies such as Microsoft, OpenAI, and Alphabet pour billions into AI infrastructure, Amazon’s scale-driven investment is a strategic move to ensure AWS remains the backbone of government AI systems.
The new capacity will support federal agencies with a full stack of AI tools—including Amazon SageMaker, Amazon Bedrock, and foundation models like Amazon Nova and Anthropic Claude—allowing them to build customized AI solutions at scale. Analysts expect the U.S. government to accelerate AI adoption as part of its race to maintain technological leadership over China.
Technical Outlook
AMZN is currently pulling back from the $258 resistance, forming a healthy correction toward the $232 support zone, which aligns with a weekly demand level. Bulls will look for a strong reaction here to retest the $258 high and potentially break above it.
A failure at $232 exposes the ascending trendline support that has guided Amazon’s uptrend since early 2023. The RSI cooling off suggests this is a normal correction rather than a trend reversal. If support holds, upside targets between $280–$300 remain valid, matching long-term Fibonacci projections.
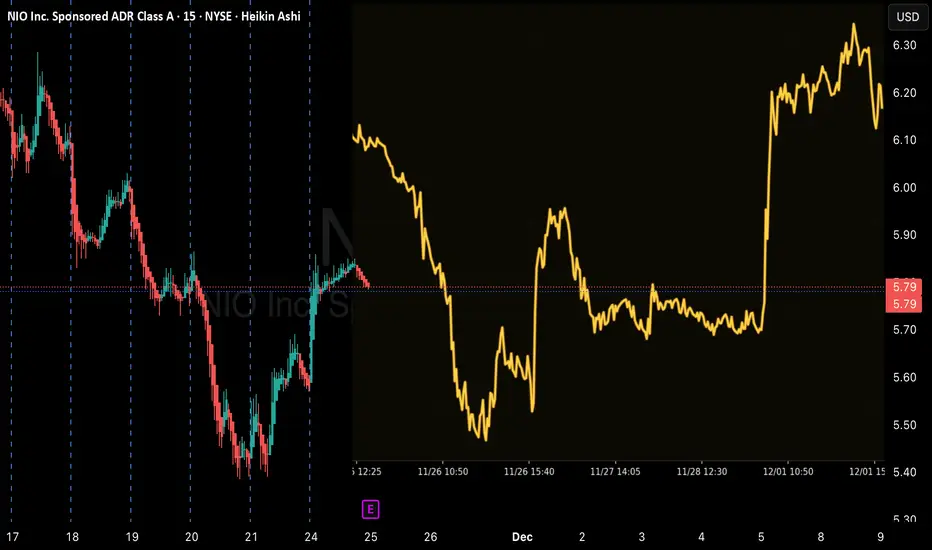
NIO Earnings Breakout Play – High Momentum Setup NIO Earnings (QS V3 | 2025-11-24)
Strategy: Buy Calls (Earnings Play)
Confidence: 65% (Medium)
Expiry: 2025-11-28
Strike: $6.00
Entry: ~$0.18
Target 1: $0.36
Stop Loss: $0.09
📈 Technical Overview
Price: ~$5.82
Range: $5.25 – $5.87 (tight)
RSI: ~22.4 → Oversold
Volume: 1.1× average → Mild interest
Trend Regime: 95.3% → Strong momentum environment
Support: $5.75 (critical – Katy target)
Resistance: $6.00 / $6.12
IV: ~108% → High earnings volatility
Chart Instructions:
Draw support at $5.75.
Draw resistance line at $6.00–$6.12.
Add RSI indicator (watch for >30 breakout).
Mark option entry zone at $0.18–$0.19.
Plot targets $0.36 and $0.54 (extension).
📰 Sentiment / News Summary
High-impact earnings scheduled
Revenue growth reported at 22,347%
Neutral-to-bullish media tone
Whale activity + call volume shows positioning ahead of earnings
🧪 Flow & Volatility
Put/Call Ratio: 0.37 → Strong call buying
Unusual volume at $6C
Elevated IV ~108% (expect wide moves)
High trend regime → amplified breakouts
⚠️ Risk Notes
Katy AI shows neutral → slightly bearish path
Post-earnings drift can invalidate call setup
High IV = potential IV crush
Stick to 2% position size
ZM Earnings Alert — QuantSignals V3 Call RecommendationZM Earnings (QuantSignals V3 | 2025-11-24)
Direction: BUY CALLS
Confidence: 58%
Expiry: 2025-11-28 (4 days)
Strike Focus: $80.00
Entry Range: $2.82 – $3.05 (mid: $2.93)
Target 1: $4.23 (50% gain)
Target 2: $5.49 (95% gain)
Stop Loss: $2.05 (30% loss)
Position Size: 2.5% of portfolio
Implied Move: $6.08 (~7.6%)
24h Price Move: –5.52%
Put/Call Ratio: 0.83 (Neutral)
Flow Intel: Neutral
Risk Level: 🔴 High Risk — small size recommended
Earnings Date: 2025-11-24 | Estimate: $1.48
📈 Technical Overview
Current Price: ~$79.87
Support: $77.42
Resistance: $84.46
RSI: Oversold / bounce potential
Volume: 1.6× average → elevated pre-earnings activity
Trend: Moderate bullish momentum after selloff
Chart Tips:
Draw support at $77.42 and resistance at $84.46
Highlight option entry band $2.82–$3.05
Mark targets $4.23 / $5.49 and stop $2.05
Monitor RSI and post-earnings volatility
📰 Fundamental / Sentiment Notes
Earnings released today
Revenue growth: +1250%
Fed dovish remarks support tech
Neutral news sentiment but oversold technicals provide bounce opportunity
⚠️ Risk Notes
High implied volatility (VIX 23.43)
Moderate conviction due to pre-earnings selloff
Break below support $77.42 invalidates bullish thesis
$ALAB just tapped the Golden 618 fibALAB heavily into AI reported very strong earnings and is down $130 and just tapped the 618 golden Fibonacci level support

$COIN: Wave 2 correction may have been completedNASDAQ:COIN : Completed a higher degree 5-wave sequence and pulled back during the 2021-2022 bear market.
From the 2022 bottom, a new 5-wave sequence has started. Wave I and II finished in April 2025. Wave 1 completed in the most recent high and we have been in Wave 2 correction since.
This correction has reached 61.8% retracement as well as AB=CD target. It's very likely that Wave 2 correction has ended.
I added to my position.

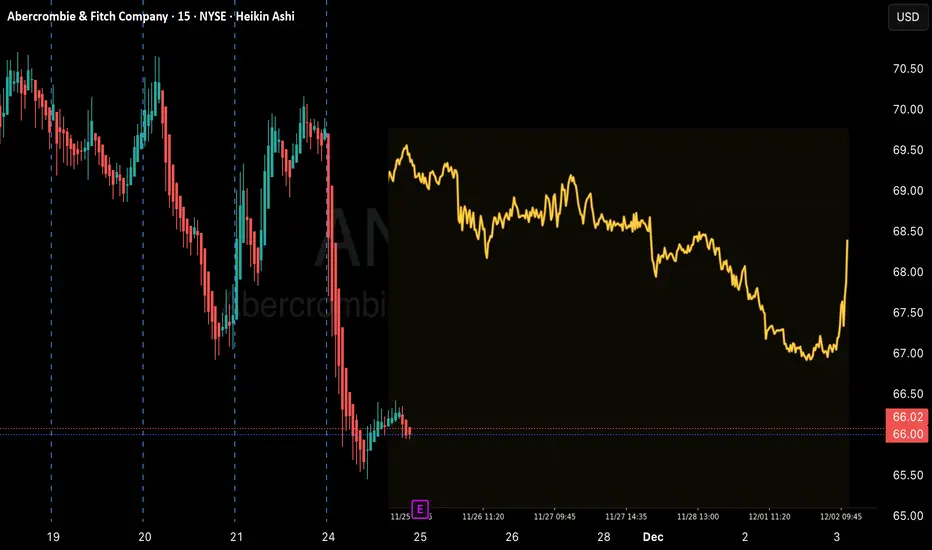
QuantSignals V3: ANF Oversold Earnings ReversalANF Earnings (QuantSignals V3 | 2025-11-24)
Direction: BUY CALLS
Confidence: 58%
Expiry: 2025-11-28 (4 days)
Strike Focus: $66.00
Entry Range: $4.30 – $4.60 (mid: $4.45)
Target 1: $6.68 (50% gain)
Target 2: $8.90 (100% gain)
Stop Loss: $2.67 (40% loss)
Position Size: 2% of portfolio
Implied Move: $8.75 (~13.2%)
24h Price Move: –6.38%
Put/Call Ratio: 1.05 (Neutral)
Flow Intel: Neutral
Risk Level: 🔴 High Risk — small size recommended
Earnings Date: 2025-11-24 | Estimate: $2.18
📈 Technical Overview
Current Price: ~$66.14
Support: $65.45
Resistance: $70.98
Oversold conditions → potential bounce
Volume: 0.2× average → light positioning
Trend: Bullish momentum predicted by Katy AI (despite neutral/PUTS classification)
Chart Tips:
Draw support at $65.45 and resistance at $70.98
Highlight option entry band $4.30–$4.60
Mark targets $6.68 / $8.90 and stop $2.67
Watch for post-earnings price movement
📰 Fundamental / Sentiment Notes
Earnings scheduled today
Revenue growth: +1294%
Mixed news sentiment
Light volume → low conviction, but bullish AI prediction supports call
⚠️ Risk Notes
Moderate risk due to earnings volatility and 4-day expiry
Katy AI overrides initial BUY PUT classification → shows bullish trajectory
Small position sizing recommended
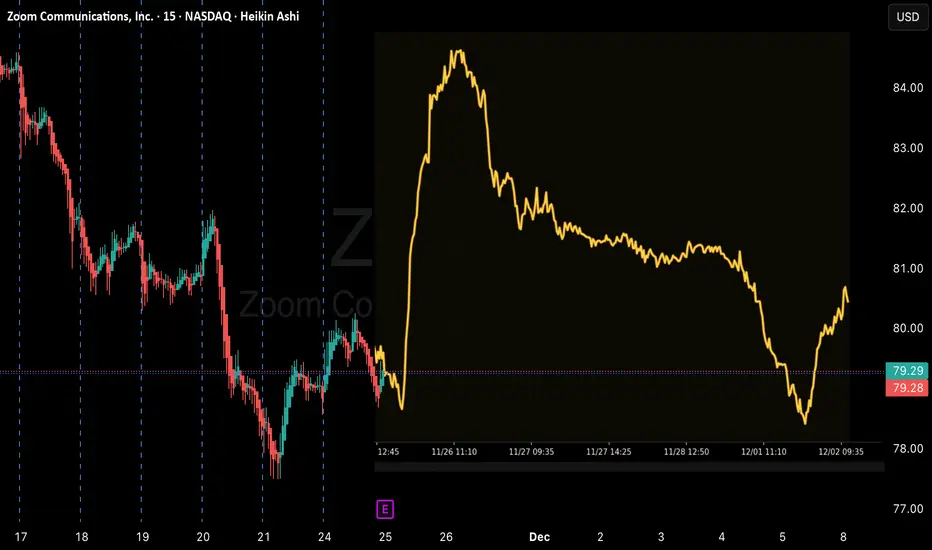
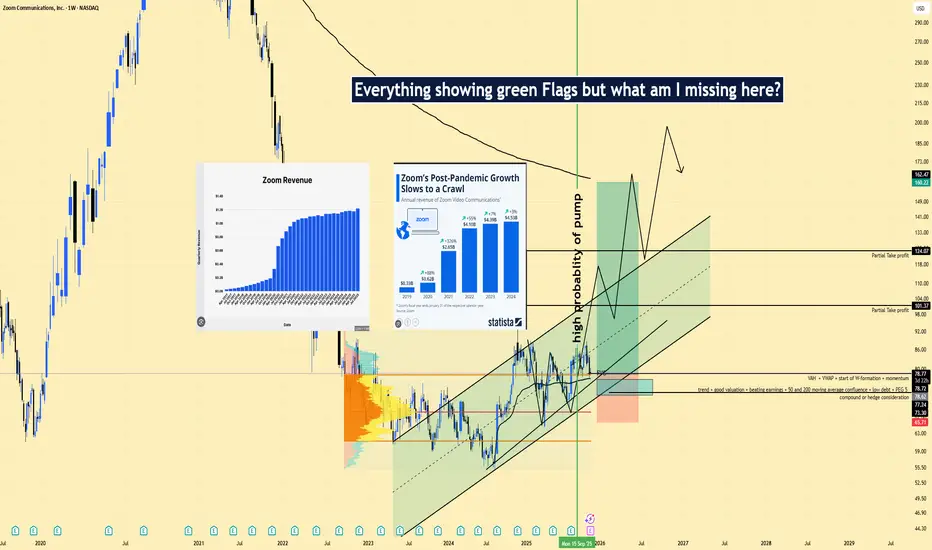
ZM | Long Setup | Re-Rate on AI UCaaS/CCaaS Pivot | Nov 24, 2025ZM | Long Setup | Range-to-Trend Re-Rate on AI UCaaS/CCaaS Pivot | Nov 24, 2025
🔹 Thesis Summary
Zoom is exiting a two-year base and riding a rising channel as the mix shifts from “meetings” to a broader AI-enabled UCaaS/CCaaS stack. If growth stabilizes and margins hold, a multiple re-rate from ~13x fwd EPS is plausible into 2026.
🔹 Trade Setup
Bias: Long
Entry Zone: $76–$81 (value area/POC ≈ $79)
Stop Loss: $68.5 (below channel base & prior swing lows)
Take-Profits:
TP1: $101.4
TP2: $118.5
TP3: $124.1
Max Target: $160–$165
🔹 Narrative & Context
Structure: Weekly rising channel since 2023 with a completed W-formation; price keeps reclaiming the VAH ~ $79 with positive reactions near value area lows.
Quality of sponsor base: ~77% institutional ownership with >1,000 holders; consistent EPS beats on the most recent quarters and revenue holding near $1.1–$1.2B/qtr.
Product mix shift: Zoom Phone + Contact Center (CCaaS) + AI Companion reduce dependence on commoditized meetings and increase seat/ARPU durability.
Seasonality/flow: 2025 YTD underperformed vs. 2023–2024; mean-reversion tailwind into Dec–Jan is typical for profitable software after weak YTD prints.
🔹 Valuation & Context (Pro Metrics, framed simply)
Forward P/E ≈ 13.3x vs. large-cap software ~24–28x → market prices Zoom like a no-growth asset → if CCaaS/Phone sustain mid-single-digit top-line and stable margins, the discount can narrow—this is the re-rate upside.
P/FCF ≈ 12.8x vs peers high-teens to 20s → cheaper cash generation → supports buybacks and tuck-ins during the pivot.
Quality: ROE ~13.6% / ROIC ~13.2%, Quick Ratio ~4.4 → solid balance sheet, self-funded transition.
Growth: EPS past 5Y +106%, Sales past 5Y +49.6% → post-pandemic decel but still compounding; stability matters more than acceleration for a re-rate.
Risk: Debt/Equity ~0.0x → low leverage limits downside in macro shocks.
🔹 Contrarian Angle (Your Edge)
Consensus still frames ZM as a stagnant “meetings” play. The tape shows accumulation within an ascending channel and improving mix economics. A shift from 13x → 18–20x fwd on steady EPS supports $120–$160 over the next 12–18 months—well above many cautious targets.
🔹 Risks (balanced)
Earnings gap risk & guide sensitivity (event tonight) could pierce the stop before trend resumes.
Competitive bundling from MSFT/GOOGL pressuring seat growth and pricing.
Execution risk scaling CCaaS/AI while protecting margins and security posture.
🔹 Macro Considerations
NDX / 10-Year yields: ZM correlates with duration-sensitive software—lower yields aid the re-rate; rising DXY/yields would cap multiples.
IT spending cadence: Enterprise budget resets (Q1CY) and procurement softness could stall seat adds.
Volatility/hedging: Elevated IV around earnings; consider staged entries or collars/call-spreads if taking exposure into the print.
🔹 Bottom Line
ZM screens inexpensive on forward and FCF multiples with a strong balance sheet and a credible path to mix-led stabilization. The weekly structure offers a defined-risk long from value, aiming for a re-rating toward $120–$160 as CCaaS/AI execution compounds.
🔹 Forward Path
If this post gains traction, I’ll follow up with: (1) weekly/quarterly re-maps of the channel and volume shelves, (2) updates on breakout/invalidations vs. $97/$101/$118/$124, (3) commentary on post-earnings guide and margin cadence.
Like & Follow for structured ideas, not signals. I post high-conviction setups here before broader narratives play out.
⚠️ Disclaimer: This is not financial advice. Always do your own research. Charts and visuals may include AI enhancements.
🔹 Footnote
Forward P/E: Price divided by expected earnings over the next 12 months. Lower = cheaper relative to profits.
P/FCF (Price-to-Free-Cash-Flow): Price vs. the cash left after investments. A measure of efficiency.
FCF Yield: Free cash flow per share ÷ price per share. Higher = more cash returned for each dollar invested.
ROE (Return on Equity): Net income ÷ shareholder equity. Shows management efficiency with investor capital.
ROIC (Return on Invested Capital): Net income ÷ all invested capital (equity + debt). A purer profitability gauge.
Debt/Equity: Debt divided by equity. <1 usually means balance sheet is conservative.
R:R (Risk-to-Reward): Ratio of expected upside vs. downside. 3:1 = you risk $1 to make $3.
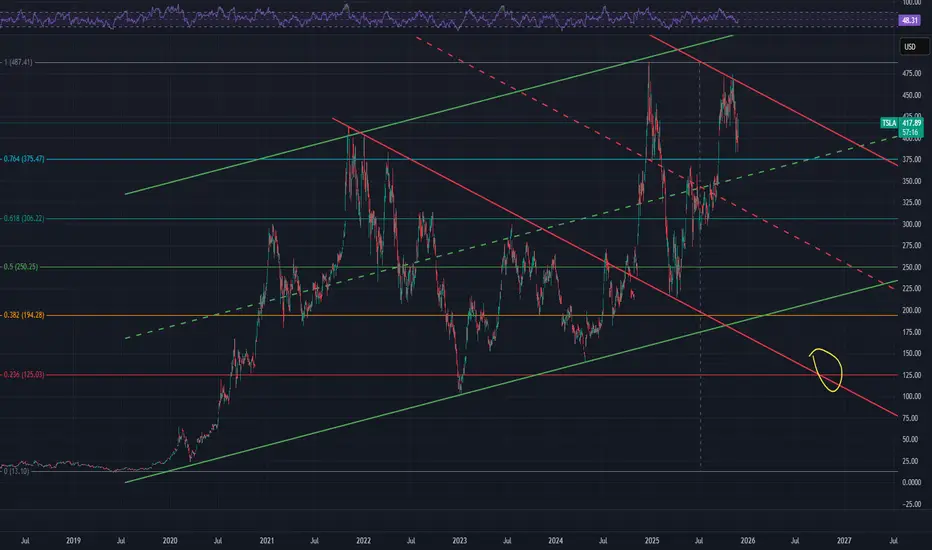
TSLA going back to 120$ in late 2026 ?I just want to put this idea out there.
Seems insane, but stranger things have happened.
Will come back in a year and see if these channels really have been planned for a long time.
MRkStock: Merck & Company (MRK) – NYSE
Timeframe: 1H (short–to–mid term outlook)
Current Situation
The stock is trading around 85.16 – 85.33.
It has broken out of a long descending channel (yellow zone), signaling a potential trend reversal to the upside.
Suggested entry on the chart: Buy at 84.80 with a stop loss at 72.
Targets
Target Zone 1: 92.93 – 93.35
First major resistance area.
Good level for partial profit-taking.
Target Zone 2: 106.81 – 109.72
Strong resistance and confirmation of a mid-term uptrend continuation.
Target Zone 3: 116.16 – 120.31
Key historical resistance.
A breakout above this range could trigger a much larger bullish wave.
Risk Management
Stop Loss: 72 (below the last swing low – breaking it invalidates the bullish scenario).
Risk/Reward Estimate:
Entry 84.80 → First target 93 = ~+10%.
Potential downside to stop loss = ~–15%.
Best approach: scale out – take partial profits at target 1, let remaining shares ride toward higher targets.
Technical Notes
Breakout from the downtrend channel = bullish signal.
Recent formation of higher lows supports upward momentum.
Strong support lies in the 80 – 82 range.
✅ Conclusion:
MRK shows signs of reversal and recovery after a prolonged downtrend. Buying around 84.80 is valid with a strict stop at 72. First target is 93, then 107, with a potential extension toward 116–120 if bullish momentum continues.

venture globalManaged to enter low position in VG. We shall see how the stock trades, tight stops, but will be watching intently for the next few days to see how it trades in these lower ranges. Has a chance to drop more, But i see opportunity in the now of buying low.

LENTechnical Analysis – LEN (Lennar Corp.)
Current Price Action:
The stock is trading at $137.27, showing a recovery after a strong bounce from the uptrend line.
Price is now facing a supply zone around $137–$150, which may act as near-term resistance.
Major Trend:
The chart shows a long-term uptrend (black trendline), intact since 2020.
Each correction has respected this trendline, confirming bullish market structure.
Support Levels:
First key support: $124.38 – aligns with the horizontal demand zone.
Major trendline support: currently rising around $120.
Critical support / Stop loss: $97.28. A close below this level would break the long-term bullish structure.
Resistance & Supply Zone:
The current supply zone between $137–$150 is the first strong resistance.
Price may consolidate or pull back before attempting a breakout.
Clearing this supply zone would open the way toward the previous high ($191.86).
Target Levels:
Short-term target: Retest of $150 (upper bound of supply zone).
Mid-term target: $191.86 (previous high).
If price sustains above $192, Lennar could make new all-time highs.
Trading Outlook:
Best strategy is to wait for a correction toward $124–$120 (near the uptrend line) for optimal entry.
Entering directly at $137 carries higher risk due to supply zone pressure.
Keep stop-loss at $97 to protect from downside risk.
Conclusion
Lennar (LEN) is in a major long-term uptrend. Current price is inside a supply zone ($137–$150), so the risk of a pullback is high. The best entry opportunity is on a correction toward $124–$120 near the uptrend line, with a target of $191+. Long-term bullish structure remains valid as long as the stock holds above $97.

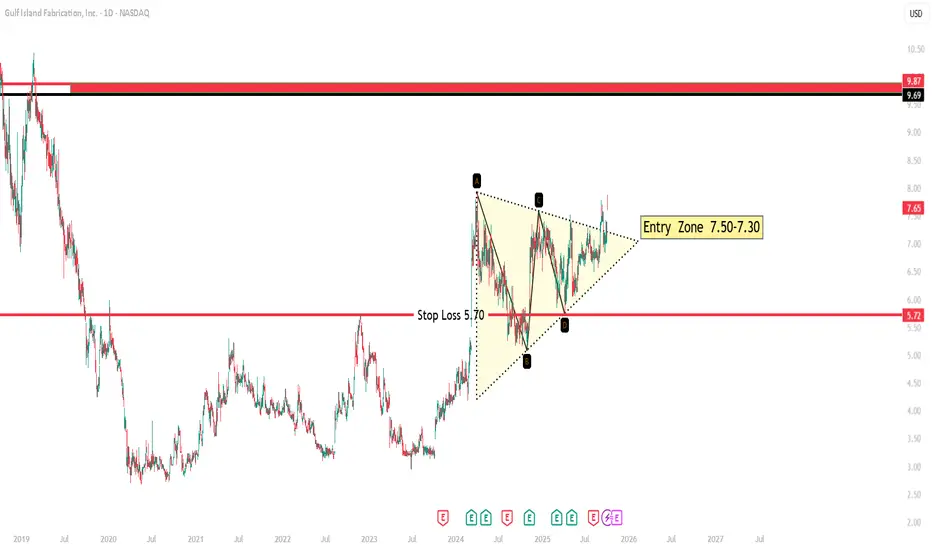
GIFITechnical Analysis – Daily Chart Overview
🔷 Pattern Structure: Symmetrical Triangle Breakout
The stock has formed a symmetrical triangle pattern, marked by points A-B-C-D, typically signaling a continuation or breakout move.
The recent breakout above the triangle's resistance trendline indicates a bullish momentum shift.
🟨 Entry Zone: $7.30 – $7.50
Price is currently in the highlighted entry zone, which aligns closely with the triangle breakout level.
This area offers a high-probability entry for traders looking to catch a move early after consolidation.
The volume confirmation (not shown but assumed based on pattern behavior) would strengthen this breakout’s reliability.
📉 Stop Loss: $5.70
A logical stop-loss level is placed below the recent swing low and the lower triangle support.
$5.70 marks invalidation of the bullish structure, minimizing downside risk if the breakout fails.
This also protects against a false breakout or retest failure.
🎯 Target Zone: $9.69 – $9.87
The next significant resistance level lies in the range of $9.69 to $9.87, a strong supply zone from 2018–2019.
If momentum continues, price could revisit this zone, offering a potential upside of ~28%–32% from current levels.
🔧 Technical Summary
Component Level/Zone Observation
Pattern Symmetrical Triangle Breakout confirms bullish bias
Entry Zone $7.30 – $7.50 Ideal buy zone after breakout
Stop Loss $5.70 Below pattern low – risk management level
Target Zone $9.69 – $9.87 Previous major resistance – potential profit area
Bias Bullish Post-breakout structure with volume confirmation
📌 Conclusion
Gulf Island Fabrication (GIFI) is showing strong bullish signs after a textbook triangle breakout, with clean support and resistance levels. The risk-to-reward ratio is favorable, especially with a tight stop and a clearly defined target zone.
This setup is suitable for swing traders or position traders looking to capitalize on medium-term momentum. Monitoring volume and price action around the $8.00 level will be key to gauging the strength of the breakout continuation.
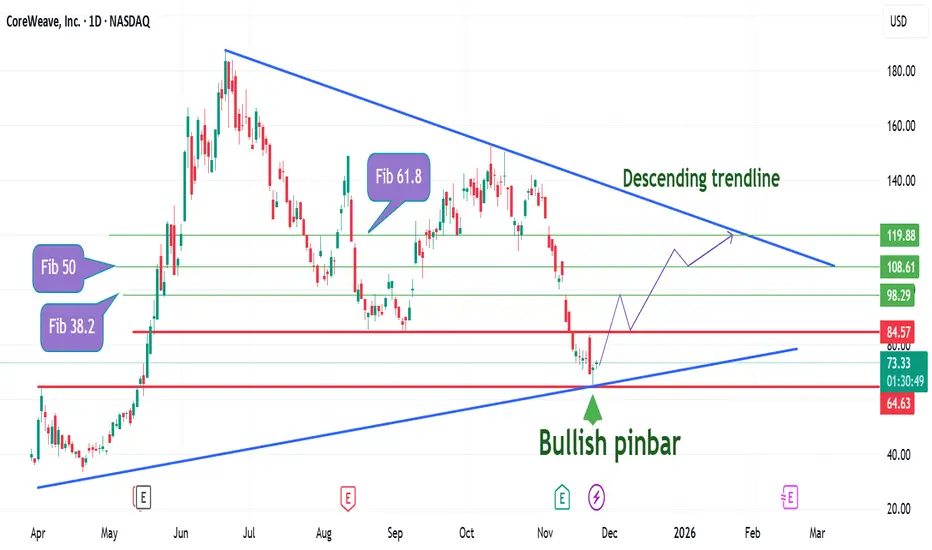
CoreWave Inc. Technical Analysis and Mid-Term OutlookCoreWave Inc. Technical Analysis and Mid-Term Outlook
CoreWave Inc. has reacted to a key confluence zone formed by horizontal support and an ascending trend line.
A bullish pin bar has also developed at this confluence area, as shown on the chart. This pattern is an important price-action signal and may indicate potential upward momentum.
My Technical Outlook:
I expect buying pressure at the current market price (CMP) to push above the next resistance zone aligned with the 23.6% Fibonacci retracement level. If price successfully breaks and sustains above this level, the asset may advance further toward the descending trend line highlighted on the chart.
This setup aligns with a mid-term to multi-month trade outlook, given the presence of three significant Fibonacci levels within this projected move.
Trade Potential: 16% – 60%
I am ridding of the CMP
As always, caution is advised when navigating market volatility and key reaction zones.
Quant Signals V3: MSTR Downside Momentum TradeMSTR Weekly (QuantSignals V3 | 2025-11-24)
Direction: BUY PUTS
Confidence: 65%
Expiry: 2025-11-28 (4 days)
Strike Focus: $167.50
Entry Range: $6.75 – $7.15 (mid: $6.95)
Target 1: $10.73 (≈60% gain)
Target 2: $13.43 (≈100% gain)
Stop Loss: $4.85
Position Size: Medium / reduce due to moderate confidence
Weekly Momentum: NEUTRAL (–0.08% 1W)
Put/Call Ratio: 2.13 (Bearish)
Flow Intel: Bearish / institutional put buying
Risk Level: ⚠️ Moderate – conflicting signals
Current Price: ~$173.06
📈 Technical Overview
VWAP: $177.30 → price below VWAP suggests potential downside
Weekly range position: 23.1% → room to move down
Support: $166.00 (session low)
Resistance: $177.30 (VWAP)
24h Price Move: –6.46%
Trend: Conflicting signals — Katy AI bullish prediction vs bearish flow & news
Chart Tips:
Draw support at $166.00 and resistance at $177.30
Highlight entry band $6.75–$7.15
Mark targets $10.73 / $13.43 and stop $4.85
Monitor Bitcoin correlation and news catalysts
📰 Fundamental / Sentiment Notes
Bearish news pressure: BTC –6.4%, JPMorgan caution
Sector uncertainty, Michael Saylor defense statements
Options flow shows strong institutional put buying
⚠️ Risk Notes
Conflicting signals: Katy AI bullish vs bearish technicals & flow
Medium conviction → consider smaller position size
Monitor for volatility spikes around crypto-related news

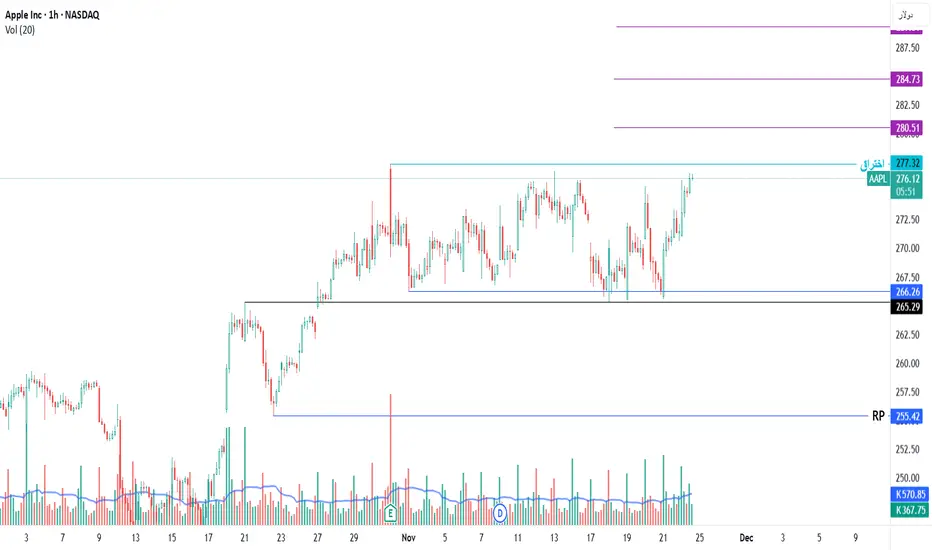
$AAPL 275$NASDAQ:AAPL 275$ 💥
18-month prison? EXPLODED past 277.32 & never back 🔥
270-272 = shorts graveyard 🪦
109K dip? Rocket fuel loading 🧨
277.32 about to blow again..
300 in a blink 🎯
Run or cry blood 😈🍏
Momentum Breakout Swing Trade (Strong Growth + Sector Leadership🎯 Ticker: LRCX (NASDAQ)
📈 Type: Swing Long
⏰ Timeframe: Daily & 4H
📊 Technical & Momentum Analysis:
Trend Structure: BULLISH Daily & 4H Trends ✅
Momentum Signal: CONNORS RSI2 BUY (Active 14-17 Nov)
Key Level: Breaking above $150 psychological resistance
Sector: Semiconductor Equipment Leader
💡 Trading Thesis:
LRCX offers a powerful momentum + fundamental growth setup:
STRONG FUNDAMENTAL GROWTH (Score: 5/9):
Revenue Growth: +23.7% ($18.44B → $14.91B)
Earnings Growth: +40.0% ($5.36B → $3.83B)
Strong Growth rating in both categories
Healthy Debt: Score 10/10 with manageable leverage
MOMENTUM CONFIRMATION:
Active Connors RSI2 Buy signals indicate bullish momentum
Breaking above key $150 resistance level
Semiconductor equipment cycle acceleration
SECTOR TAILWINDS:
Leading provider of wafer fabrication equipment
Critical enabler of AI chip production
Benefiting from global semiconductor capex expansion
⚡ Trading Plan:
🎯 Entry: $51.90 (Momentum breakout level)
🛑 Stop Loss: $134.00 (Below major support & 200-day MA)
💰 Profit Target: $187.28 (Measured move to next resistance)
📊 Risk/Reward Ratio: 1:2.0 (Strong for growth stock)
📉 Risk Management Notes:
Wide stop accounts for semiconductor stock volatility
Consider partial profit taking at $175-180 zone
Position size for 2% maximum portfolio risk
Monitor SOXX (Semiconductor Index) for sector direction
Be aware of earnings date for increased volatility
🚀 Growth Catalysts:
AI chip manufacturing expansion
Advanced node technology transitions
Memory capex recovery cycle
Geographic supply chain diversification
Conclusion: LRCX presents a compelling momentum breakout setup with strong fundamental growth and sector tailwinds. The active Connors RSI2 signals combined with technical breakout above $150 create a high-probability swing trade opportunity.
Ride the semiconductor wave!
Disclaimer: This is not investment advice. Conduct your own research and manage risk appropriately. Semiconductor stocks carry higher volatility.
#LRCX #SwingTrading #Long #Semiconductors #ChipEquipment #ConnorsRSI2 #TechnicalAnalysis

QS V3 Earnings Alert: SYM Oversold Bounce SetupSYM (Earnings Signal, QS V3 | 11/24)
Ticker: SYM
Strategy: Buy Call Options
Confidence: 58% (Medium)
Expiry: 2025-11-28
Strike Price: $52.00
Entry Range: $6.90 (ideally between ~$6.90)
Target 1: $10.35
Target 2: $13.80
Stop Loss: $4.83
Implied Move Ahead of Earnings: ~$10.45 (≈ 18.9%)
24h Price Move: +2.35%
Flow Context: Bullish (Put/Call Ratio ~ 0.54)
Risk Level: High — Use only small position size
📌 Technical & Fundamental Notes
Current Price (pre-earnings): ~$55.27
RSI: ~20.4 → Oversold condition
Range: Intraday range ~$48.58–$59.45
Support Level: ~$52.00
Resistance Level: ~$59.45
IV (Implied Volatility): ~225% → Very high
Catalyst: Earnings today, estimate ~$0.11
Volume: Light (0.1× average) → Low conviction
Fundamental Note: +618% revenue growth but historical average earnings miss ~-15.3%.
Bias Conflict: AI (Katy) is NEUTRAL/BEARISH (target ~$52.99) but we’re recommending CALLS due to technical / flow / fundamental contrarian setup.
🧮 Charting Considerations (TradingView)
Draw support line around $52.00.
Draw resistance line at ~$59.45.
Mark entry band for the option price ~$6.90.
Mark stop loss at ~$4.83 and targets at ~$10.35 / ~$13.80.
Plot RSI indicator to monitor oversold bounce.
Add IV Rank/IV Percentile indicator to show elevated volatility (~225%).
Use Annotation Text: “High IV + earnings catalyst. Contrarian bullish call setup. Small size only.”
