GM | New All Time Highs Incoming Before the Drop | LONGGeneral Motors Co. engages in the designing, manufacturing, and selling of trucks, crossovers, cars, and automobile parts, and in providing software-enabled services and subscriptions. It operates through the following segments: GMNA, GMI, Cruise, and GM Financial. The company was founded by William C. Durant on September 16, 1908 and is headquartered in Detroit, MI.

SNOW 4 HRThis chart shows the price action of Snowflake Inc. (SNOW) on the 4-hour timeframe, with a combination of trendlines, support zones, a gap zone, and a projected bearish region marked in orange for visual guidance.
1. Overall Trend Context
The recent price movement shows a sharp decline from a previous high, followed by a retest attempt that failed and continued downward.
The chart uses dotted trendlines to outline potential directional paths.
2. Fib-Based Rejection Zone (Top Arc Area)
Above the current structure, semi-circular colored arcs (Fib-style fan/arc) highlight where price previously faced resistance.
This area shows:
A cluster of curved resistance levels
The point where the decline began
A strong rejection, confirming selling pressure at those levels
3. First Support Zone (Mid-Level)
Labeled “1st support”, this is the first major area where buyers might attempt to stabilize the price.
Located just beneath the current price
Highlighted in green and brown shading
Suggests a potential bounce zone if momentum slows
4. Second Support Zone (Deeper Level)
Below the first one, “2nd support” marks a wider structural support.
Represents a deeper potential retracement
This region aligns with previous price interactions
Acts as a more significant level if the downtrend continues
5. Gap Area (Earlier in the Chart)
A rectangular “GAP” box on the left shows an earlier price gap.
Price moved up too quickly, leaving an imbalance
Gaps often act as magnets for price
The dotted lines connect this gap to future possible interaction points
6. Bearish Zone (Lower Right Red Area)
A wide red wedge labeled “bearish” shows the projected zone where sentiment becomes significantly negative.
Positioned between ~186–200
Indicates a key downside level where the chart's structure turns into a clearly bearish outlook
Highlighted with red shading and dotted boundaries
7. Trendline Structure
Multiple orange dotted trendlines illustrate
Possible upward recovery paths
Possible continued downward pressure
Long-term diagonal supports and resistances extending into the future
These lines help visualize potential direction depending on how price reacts at each support.

FER | Highway and Freeway Construction will Rise | LONGFerrovial SE provides infrastructure construction and transportation services. It offers all kinds of services related to urban and interurban transport infrastructure, either by land, sea or air. The company was founded by Rafael del Pino y Moreno on December 18, 1952 and is headquartered Amsterdam, the Netherlands.

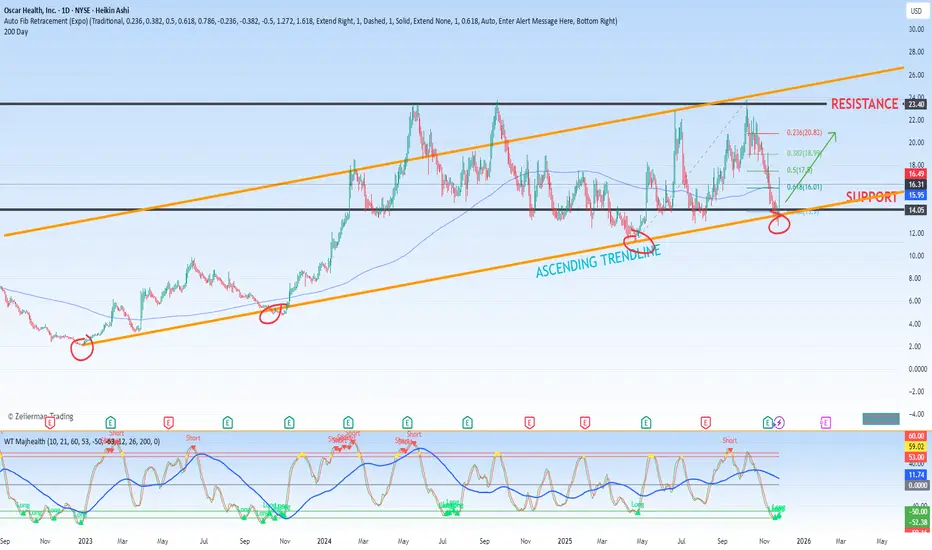
$OSCR IS TOO CHEAP AND UNDERVALUED Oscar Health Rides a Wave of Political Optimism, Emerging as a Top Performer
Oscar Health (NYSE: OSCR) solidified its position as one of the market's standout gainers on Monday, propelled by a surge of optimism stemming from unexpected developments in Washington D.C. The catalyst for this upward move was an announcement from the Trump administration indicating a potential compromise to extend crucial Affordable Care Act (ACA) subsidies for a temporary period.
This news served as a powerful positive shock to the market, directly addressing a primary concern that has weighed heavily on Oscar Health's stock for weeks. During the government shutdown throughout October and early November, investor sentiment was dampened by the fear that political gridlock would prevent the extension of these vital premium subsidies. Such an outcome would have created significant headwinds for Oscar's core business model, which is heavily leveraged to the ACA marketplace.
While it is critical to note that, like many of its peers in the health insurance sector, Oscar's share price remains substantially below its October highs, this latest political development injects a much-needed glimmer of hope. It suggests that the worst-case scenario of an immediate subsidy cliff may be averted, providing the company with a more stable, albeit temporary, operational runway.
Technical Analysis and Market Outlook
From a chart perspective, this fundamental catalyst appears to be triggering a technically significant price movement. The stock is currently exhibiting the early characteristics of a potential reversal pattern, breaking a prior sequence of lower highs and lower lows. This bullish momentum, fueled by the positive news, suggests that the established support and resistance levels remain critically valid and are now being tested with renewed conviction.
For investors and traders, this confluence of a positive fundamental catalyst and a budding technical reversal pattern presents a compelling case. The stock, which many perceive as fundamentally undervalued after its sharp decline, may now be entering a phase of re-rating. The key for sustaining this upward trajectory will be for the price to firmly hold above recent support levels and challenge the next layers of overhead resistance, confirming that this is more than a short-lived relief rally and the beginning of a more sustained recovery.
Nio Inc. (NIO) Shows Early Signs of a Potential Trend ReversalA technical review of Nio Inc. (NIO) suggests the electric vehicle manufacturer may be in the early stages of a significant chart reversal. After a prolonged period of downward pressure or consolidation, the price action is beginning to exhibit classic characteristics of a potential bullish turnaround. Key indicators, which may include a break above a minor downtrend resistance line, stabilizing volume patterns, or emerging bullish candlestick formations, are contributing to this constructive outlook.
Trading Strategy & Key Levels
For traders considering a position based on this potential reversal setup, the current zone appears to offer a favorable risk-to-reward profile for entry.
Entry & Stop-Loss: A strategic stop-loss order is recommended just below the recent swing low, placed at $5.50. This level acts as a critical invalidation point; a breach below it would likely negate the current reversal hypothesis and signal a resumption of the prior downtrend.
Primary Profit Targets: The initial take-profit target is set at $6.00, a level that may have previously acted as resistance. The secondary and more ambitious target is at $6.40, which represents a more significant technical hurdle. Taking partial profits at the first target is a prudent strategy to manage risk.
The Bullish Scenario: A Breakout to Higher Ground
Should the bullish momentum continue to build and the price convincingly breaks above the $6.40 resistance level—particularly on high volume—it would signal a substantial shift in market structure and a confirmation of stronger bullish conviction. In this scenario, the next major resistance zone comes into focus around $7.50, representing a longer-term objective for the reversal pattern.
Conclusion
While the nascent reversal pattern in Nio is technically promising, it is not without risk. The setup suggests a potential long opportunity with a clearly defined invalidation point at $5.50. A disciplined approach, adhering to these key levels, is essential for navigating this speculative yet potentially rewarding trade setup.

WYNN | This Casino Will Make Money As Gambling Rises | LONGWynn Resorts Ltd. is a holding company, which Wynn Resorts Ltd. is a holding company, which engages in the design, development, and operation of destination casino resorts. It operates through the following segments: Wynn Palace, Wynn Macau, Las Vegas Operations, Encore Boston Harbor, and Corporate and Other. The company was founded by Stephen Alan Wynn, Elaine P. Wynn, and Kazuo Okada in 2002 and is headquartered in Las Vegas, NV.engages in the design, development, and operation of destination casino resorts. It operates through the following segments: Wynn Palace, Wynn Macau, Las Vegas Operations, Encore Boston Harbor, and Corporate and Other. The company was founded by Stephen Alan Wynn, Elaine P. Wynn, and Kazuo Okada in 2002 and is headquartered in Las Vegas, NV.

HPQ HP Options Ahead of EarningsIf you haven`t sold HPQ before the previous earnings:
Now analyzing the options chain and the chart patterns of HPQ HP prior to the earnings report this week,
I would consider purchasing the 23usd strike price Puts with
an expiration date of 2025-12-19,
for a premium of approximately $0.74.
If these options prove to be profitable prior to the earnings release, I would sell at least half of them.

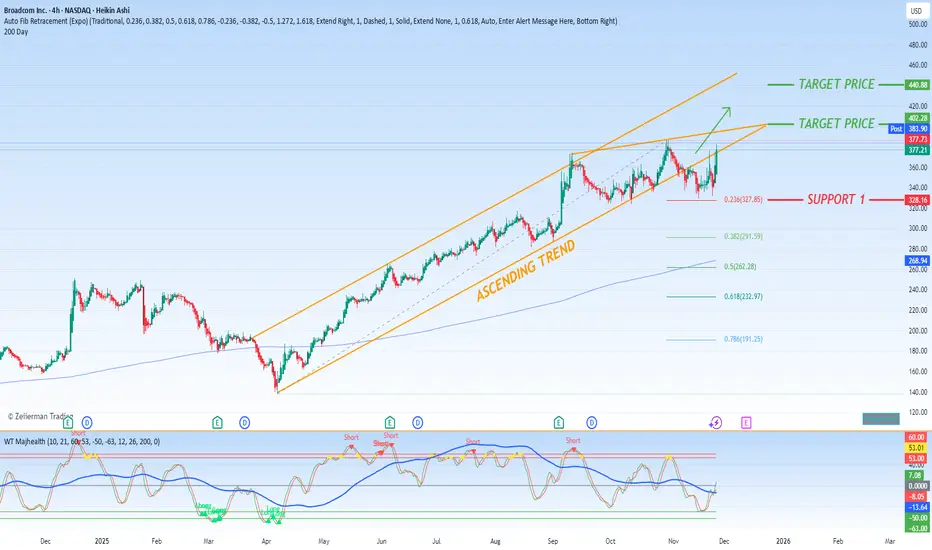
Broadcom Rides the AI Wave, Fueling Nasdaq's AscentSemiconductor titan Broadcom (NASDAQ: AVGO) emerged as a key catalyst driving the Nasdaq Composite significantly higher during a robust trading session for the technology sector. This bullish momentum was fueled by a confluence of positive developments within the artificial intelligence ecosystem, directly benefiting Broadcom's strategic positioning.
The optimism was ignited over the weekend by affirming analyst commentary regarding Alphabet (Google)'s advancements in AI. As a critical supplier of custom networking and AI accelerator chips for Google's data centers, Broadcom stands as a direct beneficiary of the search giant's accelerated investments. This sentiment was further amplified by e-commerce and cloud behemoth Amazon (NASDAQ: AMZN), which unveiled ambitious new plans to commit tens of billions of dollars toward AI infrastructure. Given Broadcom's established role as a supplier for custom silicon solutions, this announcement signals a powerful, forward-looking demand driver for its semiconductor business.
While a segment of the market maintains a prudent long-term perspective, cautiously watching for any potential saturation or deceleration in the torrent of AI capital expenditure, the immediate reaction to concrete, large-scale investment announcements remains overwhelmingly positive. These deals serve as tangible validation of Broadcom's growth trajectory and its entrenched role in the foundational infrastructure of the AI revolution.
Technical Perspective and Price Outlook
From a chart analysis standpoint, Broadcom's technical setup presents a compelling case for continued strength. The stock is demonstrating remarkable resilience, consolidating above a key Fibonacci support level. Specifically, the 0.236 Fibonacci retracement level at approximately $327.85 has acted as a reliable springboard, confirming a strong base of buyer interest at that price point.
This robust foundation, underpinned by powerful fundamental tailwinds, provides a confident outlook for the stock's upward trajectory. Our analysis projects a strong and positive target zone between $400 and $440. Given the potent combination of sector-wide momentum and the company's firm-specific catalysts, we anticipate a high probability that AVGO will challenge and test this target range in the foreseeable future. The confluence of strong fundamentals and a bullish technical structure makes Broadcom a standout contender for continued outperformance.
EH EHang Holdings Limited Options Ahead of EarningsAnalyzing the options chain and the chart patterns of EH EHang Holdings Limited prior to the earnings report this week,
I would consider purchasing the 22usd strike price Calls with
an expiration date of 2026-4-17,
for a premium of approximately $0.48.
If these options prove to be profitable prior to the earnings release, I would sell at least half of them.

QS - Clearer Picture, $25 a shareThis pullback itself wasn't completely unexpected; the blood and steepness of this move was. But QS went sideways continuously retesting the previous significant VWAP formed from the last all-time high formed.
IF: QS continues to make forward progress and partnerships on their solid-state battery, I suspect this third wave extension will end in the form of a Minor Fifth-Wave Extension, confluence between 1.618 extension shows $25 zone as a likely point to be hit.
I currently have my stop losses set steeply at $7.50, and reason/my wave-count dictates I should move them up closer to the local low we just made ($10.60) but currently holding off on that just now. It is possible that my wave-count is incorrect, and we go lower but still form a higher low than $7.50 low.
Wave-Count Confidence: Average

Clear Weekly Bull FlagNASDAQ:OPEN has a weekly bull flag. A break above the upper part for the flag will likely lead to upward momentum.
Based off Fibonacci, the first target is $13.75, and the second target is $17.38. The targets are based off the 1.27, and 1.68 fibs respectively.

$NVO Faces Market Pressure Follow by Alzheime Clinical TrialShares of Novo Nordisk (NYSE: NVO) found themselves among the session's most significant decliners on Monday, pressured by discouraging news from the pharmaceutical giant's pipeline. The company announced that its highly anticipated clinical trial, which investigated the use of its GLP-1 semaglutide drug in treating Alzheimer's disease, failed to meet its primary objective. The study was designed to determine if the medication could slow the progression of symptoms associated with the neurodegenerative condition; however, the results indicated no statistically significant benefit for patients.
In response to the news, Novo Nordisk's CEO, Mike Doustdar, sought to manage expectations by characterizing the trial as a longshot from its inception. He emphasized that the primary focus for the company's GLP-1 portfolio remains firmly on metabolic diseases like diabetes and obesity. Despite this framing, the market's reaction was decisively negative. The Alzheimer's space is notoriously challenging, with a long history of failed treatments, and investors had held out hope that Novo's proven platform could finally deliver a breakthrough. The disappointment stems not only from a missed commercial opportunity but also from the dashed hopes for a new therapeutic avenue for the millions affected by Alzheimer's.
From a technical analysis perspective, the negative catalyst has reinforced a bearish chart pattern for $NVO. The stock is currently tracing a descending pattern, indicating sustained selling pressure. For investors and traders monitoring these levels, a critical support zone is established near the $30.00 mark. A decisive breach of this support level could trigger further downside, with the next significant area of concern, often termed the "danger zone," located around $20.00.
Conversely, should the stock successfully hold the $30.00 support and subsequently reverse its downward trajectory, breaking out above the pattern's resistance, a substantial upward move could be in sight. In such a bullish reversal scenario, the primary upside target would be projected near the $60.00 level, representing a significant recovery and a test of prior highs.

TSLA at a Critical Pivot! TSLA at a Critical Pivot! Bounce Coming or Fake Pump Before a Bigger Drop? 🚀⚠️
Alright, TSLA traders… this one is getting interesting.
Based on the weekly, daily, hourly structure AND the GEX map you provided, TSLA is sitting right at a decision zone where institutions will either:
✅ push it toward $435–$450
or
❌ dump it back into the $390–$380 liquidity pocket
Let’s break it down clean and human — like we always do.
🟦 Weekly Timeframe (Big Picture)
TSLA finally broke out of the long consolidation and now pulling back into previous structure.
Key observations:
* Weekly candle rejecting near $475–$500 supply
* Price holding above key weekly support around $410–$417
* Rising trendline still intact
* No major breakdown yet
If the weekly holds above $410, the trend continues bullish.
If it loses $410, weekly structure turns bearish quickly.
🟩 Daily Timeframe
This is where it gets tricky.
Daily chart shows:
* CHoCH + BOS signals around $420
* Strong rejection at daily supply $470–$500
* Retest of demand zone $390–$405
* Price currently hovering in the middle
This daily structure tells me:
TSLA bounced, but it's not out of trouble yet.
We need a clean daily close above $425–$430 to unlock the upside again.
If daily closes below $410, sellers will take control fast.
🟨 1H Timeframe (Trader Zone)
On the 1H:
* Multiple CHoCH/BOS flips
* Price stuck in a range $410–$428
* Weak momentum on the latest bounce
* Overhead supply sitting right above current price
This looks like:
📌 accumulation OR distribution
1H will decide the next move:
✅ Break & hold above $428 = continuation toward $435–$450
❌ Reject $428 and break $410 = drop into $395–$385
🔥 GEX Outlook (Institutional Positioning)
Your GEX chart is very clear:
📈 CALL Walls:
* $428 / $435 / $450 cluster
* Highest positive NET GEX at $410–$420
📉 PUT Walls:
* $390
* $385
* $380 major support
Institutions are:
✅ defending $410–$420
✅ hedged heavily around $435
❌ willing to let price fall toward $390 if $410 fails
This aligns PERFECTLY with the price structure.
🧭 My Thoughts
TSLA looks stronger than NVDA and SPY in the short-term.
This bounce is not random — GEX shows real defense at $410 and buyers stepped in.
However…
If TSLA fails to break above $428 convincingly, this bounce becomes a trap, and that drop toward $390–$385 becomes very likely.
🎯 Trade Levels to Watch
Bullish Scenario
* Entry: above $428
* Target: $435 → $450
* Stop: below $417
Bearish Scenario
* Entry: below $410
* Target: $395 → $385
* Stop: above $423
🚀 Option Thoughts
If trading options:
Calls only make sense above $428
Puts become high conviction below $410
Inside that range = chop risk
✅ Conclusion
TSLA is sitting at the most important zone of the week.
If $428 breaks cleanly → continuation to $450
If $410 breaks → fast flush to $390–$385 liquidity
⚠️ Disclaimer
This analysis is for educational purposes only and does not constitute financial advice. Always do your own research and manage your risk before trading.

NVDA at a Critical Breakdown. Bounce Coming or Flush to $175NVDA at a Critical Breakdown Zone – Bounce Coming or Full Flush Below $175? 🔥
Weekly Trend (Big Picture)
NVDA’s weekly chart just did something important:
✅ Broke below the long-term rising structure
✅ First real weekly lower high since the major uptrend started
✅ Strong selling wick at the top
This shift tells us momentum is no longer purely bullish. Buyers lost control near $220–$230, and the weekly now leans corrective, not trending.
Key weekly support: $176–$180
This is where the prior trendline, demand, and volume cluster meet.
If NVDA loses this zone on a weekly close → the next major weekly demand isn’t until $160–$165.
Daily Structure
The daily makes the story even clearer:
* Multiple CHoCH signals (trend weakness)
* Failed continuation after breakout attempt
* Price rejecting the daily bearish order block around $198–$205
* Holding inside a large daily demand zone $175–$182
This is the final defense for bulls.
As long as NVDA holds $176–$180 on the daily, we can see:
➡️ Relief bounce toward $187–$192
➡️ Possibly $198 retest
But if $176 breaks…
➡️ Daily breakdown
➡️ Clean air to $165
➡️ Fast move likely
1-Hour View (Trader Timing)
The 1H structure is currently:
* Downtrend channel
* Lower highs
* Multiple failed bounces
* Buyers defending the green demand block $177–$182
Short-term, this is range to down, but oversold enough for intraday bounces.
Best actionable levels:
✅ Long scalp only if price holds above $180 → target $184–$187
❌ Avoid longs below $179
📉 If $176 breaks → expect momentum selling toward $170–$165
GEX (Options Positioning Signal)
This is the key confluence.
GEX shows:
🔴 PUT dominance
🔴 Highest negative exposure at $175
🟥 Strong PUT support wall below $175
🟢 Light CALL interest above $188–$195
What this means:
Institutions are positioned for downside or pinning around $175–$180.
If price cracks $175, dealers flip into accelerated selling → this is where the flush to $165 can trigger quickly.
If price holds above $180 and pushes toward $187+, GEX shifts to neutral and a bounce can develop.
My Thoughts
NVDA is the opposite of AAPL and GOOGL right now.
Those are pushing highs with momentum.
NVDA is:
* Weakest of the big names
* Losing trend structure
* Sitting on final support
* Option flow leaning bearish
This usually leads to:
🔥 Either a violent bounce
🔥 Or a breakdown flush
No middle.
Direction Summary
Bullish scenario:
Hold $180 → push into $187–$192
Bearish scenario (higher probability if $176 breaks):
Break $176 → unwind to $165 fast
Disclaimer:
This analysis is for educational purposes only and does not constitute financial advice. Always do your own research and manage your risk before trading.

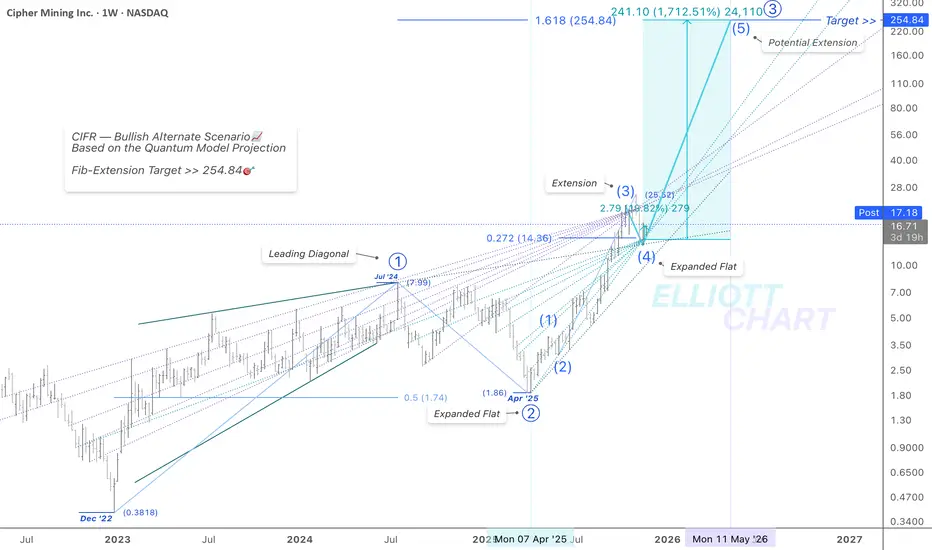
CIFR / WeeklyNASDAQ:CIFR — Quantum Model Projection
Bullish Alternative — Weekly
As highlighted in the prior analysis, $Cipher recorded a strong 19.8% intraday surge, rebounding right from the apex of the support-equivalence lines💫 where the market closed last week.
As outlined in the Nov. 19 update, Intermediate Wave (4) completed a decisive retracement into the $14.36 Fibonacci target, settling precisely at the structural apex. This reaction increases confidence that Wave (4) has likely bottomed.
From here, the model favours an extension into Intermediate Wave (5) within Primary Wave ⓷, projecting an impulsive advance toward $254🎯.
This target aligns with the confluence of divergent equivalence lines. It corresponds to the 1.618 Fibonacci extension derived from the Leading Diagonal of Primary Wave ⓵ — a configuration typically associated with structurally bullish continuation patterns.
Overall, the wave structure suggests the uptrend remains intact, with the next impulsive phase now potentially underway.
🔖 In my Quantum Models methodology, the equivalence lines function as structural elements, anchoring the model's internal geometry and framing the progression of alternate paths.
#MarketAnalysis #TechnicalAnalysis #ElliottWave #WaveAnalysis #TrendAnalysis #FibLevels #FinTwit #TradingView #Investing #CIFR #DataCenters #BitcoinMining #HPC #CryptoMining #CipherMining #BTC #Bitcoin #BTCUSD CRYPTOCAP:BTC NASDAQ:CIFR
#HighPerformanceComputing
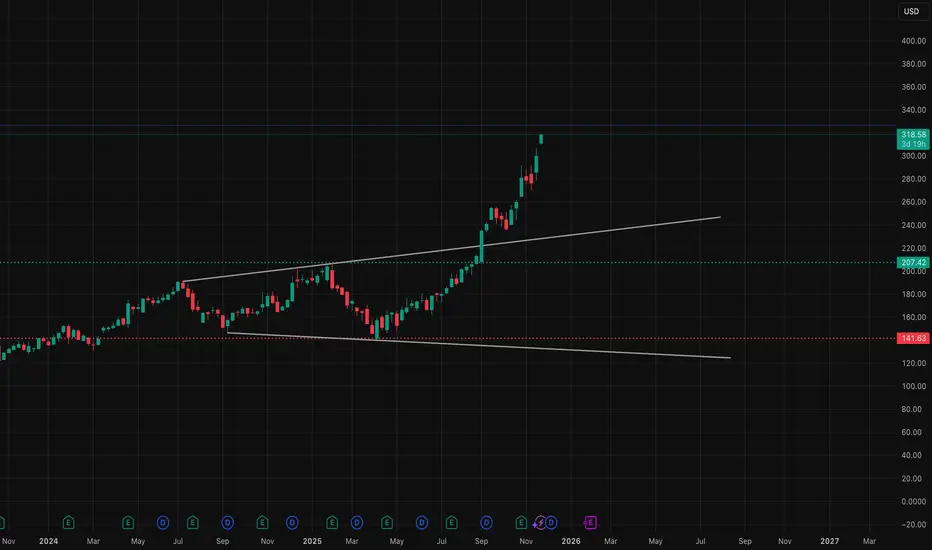
GOOGL Breaking Out Again? Key Levels This WeekWeekly timeframe:
GOOGL is in one of the strongest momentum runs in the market right now. Price just pushed above the previous weekly resistance around 315 and is now trading in open space with very little historical supply until the 325–330 zone. The weekly structure is still a clean higher-high, higher-low sequence with strong trend continuation. As long as price holds above 295, this weekly bullish trend remains intact. The only concern here is the speed of the move — this candle is extended and approaching the upper channel line, which often leads to a short-term pullback before continuation.
Daily timeframe:
The daily chart shows a clear breakout from the rising channel after a BOS move and retest. Buyers defended the 300 area multiple times, creating a strong demand zone below. Current price is sitting inside a small supply zone around 320–327, which has potential to reject short-term, especially after a fast run. If buyers maintain control above 310, continuation toward 330 is likely. A rejection back under 310 opens the door toward 300–295 demand for a healthier pullback.
1-hour timeframe:
Short-term momentum still favors upside, but price looks stretched. The last push created a BOS into supply, and volume is slowing. If 315 holds as intraday support, we could see another attempt toward 325–330. If 315 fails, watch 310 first, then 305 for deeper retracement levels.
GEX sentiment:
Options positioning is supporting the bullish scenario. The highest positive GEX levels sit around 320–330, acting as a magnet. Below, the strongest put support sits near 295. This creates a favored range between 310 and 325 for the short term. As long as price stays above 310, market makers have incentive to keep price elevated.
My thoughts:
GOOGL remains one of the cleanest trending names right now. The weekly structure suggests continuation, but the lower timeframes show exhaustion. Best opportunities likely come from pullbacks rather than chasing highs. Watching for either a breakout retest above 320 or a dip toward 310 for a higher low setup.
Conclusion:
Bullish overall trend
Upside target 325–330
Support zone 310–305
Major support 295
Disclaimer:
This analysis is for educational purposes only and does not constitute financial advice. Always do your own research and manage your risk before trading.
IMPP Imperial Petroleum Options Ahead of EarningsIf you haven`t bought IMPP before the rally:
Now analyzing the options chain and the chart patterns of IMPP Imperial Petroleum prior to the earnings report this week,
I would consider purchasing the 7usd strike price Calls with
an expiration date of 2026-4-17,
for a premium of approximately $0.85.
If these options prove to be profitable prior to the earnings release, I would sell at least half of them.

AAPL At a Critical Decision Zone! Breakout or Pullback Coming?Weekly timeframe
AAPL has been grinding steadily higher for months, forming a clean bullish structure with higher lows and higher highs. Buyers have full control on the weekly chart.
But now price is pushing directly into a long-term ascending trendline that has rejected multiple times in the past. Every time AAPL reached this area, momentum slowed and sellers stepped in.
This is late-stage in the weekly move, not the beginning.
If buyers can break and close above this trendline, we could see a strong expansion move. If not, this is the perfect spot for a weekly pullback.
Daily timeframe
The daily still shows bullish continuation with multiple BOS confirmations on the way up. However, price is now inside a supply zone where the last selloff started.
You can already see hesitation candles forming, smaller bodies, and wicks on top. That usually signals exhaustion.
If daily closes weak here, a retracement back toward 270–268 makes sense. If buyers hold above 275 and push out of this supply zone, continuation toward 280+ opens up.
1 Hour timeframe
Very interesting behavior here.
We saw:
* liquidity sweep above recent highs
* a quick rejection
* price stalling under short-term resistance
This is often the “fake first push” before the market decides direction.
For bulls, we need a clean reclaim and hold above 276.
For bears, losing 273 opens the door for 270–268 retest.
Right now, momentum is slowing.
GEX View
GEX levels support this zone as a decision point:
* heavy CALL walls around 280
* strong PUT support around 270–268
* highest positive GEX slightly above current price
That means market makers have incentive to pin AAPL between these levels until direction becomes clear.
A breakout above the 280 GEX wall could trigger momentum.
A breakdown toward 270 would be absorbed by PUT support first.
My thoughts
Trend is still bullish overall, but location is risky for new longs. This is where smart money takes profit or waits for confirmation.
If buyers fail to break this weekly trendline soon, we could see a pullback. If they break it, AAPL has room to run fast because there's very little resistance above.
This week should decide the next bigger move.
Key levels
Bullish above:
276
280
Targets:
282.5
285
Bearish below:
273
270
Targets:
268
265
Conclusion
AAPL is sitting at a major decision zone across all timeframes. Trend favors bulls, but the location suggests caution. Watch 276 and 273 — whichever breaks first likely sets the next move.
Disclaimer:
This analysis is for educational purposes only and does not constitute financial advice. Always do your own research and manage your risk before trading.
DE Deere & Company Options Ahead of EarningsAnalyzing the options chain and the chart patterns of DE Deere & Company prior to the earnings report this week,
I would consider purchasing the 510usd strike price Calls with
an expiration date of 2025-12-19,
for a premium of approximately $8.95.
If these options prove to be profitable prior to the earnings release, I would sell at least half of them.

W. BUFFETT GOES 'GOOGLE'. DOES IT WORTH TO FOLLOW HIM AT PEAKSWarren Buffett has recently led Berkshire Hathaway to buy around $5 billion in Alphabet stock NASDAQ:GOOGL during the third quarter of 2025, making Alphabet one of Berkshire’s top ten holdings and sparking renewed interest in whether following Buffett’s move makes sense at today’s stock highs.
Technical Analysis
Alphabet is currently in a well-defined uptrend, with its price above short-term moving averages and an RSI near 60, indicating bullish momentum but no overbought signals.
Price action shows consolidation near highs (around $283–$290), pointing to the potential for a breakout, particularly with increasing volume on up days, which is a sign of institutional accumulation.
Critical technical levels: $260 (major support), $283–$290 (resistance zone). If the stock holds above $260 (Q3 2025 peaks), the underlying trend appears robust, but any reversal signals near resistance should be watched closely.
Momentum indicators (RSI, MACD) and stable volume profile suggest sustained optimism but prudent risk management is advised in case sentiment shifts.
Fundamental Analysis
Alphabet boasts strong recent earnings, with robust year-over-year growth in revenue and profit, especially from AI and Cloud businesses. Analyst consensus remains bullish, supported by upward revisions in price targets.
Valuation: Currently trading at roughly $284 per share, Alphabet’s price-to-earnings (P/E) ratio sits around 28, which is relatively attractive for a company growing earnings per share (EPS) at over 17% per year and maintaining high margins (ROE 32%, ROA 23%).
Intrinsic value estimates (base case) place fair value closer to $180, suggesting the stock is technically overvalued on traditional models, though AI/cloud potential and ecosystem advantages could justify a premium.
Key strengths: Dominant data ecosystem (Search, Android, Chrome, Gmail), world-leading AI research (DeepMind, Gemini), and a healthy balance sheet (minimal debt, strong free cash flow).
Risks: Heavy reliance on ad revenue, potential regulatory headwinds (especially in the EU), and risk of AI-driven disruption to legacy business lines.
Does It Worth to Follow Buffett at the Google' Peak?
Buffett’s purchase signals confidence in Alphabet’s long-term moat and ability to transition to AI-driven growth, despite current valuations appearing rich by historical standards.
Technically, the uptrend has not shown signs of exhaustion, and volume patterns indicate continued market accumulation. But buying near technical resistance always carries risk of short-term pullback.
Fundamentally, Alphabet’s growth engines, profitability, and fortress balance sheet remain appealing. However, potential macroeconomic and regulatory shocks are real, and intrinsic valuations suggest caution for value-focused investors.
Beta-relative testing
We have examined Google stock in AU measure (one stock value in grams of gold). The graph below indicates on major long term upside trend, with a possible nearly 60% further upward potential is such measurement.
We have also tested Google stock in a measure of Nasdaq-100 (in example below NASDAQ:QQQ has been used; both - Google stock and QQQ - were used in 'total return' format).
Well, right now we can consider that multi-year 'flat regime' finally goes to breakthrough.
In conclusion, following Buffett now is technically supported by trend and recent accumulation, and fundamentally underpinned by growth, but it means accepting a premium and faithfully betting that Alphabet’s evolving AI/assets will deliver above-model returns over time.

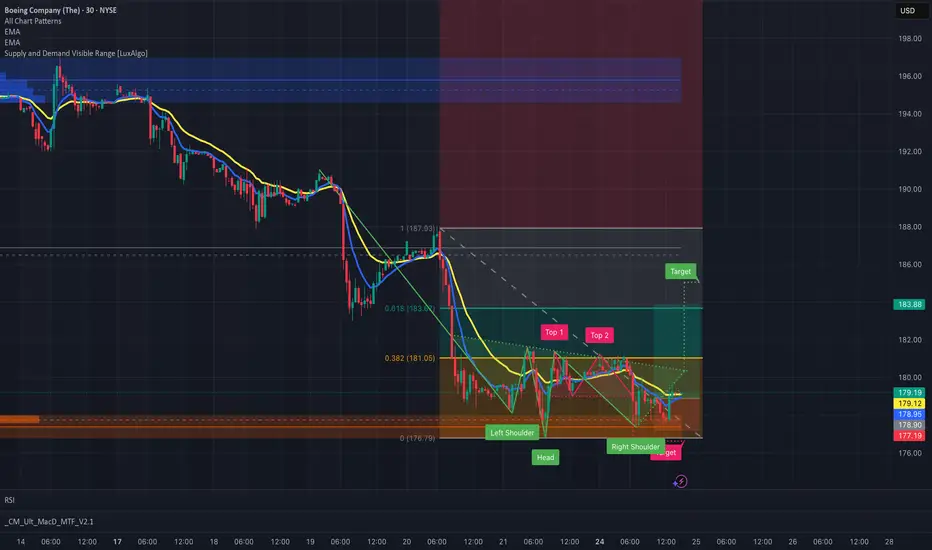
BA Needs a Neckline Break Before Any 185 MoveHere are the 3 likely scenarios:
⭐ Bullish Scenario (40% probability):
BA opens gree
Breaks above 180.5–181
Runs to 182–183 on Tuesday
185 becomes possible Wednesday or Thursday
⚠️ Sideways Scenario (35% probability):
BA chops between 178.8–180.8
Keeps building energy
Breakout later in the week
❌ Bearish Scenario (25% probability):
Rejection at neckline again
Retests 178 → 177.5
Pattern still valid unless 177 breaks
Personally, I feel it will be slight bullish this week
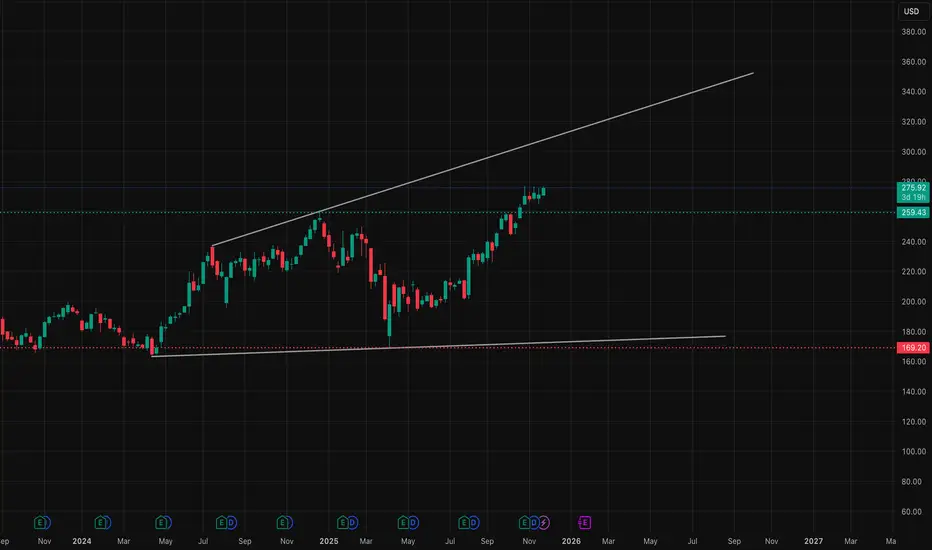
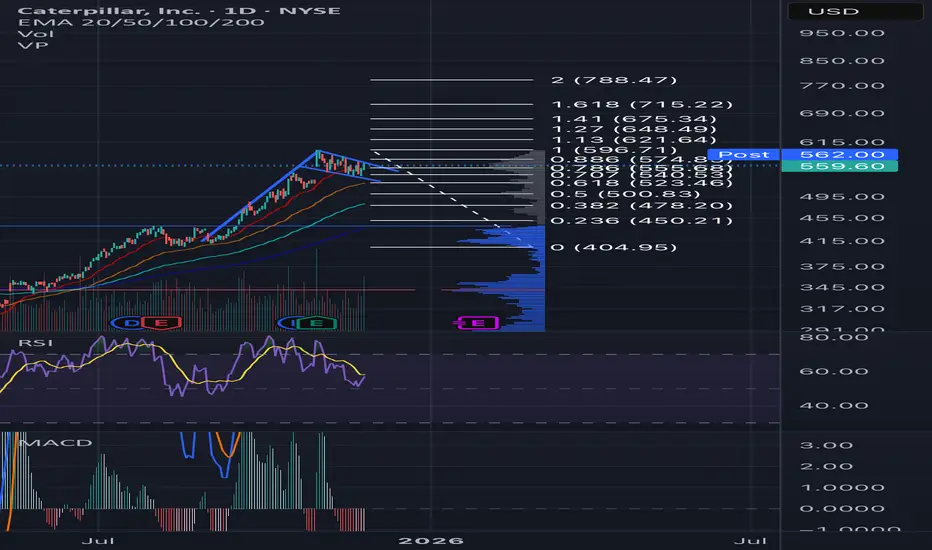
Daily Bull FlagNYSE:CAT produced a daily bull flag. A break above the upper resistance on the consolidation would indicate further upward momentum.
Using Fibonacci, the first target is $648 at the 1.27 fib, and the second target is $715 on the 1.68 fib.
Elliot Wave Impulse Wave 5 potentially forming A potential Elliot Wave 5 potentially forming on SOFI targeting some where ~$47-48 Next year.
We had from the top a wave 4 pull back to the .382 fib from Wave 2 to Wave 3. If we dont break down below $23.48, we should still be holding structure on the way up.
We are potentially getting more rate cuts next year due to unemployment rate ticking up recently and the Fed may be forced to cut more. The Fed chair also will get replaced next year and we may get a puppet Fed that just cut rates massively.
