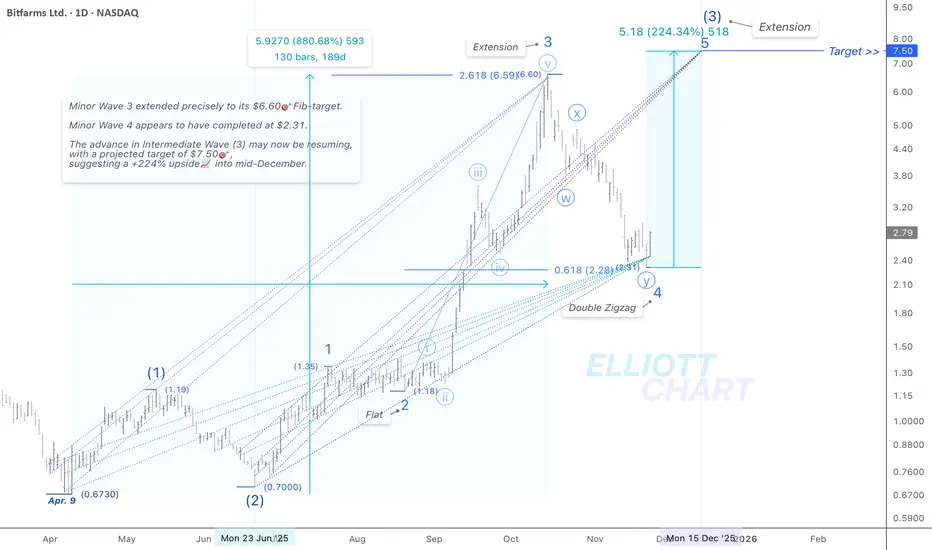
BITF / DailyNASDAQ:BITF — Quantum Model Projection
Technical Update (Daily)
$Bitfarms rallied 14.8% today, reflecting the broader strength seen across the mining sector.
Minor Wave 4, which unfolded as a Double Zigzag, now appears complete.
Although the 0.618 deep retracement is atypical for a fourth wave, the structure is now fully matured — thank you for your patience throughout the correction!
There are no major changes to the BITF technical outlook; the near-term bullish structure remains intact.
The advance of Intermediate Wave (3) is expected to re-extend now through Minor Wave 5, projecting a Q-Target near $7.50🎯, representing an estimated +224%📈 upside into mid-December.
🔖 This outlook is based on insights from my Quantum Models framework.
#QuantumModels #EquivalenceLines #Targeting #MarketAnalysis #TechnicalAnalysis #ElliottWave #WaveAnalysis #TrendAnalysis #StocksToWatch #FibLevels #FinTwit #Investing #MiningStocks #BITF #Bitfarms #DataCenters #BitcoinMining #CryptoMining #AIStocks #HPC #AI #BTC #Bitcoin #BTCUSD CRYPTOCAP:BTC NASDAQ:BITF
SLNH / 4HNASDAQ:SLNH — Quantum Model Projection
4H Zoom-In Technical Update
$Soluna has entered the projected advance zone with a 10.6% surge today, aligning with the broader strength across the mining sector.
The decline in Minor Wave 4 should have concluded — precisely at the projected intra-structural 1.618 Fibonacci extension target.
The advance in Intermediate Wave (1) now appears to be resuming through an impulsive Minor Wave 5, with a Q-target of $7.80🎯 — implying a potential +450%📈 upside into mid-December as the broader bullish structure continues to unfold.
A decisive break above $5.13 will fully confirm the Leading Diagonal in Intermediate Wave (1), validating it as a bullish structural foundation for the emerging Primary uptrend.
🔖 This outlook is based on insights from my Quantum Models framework.
#QuantumModels #EquivalenceLines #Targeting #MarketAnalysis #TechnicalAnalysis #ElliottWave #WaveAnalysis #TrendAnalysis #FibLevels #FinTwit #TradingView #Investing #SLNH #GreenDataCenters #BitcoinMining #CryptoMining #AIStocks #HPC #AI #BTC #BTCUSD CRYPTOCAP:BTC NASDAQ:SLNH

IREN / WeeklyNASDAQ:IREN — Quantum Model Projection
IREN surged 14.7% today — a standout rally despite BTC showing weakness, highlighting strong underlying momentum.
As detailed in the previous update, the correction in Intermediate Wave (4) reached the 0.382 Fib-Retracement level last week, unfolding as an Expanded Flat and ending precisely at the apex of the convergent support equivalence lines.
Looking ahead, an extension into Intermediate Wave (5) within Primary Wave ⓷ projects toward $431🎯 , aligning with the 1.618 Fibonacci extension of the Leading Diagonal formed in Primary Wave ⓵.
As noted earlier, the Leading Diagonal in Primary Wave ⓵ — originating in December 2022 — represents a potentially bullish structure, signalling an early-stage transition into a bullish accumulation phase. According to my framework, such motive patterns often precede strong impulsive advances, reinforcing the broader bullish narrative as the Cycle-degree Uptrend continues to unfold.
#QuantumModel #TrendAnalysis #WaveAnalysis #MarketStructure #CryptoAnalysis #CryptoMarket #TechnicalAnalysis #ElliottWave #Investing #IREN #IRENStock #TechStocks #DataCenter #AIDatacenter #BitcoinMining #HPC #CryptoMining #BTC #Bitcoin #BTCUSD CRYPTOCAP:BTC NASDAQ:IREN #RenewableEnergy

Why os Amazon $AMZN rallying?Why os Amazon NASDAQ:AMZN rallying? Amazon st. The strong weekly demand level at $231 per share is still in control. Rallying as expected. Long positions should be managed.
Hopefully, Amazon stock will continue to rally. These imbalances are great for stock swing trading, bullish stock option strategies and intraday stock trading once the imbalance gains control.

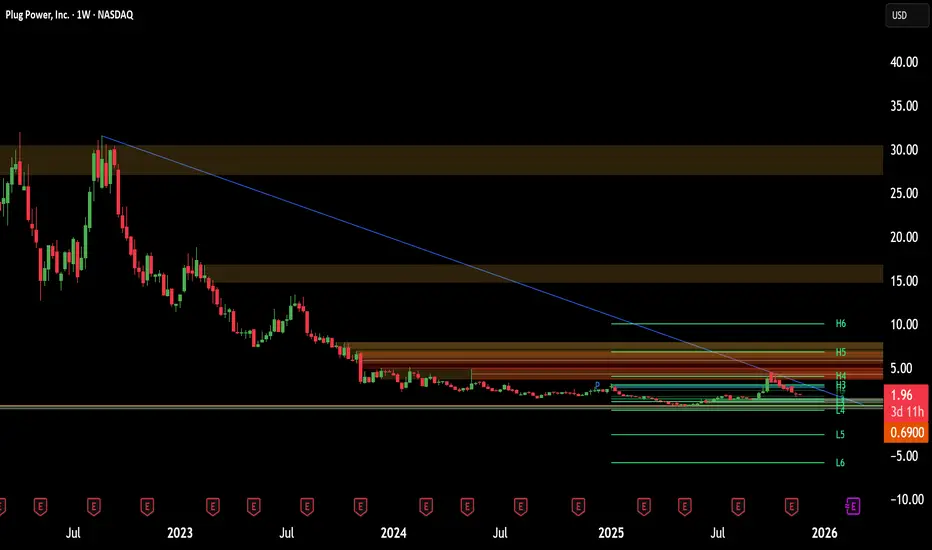
Plug Power's AI Pivot: A Strategic RechargePlug Power is executing a high-stakes pivot from government-backed green hydrogen to the booming AI infrastructure market. We analyze the strategic, industrial, and technological drivers behind this potential turnaround.
A Strategic Pivot Amidst Headwinds
Plug Power (PLUG) has long promised a "green hydrogen revolution," but its stock performance tells a different story—plummeting 99% since its 1999 debut. Facing a cash crunch and a $364 million quarterly loss, management is now steering the company toward a new, voracious customer: Artificial Intelligence data centers .
This move is not merely opportunistic; it is a survival imperative. With the Trump administration recently canceling a vital $1.7 billion Department of Energy (DOE) loan, Plug Power has halted capital-intensive green hydrogen projects. Instead, it is monetizing assets to survive, signaling a shift from government-subsidized dreams to immediate commercial reality.
Geostrategy: Adapting to Policy Shifts
The cancellation of the DOE loan reflects a broader geopolitical shift. The new administration prioritizes immediate energy availability over subsidized decarbonization. By pivoting to the private sector, Plug Power is reducing its exposure to political risk.
This aligns with a "geostrategy of resilience." Data centers are a national critical infrastructure. By offering independent power generation, Plug positions itself as a guarantor of digital sovereignty, insulating tech giants from an increasingly fragile U.S. power grid.
Industry Trends: The AI Energy Crunch
The timing of this pivot addresses a critical market failure. Major analysts project that data center electricity demand will grow 16% in 2025 and double by 2030. AI-optimized servers consume nearly five times the power of standard racks, creating a bottleneck that utility companies cannot resolve quickly.
Plug’s recent letter of intent to sell electricity rights for $275 million confirms this demand. Tech giants are desperate for power *now*. Plug is capitalizing on this by selling its grid interconnection queue spots—effectively selling "time" to power-starved hyperscalers.
Innovation & Tech: PEM Fuel Cells vs. Diesel
Technologically, Plug holds a distinct advantage. Traditional data centers rely on diesel generators for backup, which are dirty, noisy, and maintenance-heavy. Plug’s **Proton Exchange Membrane (PEM) fuel cells** offer a superior alternative:
Instant Response: PEM cells ramp up power in seconds, matching the uptime requirements of mission-critical AI workloads.
Zero Emissions: This allows data centers to operate in urban zones with strict air quality mandates.
Energy Density: Hydrogen offers higher energy density than batteries, essential for facilities with limited real estate.
Business Models: Asset Monetization & Liquidity
Management is restructuring the business model from "build-and-own" to "asset-light." The $275 million liquidity injection from selling electricity rights provides a crucial runway. Rather than burning cash to build massive hydrogen plants, Plug is leveraging its existing technology stack—GenSure and ProGen systems—to generate immediate revenue.
This shift improves the cash conversion cycle. Selling backup power hardware to well-capitalized tech firms offers faster payment terms and lower capital risk than long-term utility projects.
Management & Leadership: A Decisive Course Correction
CEO Andy Marsh’s decision to suspend DOE-related activities demonstrates decisive leadership. A rigid adherence to the original "green hydrogen" roadmap would have been fatal without federal backing. By pivoting to the "AI trade," leadership is aligning the company with the only sector currently enjoying unlimited capital expenditure: Big Tech.
Conclusion: A Speculative Renaissance?
Plug Power remains a high-risk investment, but the investment thesis has fundamentally improved. The company is trading a dependency on government policy for a dependency on AI infrastructure growth—a far more robust driver. If Plug can successfully deploy its fuel cells as the standard for data center backup, it will transition from a speculative energy play to an essential component of the AI economy.
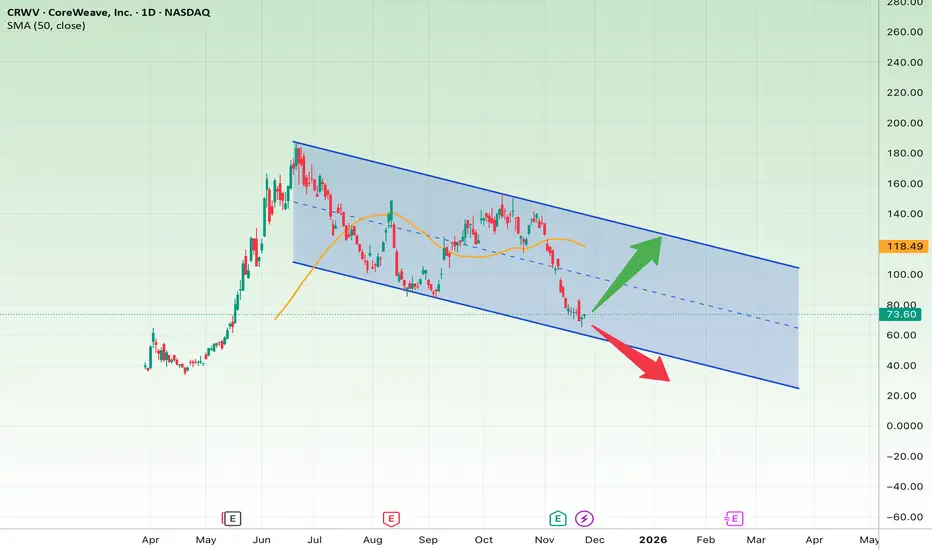
Is CRWV Ready for a Major Rebound—or a Bigger Crash?The chart shows CRWV moving inside a downward trending channel, and the price is now touching the bottom of the channel, where it has shown a mild bullish reaction. This zone can offer a good risk-to-reward long opportunity, but only if the lower boundary holds.
Bullish Scenario (if price holds above the channel bottom)
As long as CRWV stays above $68–$72:
• Target 1: $90
• Target 2: $105
• Target 3: $118 (top of the channel)
Bearish Scenario
If the price breaks below $68:
• Downside target: $50
• Extended bearish target: $30
Stop-Loss
• A confirmed break below $68 with strong bearish volume
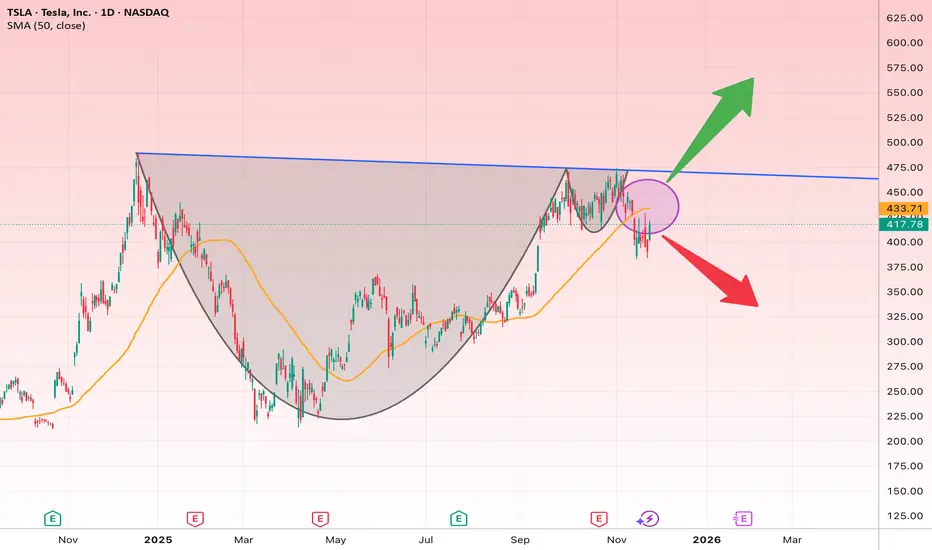
TSLA at a Turning Point: Cup & Handle Breakout or Breakdown?The chart shows a clear Cup & Handle pattern forming on the daily timeframe. Price touched the descending resistance (blue line) and failed to break out, placing TSLA at a critical decision point.
Key Points:
• Main Resistance: 450–465 zone (descending trendline + neckline of pattern)
• Major Support: 395–400 zone
• The 50-day MA is currently acting as near-term resistance.
Bullish Scenario (If price breaks above 465)
A breakout with a daily close above 465 would likely trigger:
• Target 1: $500
• Target 2: $545
• Target 3: $600
Bearish Scenario (If 395 breaks)
A breakdown below 395 may lead to:
• Bearish Target 1: $360
• Target 2: $325
Suggested Stop-Loss:
• $394 (for long positions)
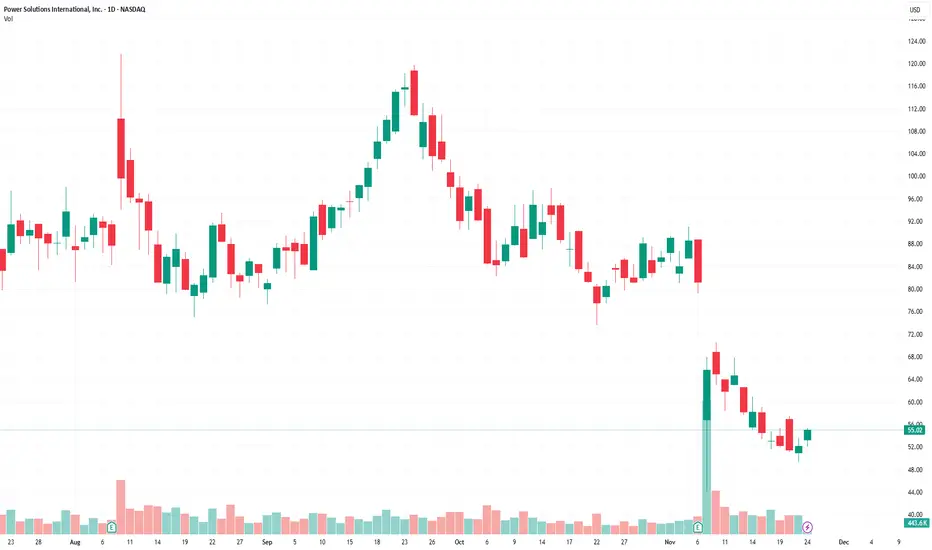
PSIX Poised to Benefit from Explosive AI Data-Center ExpansionPower Solutions (PSIX), incorporated in 2011 in the state of Delaware and based in Wood Dale, Illinois, is engaged in the development, manufacturing, marketing, and sale of power systems and electricity-generation equipment. PSIX offers a wide range of products, including backup and prime generators, load-management solutions, microgrids, cogeneration systems, and other solutions.
Investment highlights
Growth of data centers and energy demand driven by AI development
The explosive growth of AI and cloud infrastructure is leading to unprecedented demand for backup and prime power-generation installations. These facilities require round-the-clock, highly reliable, high-capacity power supply, making the power-generation market one of the key beneficiaries of this new technological wave. Against the backdrop of structurally rising energy consumption by data centers, PSIX is actively strengthening its presence in this market. The company is placing strategic emphasis on higher-margin segments while gradually reducing its exposure to low-margin traditional areas.
Initiatives to accelerate data-center development
The Trump administration aims to speed up grid-connection procedures for the rapidly expanding data-center sector, proposing to limit the Federal Energy Regulatory Commission’s (FERC) application review period to 60 days. This initiative is intended to remove infrastructure bottlenecks and sustain the growth momentum of AI-driven data centers. For PSIX, this could become an important growth driver. Faster project timelines and further expansion of energy-intensive data centers are likely to increase demand for the company’s engine systems and power solutions.
Strong financial performance
In Q2 and Q3, the company posted double-digit revenue growth, increasing sales by 74.0% and 62.0% y/y to $192M and $204M, respectively. Such high growth rates point to strong and resilient demand from data centers, which continue to aggressively expand capacity and modernize infrastructure. Diluted EPS grew by an impressive 60% y/y in Q3 2025, reflecting both operational improvements and effective execution of strategic initiatives in key business areas. Meanwhile, the operating margin remains at a high level of around 14%, which is especially significant for a company in a phase of active expansion.
Attractive current valuation
At present, PSIX shares appear substantially undervalued relative to peers. The company’s P/E is 9.9x, which is nearly three times below the industry median (around 26x)—while PSIX is showing explosive growth in the first half of the year. The EV/EBITDA multiple also trades at a notable discount—about 10.8x versus the industry median of 15x.
Target price: $83; stop-loss: $43; upside potential: 59%.
Why Structure Beats Prediction|The Core Philosophy of UIA **Why Structure Beats Prediction|The Core Philosophy of UIA
(英文为主・中文为辅)**
Most traders try to predict market direction.
But prediction is unreliable, emotional, and impossible to repeat.
At UIA Institute, our core belief is simple:
Markets cannot be predicted.
But structure can always be read.
(中文:市场无法预测,但结构可以被读取——这是 UIA 方法论的核心。)
🔵 1. Why prediction fails(预测为何不可靠)
Prediction depends on assumptions, and assumptions fail because:
Liquidity shifts without warning
Macro events disrupt trends instantly
Reversals never send a notification
Emotions distort expectations
Every prediction increases the gap between “what we think” and “what the market actually does.”
(中文总结:预测依赖假设,而假设越多,错误越多。)
🔵 2. Why structure works(结构为何可靠)
Structure is built from facts, not guesses.
Price → Volume → Reaction → Rhythm
These reflect what has already happened, and therefore can be read objectively.
Structure tells us:
T — When a trend starts
E — Whether the trend is extending healthily
H — Where key swing points form
X — When the trend is exhausted and ending
(中文:结构来自“市场已经发生的事实”,因此可被辨识、可被重复。)
🔵 3. Reacting beats predicting(反应比预测更强)
The UIA methodology is designed around one principle:
Don’t predict the future.
React to the structure.
Reacting means:
You act on confirmed information
You avoid emotional bias
You stay synchronized with real market rhythm
You reduce unnecessary trades
This dramatically improves consistency and longevity.
(中文:UIA 做的是“结构出现后再反应”,成功率高得多。)
🔵 **4. Structure is the only repeatable edge
(结构是唯一可重复的优势)**
Indicators change.
News changes.
Sentiment changes.
But structure is timeless.
Price will always move in rhythms of:
Expansion
Pullback
Continuation
Exhaustion
Reversal
This universal rhythm is why UIA focuses exclusively on structural reading.
(中文:结构具有可重复性,是任何市场、任何周期都适用的通用语言。)
🔵 5. Conclusion(总结)
Prediction creates stress.
Structure creates clarity.
Structure allows traders to understand:
What the market is doing now
When to participate
When to exit
When to stop
When to observe
When to wait
This is the foundation of the UIA Trend Engine, Wave Engine, and TSX Engine.
(中文:结构让交易回到“可控、可读、可执行”的节奏。)

UIA Lite – Trend Structure Preview Release|Full Explanation of T⭐ UIA Lite – Trend Structure Preview Release|Full Explanation of T / E / H / X (Free Preview)
Hello everyone, this is UIA Institute.
We focus on developing clean, systematic, and repeatable market structure tools based on pure price action.
Today, we are releasing the UIA Lite – Trend Engine (Free Preview).
This preview showcases the four core structural events used in the UIA Trend Engine.
These four events form the “structural backbone” of a trend.
🔵 The Four UIA Structural Events (T / E / H / X)
T — Trend Start
Marks the beginning of a trend.
Price transitions from consolidation into a directional move.
E — Trend Extension
Confirms that the trend is healthy and continuing.
Often appears after a controlled pullback or continuation pattern.
H — Structural High / Low
Key swing points formed during the trend.
These are commonly used for scaling out or tightening risk.
X — Trend Exit / Reversal
Indicates that the trend has completed and the market may shift into
either sideways consolidation or a reversal phase.
These four events together define the life cycle of a trend.
🔵 What’s included in the Free Preview
To help more traders understand UIA’s structure-based methodology,
this Preview version focuses on:
Clean labeling of T / E / H / X
Minimal parameters
No prediction, no signals
100% price-action-based logic
Simple, transparent structural rules
The full version of UIA Lite will include additional filters,
higher-precision logic, and more stable structural mapping.
🔵 UIA Lite – Free Preview indicator link:
👉
Feel free to add it to your chart and experiment with it.
🔵 About UIA Institute
We are developing a complete structural analysis framework:
UIA Trend Engine (Trend Structure)
UIA Wave Engine (Swing Structure)
UIA TSX Engine (Early-Structure Signals)
Our philosophy is simple:
No prediction, no emotional trading, no over-indicator setups.
Only structure, rhythm, and repeatability.
**We welcome English-speaking users to join the discussion.
More UIA content will be released soon.**
Are Derivatives Powerful in the Global Trade Market?1. What Are Derivatives?
A derivative is a financial contract whose value is derived from an underlying asset. This asset could be:
Commodities like crude oil, gold, wheat, natural gas
Currencies such as USD, EUR, JPY
Equity indices like Nifty 50, S&P 500
Interest rates such as LIBOR or government bond yields
Credit instruments like corporate bonds
The most common derivatives include:
Futures
Options
Swaps
Forward contracts
In the global trade market, derivatives’ primary purpose is risk transfer, although they are also used for speculation and arbitrage.
2. The Global Influence of Derivatives
Risk Management Backbone of Global Trade
Global trade is full of uncertainties—currency fluctuations, commodity price volatility, geopolitical tensions, supply chain disruptions, and interest rate changes. Derivatives serve as insurance-like tools that allow participants to lock in future prices, hedge risks, or stabilize cash flows.
For example:
An airline company hedges jet fuel futures to protect against rising crude prices.
An importer hedges currency risk using forex forwards to avoid losses if the dollar rises.
Exporters use options to protect against weakening foreign currencies.
Without derivatives, global trade would be significantly more dangerous and unpredictable.
3. Derivatives and Commodity Markets
Commodity derivatives such as oil futures, agricultural futures, and metal contracts are essential in global trade.
Why are commodity derivatives powerful?
Price Discovery
Derivatives markets reflect real-time global supply and demand conditions. Oil prices, for example, are heavily influenced by futures traded on major exchanges.
Stabilizing Prices for Producers and Consumers
Farmers hedge crop prices to secure income; manufacturers lock in raw material prices to control costs.
Enhancing Global Trade Flows
Multinational companies plan procurement and distribution based on futures price signals.
Reducing Market Manipulation
Transparent derivative markets help in curbing cartel behavior and monopolistic pricing.
Thus, commodity derivatives are one of the strongest tools that keep global trade systems efficient and predictable.
4. Currency Derivatives – The Engine of Cross-Border Commerce
In global trade, currency fluctuations can make or break profitability. A stable currency environment is a dream, but not the reality. Hence, forex derivatives are widely used.
How currency derivatives empower global trade?
Hedging exchange rate risks
Importers/exporters use forwards, futures, and options to secure exchange rates.
Supporting multinational operations
Corporations manage exposure across dozens of currencies simultaneously.
Providing liquidity to global markets
Forex derivatives markets are the largest in the world, with trillions traded daily.
Enhancing financial stability
Countries with export-driven economies rely on currency derivatives to prevent economic shocks.
Currency derivatives act as the hidden shield that protects companies and nations from unpredictable foreign exchange swings.
5. Interest Rate Derivatives – The Heart of Financial Stability
Because interest rates influence the cost of borrowing globally, interest rate swaps and futures form the backbone of global financial markets.
Their key powers include:
Helping governments manage debt.
Allowing banks to hedge interest rate exposure.
Enabling corporations to stabilize borrowing costs.
Ensuring smoother global credit flow.
Without interest rate derivatives, global financing would be far riskier, costlier, and more unstable.
6. Derivatives as Speculative and Profit-Making Instruments
While derivatives are risk-management tools, their power also comes from:
Speculation
Traders take positions on future market movements to earn profits. This:
Increases market liquidity
Enhances price discovery
Draws global capital into trade markets
However, speculation can also increase volatility if unchecked.
Arbitrage Opportunities
Derivatives allow traders to exploit price differences in different markets:
Spot vs futures
Domestic vs international exchanges
Currency arbitrage
Commodity pricing discrepancies
Arbitrage ensures that global markets remain efficient and interconnected.
7. How Derivatives Strengthen Global Market Efficiency
Derivatives contribute to global trade in several powerful ways:
A. Increased Liquidity
Markets with high liquidity:
Reduce transaction costs
Facilitate smoother trade
Attract global investors
Improve pricing accuracy
Derivative markets like CME, ICE, NSE, LME, and SGX provide massive liquidity to commodities, currencies, and equities.
B. Better Price Stability
Derivatives reduce sharp price swings, especially in commodities and currencies. This is essential for long-term contracts and procurement.
C. Improved Risk Sharing
Derivatives distribute risks across participants:
Hedgers transfer risk
Speculators accept risk
Arbitrageurs eliminate inefficiencies
This creates a smooth ecosystem for global trade.
D. Facilitation of Global Investments
Investors use derivatives to:
Hedge portfolio risks
Gain exposure to foreign markets
Manage geopolitical risks
This flow of capital boosts global trade volumes.
8. Challenges and Risks of Derivatives
Even though derivatives are powerful, they also have downsides:
1. High leverage risk
Small price movements can cause large profits or losses.
2. Systemic risk
Excessive derivatives trading contributed to crises such as:
2008 Global Financial Crisis
LTCM collapse
Oil futures flash crashes
3. Complexity
Sophisticated instruments like credit default swaps (CDS) are difficult to understand.
4. Counterparty risk
Failure of one party can create a chain reaction.
Despite these risks, regulatory reforms and clearinghouses have made derivative markets safer and more transparent.
9. The Future of Derivatives in Global Trade
Derivatives are becoming more powerful due to:
Digital platforms and electronic trading
AI-driven risk models
Expansion of global markets (India, China, ASEAN)
Growth in commodity and currency volatility
Rise of ESG and carbon credit derivatives
The next decade will see derivatives become even more integrated with global supply chains, energy markets, and financial systems.
Conclusion
Yes, derivatives are extremely powerful in the global trade market. They are not merely financial instruments but essential tools that support world commerce by:
Managing risks
Stabilizing prices
Enhancing liquidity
Improving efficiency
Supporting international investments
Strengthening financial stability
From farmers to oil companies, from banks to governments, derivatives underpin decisions and strategies across the global trade ecosystem. Without them, global markets would be less predictable, less efficient, and far more vulnerable to shocks.
De-Dollarization and Currency Wars1. Understanding De-Dollarization
What Is De-Dollarization?
De-dollarization refers to the global movement to reduce reliance on the U.S. dollar in international trade, investments, foreign reserves, and global transactions. It includes:
Trading commodities in local currencies
Building reserve pools using alternative currencies
Developing rival payment systems
Creating digital or regional currency blocs
This shift is driven by both economic necessity and geopolitical strategy.
2. Why Is De-Dollarization Happening?
While the U.S. dollar remains extremely powerful, several factors are pushing countries—especially emerging economies—to explore alternatives.
(a) Geopolitical Pressures and Sanctions
U.S. sanctions have targeted countries like Russia, Iran, and Venezuela. These nations view the dollar as a vulnerability, because their access to global finance can be blocked.
This has motivated them to:
Use yuan, ruble, or local currencies for trade
Build alternative payment routes
Increase gold reserves
(b) Rising Economic Power of Asia
China’s economic rise is a major catalyst. With its massive manufacturing and consumption base, China can negotiate trade in yuan. Initiatives like the Belt and Road also push partner nations toward the yuan.
(c) Diversifying Risk
The dollar’s strength can hurt emerging markets. For example:
When the dollar rises, global borrowing costs increase
Developing countries suffer currency depreciation
Trade deficits worsen
To protect themselves, nations diversify into euros, gold, or local currencies.
(d) Digital Currencies and Technology
The growth of:
Central Bank Digital Currencies (CBDCs)
Blockchain settlement systems
Instant cross-border payment networks
…allows countries to bypass traditional dollar-based financial pipes.
(e) The U.S. Debt Burden
The U.S. carries huge national debt. Some nations fear long-term currency devaluation or inflation, encouraging them to reduce their dollar exposure.
3. Methods of De-Dollarization
Countries use multiple strategies to reduce dollar dependence.
(a) Bilateral Trade in Local Currencies
Examples include:
India–Russia trade in INR
China–Brazil trade in CNY
Gulf nations exploring yuan-based oil trade
(b) Increasing Gold Reserves
Central banks worldwide have been buying gold aggressively as a non-dollar store of value.
(c) Regional Currency Blocs
Initiatives like:
BRICS currency basket
Gulf digital currencies
Asian currency corridors
…aim to create shared alternatives.
(d) Payment System Alternatives
To bypass SWIFT, countries develop systems like:
China’s CIPS
Russia’s SPFS
India’s RuPay and UPI-based cross-border links
(e) Digital Settlements for Trade
CBDCs allow nations to settle trade instantly without using dollars.
4. What Are Currency Wars?
Currency wars occur when countries deliberately influence their exchange rates to gain a competitive advantage in global trade.
A currency war typically involves:
Devaluing local currency to boost exports
Printing more money (quantitative easing)
Lowering interest rates
Using tariffs or capital controls
Strategic buying/selling of foreign currencies
Currency wars create global tension and can destabilize markets.
5. Why Do Currency Wars Happen?
(a) Boost Export Competitiveness
A weaker currency makes exports cheaper. Export-driven economies like China, Japan, and South Korea have historically used currency policies to support growth.
(b) Counter Inflation or Recession
Central banks may adjust currency values to manage domestic crises.
(c) Respond to Competitor Moves
If one country lowers its currency value, others may retaliate to protect their trade advantage.
(d) Geopolitical Rivalries
Nations may use currency strategies as part of broader political conflicts.
6. How De-Dollarization Leads to Currency Wars
Though separate concepts, de-dollarization and currency wars interact in powerful ways.
(a) Diversification Creates Volatility
As countries move out of dollars into other currencies, fluctuations increase. This can trigger competitive devaluations.
(b) New Currency Blocs Compete for Influence
For example:
Dollar vs. Yuan
Dollar vs. Euro
BRICS vs. G7 systems
Such competition can escalate into currency conflicts.
(c) Trade in Local Currencies Reduces Dollar Liquidity
This weakens dollar dominance, prompting the U.S. to defend its currency through monetary tightening.
(d) Interest Rate Wars
Countries may raise or cut rates to control capital flows. This can set off a chain reaction across economies.
7. Impacts of De-Dollarization on the Global Market
(a) More Currency Options for Trade
Countries gain flexibility in trade agreements.
(b) Reduced Dollar Monopoly
While the dollar remains strong, alternatives weaken its monopoly.
(c) Growth of Regional Economic Blocs
Asia, the Middle East, and BRICS strengthen through local-currency arrangements.
(d) Decline of U.S. Financial Influence
U.S. sanctions and policies become less effective as countries establish independent systems.
(e) Increased Use of Gold and Digital Currencies
Both are emerging as major global reserves.
8. Impacts of Currency Wars
Currency wars create instability in global markets.
Positive Effects (for some nations)
Boosts exports
Attracts foreign investment
Increases competitiveness
Negative Effects (for the world)
Higher inflation
Volatile foreign exchange markets
Trade conflicts
Uncertainty in commodity prices
Global recession risk
Emerging economies are especially vulnerable, as they face rapid capital outflows when major currencies fluctuate sharply.
9. The Future: Will the Dollar Lose Its Dominance?
The dollar is still extremely powerful because:
Most global reserves are in dollars
Oil is mainly priced in dollars
U.S. markets are deep and liquid
Investors trust U.S. institutions
However, the trend toward de-dollarization is real, and over time:
The world may shift from “dollar dominance” to “multi-currency coexistence”
Trade may use baskets of currencies
Digital currencies may reduce dependence on any single currency
BRICS and Asian regions may emerge with stronger financial systems
The dollar will not disappear, but its share of global influence will gradually decline.
Conclusion
De-dollarization and currency wars are two powerful forces reshaping the global economic order. While de-dollarization seeks to diversify the global financial system away from the dollar, currency wars reflect nations’ battles to gain economic advantage through strategic currency manipulation. Together, they represent a shift from a unipolar, dollar-centric world toward a more multipolar, competitive, and technologically driven financial landscape. The transition will not be smooth, but it signals a new era where global power will increasingly depend on currency strategies, digital innovation, and regional cooperation.

Resource Commodity Supercycle in the Global Market1. What Is a Commodity Supercycle?
A commodity supercycle refers to a prolonged period—usually lasting 20–30 years—where prices of essential resources such as energy, metals, and agricultural goods experience sustained growth. Unlike short-term price spikes caused by temporary supply issues, supercycles emerge from deep structural shifts in the global economy.
A supercycle typically forms when:
A massive demand increase arises from industrialization or technological transformation.
Supply takes years to catch up due to long project lead times, lack of investment, or logistic constraints.
Prices remain elevated for years, pushing producers to expand capacity.
The end of a supercycle occurs when new supply finally exceeds demand or global economic growth slows.
2. Historical Commodity Supercycles
Analysts typically recognize four major supercycles in the last 150 years:
1. The Late 1800s Industrialization Boom
Fueled by:
U.S. and European industrial expansion
Rapid railway development
Urbanization and manufacturing growth
This cycle saw rising demand for steel, coal, copper, and agricultural products.
2. Post-World War II Reconstruction (1940s–1960s)
Countries devastated by war needed enormous resources to rebuild:
Europe’s reconstruction under the Marshall Plan
Japan’s industrial revival
Oil, metals, and food commodities experienced long-term price strength.
3. The Oil Supercycle (1970s–1980s)
Triggered by:
OPEC oil embargo in 1973
Geopolitical conflicts in the Middle East
Oil prices surged, reshaping global energy markets and pushing investment into oil exploration.
4. The China-Driven Supercycle (2000–2014)
The most powerful modern supercycle was driven by:
China’s entry into the WTO
Massive infrastructure, manufacturing, and housing expansion
Urbanization of over 300 million people
Demand for iron ore, copper, aluminum, coal, and crude oil skyrocketed.
This cycle slowed around 2014 as China shifted from infrastructure-led growth to services and technology.
3. Why Supercycles Matter in Today’s Global Market
A. They Shape Global Inflation
High commodity prices raise:
Manufacturing costs
Transportation expenses
Food prices
This can create global inflation waves, affecting interest rates and monetary policy.
B. They Influence Currency Markets
Countries that export commodities (e.g., Australia, Brazil, Canada, Russia) see stronger currencies during supercycles. Import-dependent countries face currency pressure and trade deficits.
C. They Impact Corporate Profits and Investment
Industries like:
Mining
Energy
Infrastructure
Fertilizer and agriculture
experience earnings booms, leading to stock market rallies.
D. They Shift Geopolitical Power
Nations rich in resources gain strategic leverage. For example:
Middle Eastern countries influence global oil supply decisions
African countries become key suppliers of metals needed for modern technology
4. Drivers Behind Modern Resource Commodity Supercycles
A. Urbanization and Infrastructure Growth
Large emerging economies such as India, Indonesia, Vietnam, and African nations are expanding rapidly. This increases demand for:
Steel
Cement
Copper
Coal
Crude oil
B. The Green Energy Transition
A powerful emerging driver is the global push for clean energy. Technologies such as electric vehicles (EVs), solar power, wind turbines, and grid batteries require huge quantities of metals like:
Lithium
Nickel
Cobalt
Graphite
Rare earth elements
Copper
Copper alone is essential for wiring, EV motors, and renewable energy grids. Demand may double over the next 20 years, making it a central metal in the next supercycle.
C. Supply Constraints and Underinvestment
For nearly a decade after 2014, mining and oil companies faced:
Low prices
Investor pressure to reduce debt
Capital discipline
As a result:
New oil fields were not developed
Few mega-mines came online
Exploration budgets were cut
Thus, supply is tight just when demand is rising, feeding a potential supercycle.
D. Geopolitical Conflicts
Issues such as:
Russia–Ukraine war
U.S.–China trade tensions
Middle East conflicts
Shipping disruptions (Red Sea, Panama Canal)
increase risks and disrupt supply chains, pushing prices up.
E. Monetary and Fiscal Stimulus
Large government spending on infrastructure, clean energy, and defence increases demand for raw materials. Meanwhile, inflation reduces purchasing power and encourages investment in commodities as a hedge.
5. Types of Commodities Affected in a Supercycle
1. Energy Commodities
Crude oil
Natural gas
Coal
Demand rises with industrial growth, transportation, and manufacturing.
2. Metals
Base metals: copper, aluminum, nickel, zinc
Precious metals: gold, silver
Battery metals: lithium, cobalt, rare earths
Metals are central to construction, electronics, EVs, renewable energy, and defence.
3. Agricultural Commodities
Wheat
Corn
Soybeans
Sugar
Edible oils
Agri supercycles are triggered by population growth, climate disruptions, and biofuel demand.
4. Soft Commodities
Cotton
Coffee
Cocoa
They respond to supply shocks from weather, pests, and geopolitical disruptions.
6. Signs That a New Commodity Supercycle May Be Emerging
Economists and market analysts look at structural indicators, including:
A. Rising Long-Term Demand
India’s growth, rising consumption in Africa, and global electrification indicate sustained demand for metals and energy.
B. Years of Underinvestment in Extraction
Supply gaps in oil and metals show that companies need a decade to catch up, creating prolonged price pressures.
C. Green Technology Boom
EV adoption, solar and wind installations, and smart grids require unprecedented quantities of metals.
D. Geopolitical Realignments
Countries are seeking secure supply chains through:
“Friendshoring”
“Resource nationalism”
Strategic reserves
These moves can raise prices across the board.
E. Climate-Driven Agricultural Volatility
Extreme weather events increase uncertainty in food supply, potentially driving long-term price trends.
7. Impact of a Commodity Supercycle on Global Stakeholders
A. For Investors
A supercycle can create multi-year opportunities in:
Mining and metal stocks
Oil and gas companies
Renewable energy miners (lithium, REEs)
Agriculture and fertilizer companies
B. For Countries
Resource-rich countries benefit through higher export revenues and stronger currencies.
Import-dependent countries face inflation and trade deficits.
C. For Businesses
Costs rise for manufacturers, construction firms, and energy-intensive industries.
D. For Consumers
Inflation affects:
Fuel prices
Food costs
Housing and infrastructure prices
Conclusion
A resource commodity supercycle is a powerful force that reshapes global markets, economies, and investment landscapes. Driven by structural megatrends—urbanization, green energy transition, supply shortages, and geopolitical shifts—today’s global economy may be entering a new and long-lasting supercycle. Understanding its mechanics helps investors, policymakers, and businesses position themselves strategically for the next decade.
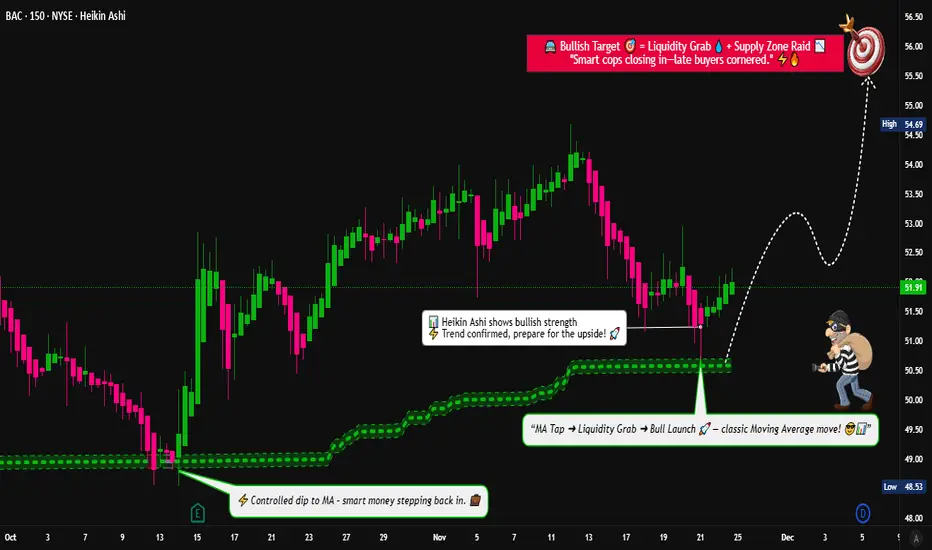
BAC Pullback Into MA — Is This the Next Swing Continuation Move?🔥📈 BAC — Bullish Pullback Playbook Into MA | Thief-Style Layer Entry 📊💼
Hey Traders! 😎
Here’s my Bullish Pullback Into Moving Average playbook on BAC — Bank of America Corp (NYSE).
Clean setup, thief-friendly layering, and a classy escape plan 😅🕶️💸
📘 Asset
BAC — Bank of America Corporation (NYSE)
Swing-trade style breakdown with a professional twist and a few laughs for the OG Thief Family 😄💼
🎯 Plan: Bullish Pullback Into the Moving Average
Price is dipping beautifully back toward key Moving Averages — classic bullish continuation behavior.
I’m monitoring for strength after the pullback along the MA zone. ✔️
🟦 Entry Plan (Thief Layering Strategy)
Thief strategy = multiple limit orders placed at different value zones.
This helps average in during the pullback without chasing. 👇💰
🔥 Layered Buy Limit Zones:
50.50
51.00
51.50
52.00
(Feel free to extend the layers if your own plan requires it.)
This is NOT a buy signal — only an example of a layering method for educational purposes.
🛑 Stop Loss (Thief Style)
Thief SL zone: 49.00
This is merely an illustrative SL point in my personal playbook style.
Note: Dear Ladies & Gentlemen (Thief OG’s), I am not recommending that you use my SL.
You make your own decisions and manage risk according to your plan.
🎯 Target Zone
We have strong resistance overhead + extended levels + potential liquidity traps.
So the smart thief knows when to take the bag and vanish 🏃💨💰
My take-profit zone: 56.00
Note: Dear Ladies & Gentlemen (Thief OG’s), I am not recommending that you use my TP.
You make your own choices — take money when you want, at your own risk.
🧠 Market Notes & Why the Setup Works
Price respecting MA structure
Clear bullish momentum on higher timeframes
Liquidity resting above recent swing levels
Healthy pullback with momentum probability toward continuation
Good behavior around institutional zones
🔗 Related Pairs to Watch (Correlation Insight)
BAC has measurable correlation with U.S. financial-sector instruments. Watching them helps confirm sentiment 🧩📊
AMEX:XLF — Financial Select Sector ETF
When XLF is strong, BAC often follows the broader sentiment.
NYSE:JPM — JPMorgan Chase
Sector correlation; bullish flow here can support BAC continuation.
$C — Citigroup
Similar pullback and continuation behavior; keep an eye on banking flow.
AMEX:SPY — S&P 500
Strong indices = supportive environment for major banks.
📘 Quick Correlation Summary
Banking stocks move together due to macro factors like rates, liquidity, and earnings expectations.
Strong AMEX:XLF + bullish AMEX:SPY generally improves probability for bullish pullbacks in BAC.
If all “sister pairs” show weakness, expect slower continuation.
✨ “If you find value in my analysis, a 👍 and 🚀 boost is much appreciated — it helps me share more setups with the community!”
⚠️ Disclaimer
This is a thief-style trading strategy created for educational and fun purposes only.
Not financial advice, not signals, and not a recommendation to buy or sell any asset.
NVO Turns Bearish! Clean Breakdown Below Weighted MA💼🐻 NVO Bearish Playbook — Weighted MA Breakdown | Thief Layered Sell Setup
🚨 Asset: NVO – Novo Nordisk (NYSE)
📝 Style: Swing / Day Trade Profit Playbook
📉 Bias: Bearish momentum confirmed after Weighted Moving Average (WMA) breakout
📉 Trade Plan — Clean Bearish Setup Activated
The bearish structure is confirmed as price breaks under the Weighted Moving Average, signaling that upside power is weakening and sellers are gaining full control. Momentum, structure, and trend all align for a controlled downside thief-style opportunity 😈📉
🎯 Thief Layered Entry Strategy (Professional Version)
Thief strategy = multiple staggered limit orders to catch premium fill levels.
Here’s the setup ⬇️
🔥 Sell Limit Layers:
49.00
48.00
47.00
46.00
(You can extend or increase layers based on your own risk preferences. Thief OG’s know the drill 😎🕶️)
👉 Any price level is allowed — this is a flexible layering system designed for optimal fills when liquidity sweeps occur.
🛑 Stop Loss — Thief Escape Hatch
SL @ 52.00
⚠️ Dear Ladies & Gentlemen (Thief OG’s):
This SL is not a recommendation — trade your own plan, adjust based on your personal risk. You make the money; you take the money at your own risk. Stay sharp 🦊📛
💰 Target Zone — Police Barricade Support Zone
Police barricade = strong support area + oversold pocket + liquidity trap potential 🚧🎯
📌 Final Target: 36.00
⚠️ Again, dear Thief OG’s:
TP is your own choice — this is not a fixed recommendation. Manage profits based on your strategy and risk appetite.
📊 Key Notes for Traders
Bearish momentum confirmed through WMA breakdown
Layered entries help reduce overall cost and increase probability of catching liquidity spikes
Target aligns with strong historical support + oversold metrics
SL placed above structural invalidation & liquidity pocket
🌍 Related Markets to Watch (Correlation & Behavior)
These pairs/stocks often react with similar flows due to healthcare sector momentum and large-cap institutional rebalancing:
🩺 Healthcare Stocks to Watch:
NYSE:LLY (Eli Lilly) → Strong correlation in pharma trend rotations
NYSE:PFE (Pfizer) → Tracks sentiment in healthcare risk cycles
NYSE:MRK (Merck) → Often mirrors sector weakness or defensive flows
📈 Broader Market Influence:
AMEX:SPY → Large-cap direction impacts NVO’s liquidity flow
AMEX:XLV (Healthcare ETF) → Best sector barometer for confirmation
NASDAQ:QQQ → Tech risk-on cycles can reduce defensive pharma demand
🧩 Key Correlation Points:
Defensive sectors weaken → Pharma tends to retrace deeper
Strength in USD → Pressure on foreign-listed healthcare stocks
Broad risk-off → Market-wide liquidity tightening supports bearish setups
✨ “If you find value in my analysis, a 👍 and 🚀 boost is much appreciated — it helps me share more setups with the community!”
🔒 Disclaimer: This is a thief-style trading strategy just for fun. Trade at your own risk.

COIN - Alternative count?I've been calling for a decent 4th wave correction for a number of US equities but this count has been growing in weight in the back of my mind in recent days. It suggests that the preceding wave 3 was extended in it's wave 5 and now the 4th wave correction may have finished at the wave 4 level of that degree. I will be looking for 5 waves up from this move to see if this count has merits.....

MSFT: another 1-2, 1-2 countMSFT: I count MSFT as starting a new 5-wave sequence at the 2022 bear market low and have completed Waves 1, 2, and i of 3.
Wave 2 corrected a bit more than 38.2% and Wave ii of 3 so far has corrected 38.2% as well. It's common for a Wave 2 to correct 50% so both degrees of Wave 2 are short.
MSFT is a long-term hold for me and I see no reason to be concerned.

$AMD: Wave iii about to startNASDAQ:AMD was in a huge WXY correction since 2021 high until April 2025 low. I count it as 1-2, i, ii of 3.
Wave ii corrected 61.8% of wave i. Wave 2 didn't go deeper due to the OpenAI announcement, which started Wave i of 3.
Since we're now have seen a 3-wave up, it is possible that it is a zigzag for XX as opposed to Waves 1-2, i, ii of 3. However, I assign the alternate count a smaller probability.
Many tech stocks are about to finish or have already finished a wave 2 correction so this can be the same for $AMD.
Bears will try to push it down to fill the gap. If that happens, I plan to add to my long-term position.
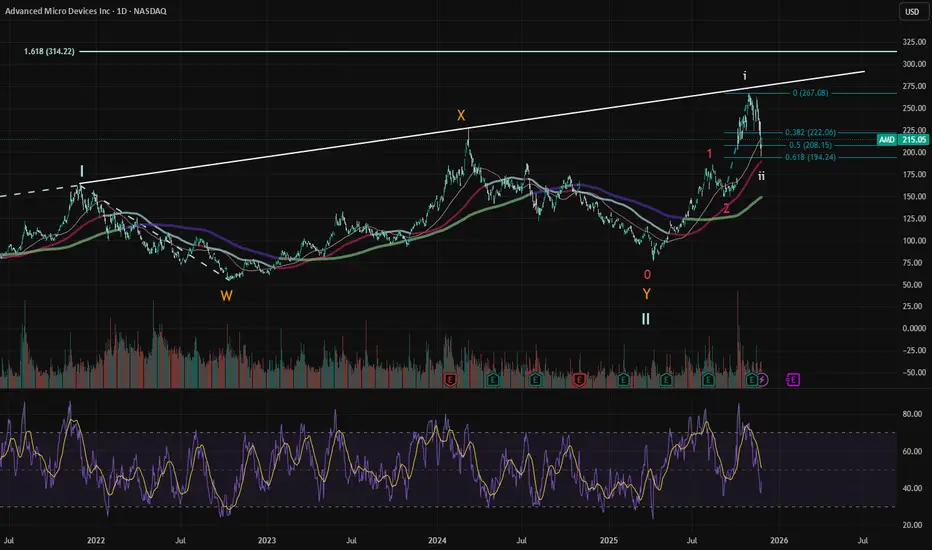
Elliott Wave Full Cycle. A shallow wave 2 means its more likely wave 4 would end deep, around (.618).
Also, wave 5 would presumably truncate in consideration that wave 3 drained up momentum in its advance.
GOOGL skyrocketed with the launch of Gemini 3
The new LLM model, Gemini 3, unveiled last week, has garnered positive reviews. Salesforce founder Benioff, who used ChatGPT daily for three years, stated that after using Gemini 3 for about two hours, he has no intention of returning to ChatGPT. Google's share of the AI market has significantly increased, rising from 23.4% before the launch of Gemini to 30.1% afterward.
Altman is also wary of Gemini. Referring to Google's recent AI achievements, he acknowledged that the internal atmosphere at his company might be uneasy for some time and that Google could present a temporary economic headwind to the firm.
GOOGL maintains its steep uptrend, approaching the ascending channel’s upper bound and the resistance at 320.00. Diverging bullish EMAs point to a potential uptrend extension.
If GOOGL breaches above the channel's upper bound and 320.00, the price may advance toward the new high and psychological resistance at 330.00.
Conversely, if GOOGL fails to close above 320.00, the price may temporarily retreat toward the following support at 300.00.

GM | New All Time Highs Incoming Before the Drop | LONGGeneral Motors Co. engages in the designing, manufacturing, and selling of trucks, crossovers, cars, and automobile parts, and in providing software-enabled services and subscriptions. It operates through the following segments: GMNA, GMI, Cruise, and GM Financial. The company was founded by William C. Durant on September 16, 1908 and is headquartered in Detroit, MI.

SNOW 4 HRThis chart shows the price action of Snowflake Inc. (SNOW) on the 4-hour timeframe, with a combination of trendlines, support zones, a gap zone, and a projected bearish region marked in orange for visual guidance.
1. Overall Trend Context
The recent price movement shows a sharp decline from a previous high, followed by a retest attempt that failed and continued downward.
The chart uses dotted trendlines to outline potential directional paths.
2. Fib-Based Rejection Zone (Top Arc Area)
Above the current structure, semi-circular colored arcs (Fib-style fan/arc) highlight where price previously faced resistance.
This area shows:
A cluster of curved resistance levels
The point where the decline began
A strong rejection, confirming selling pressure at those levels
3. First Support Zone (Mid-Level)
Labeled “1st support”, this is the first major area where buyers might attempt to stabilize the price.
Located just beneath the current price
Highlighted in green and brown shading
Suggests a potential bounce zone if momentum slows
4. Second Support Zone (Deeper Level)
Below the first one, “2nd support” marks a wider structural support.
Represents a deeper potential retracement
This region aligns with previous price interactions
Acts as a more significant level if the downtrend continues
5. Gap Area (Earlier in the Chart)
A rectangular “GAP” box on the left shows an earlier price gap.
Price moved up too quickly, leaving an imbalance
Gaps often act as magnets for price
The dotted lines connect this gap to future possible interaction points
6. Bearish Zone (Lower Right Red Area)
A wide red wedge labeled “bearish” shows the projected zone where sentiment becomes significantly negative.
Positioned between ~186–200
Indicates a key downside level where the chart's structure turns into a clearly bearish outlook
Highlighted with red shading and dotted boundaries
7. Trendline Structure
Multiple orange dotted trendlines illustrate
Possible upward recovery paths
Possible continued downward pressure
Long-term diagonal supports and resistances extending into the future
These lines help visualize potential direction depending on how price reacts at each support.

FER | Highway and Freeway Construction will Rise | LONGFerrovial SE provides infrastructure construction and transportation services. It offers all kinds of services related to urban and interurban transport infrastructure, either by land, sea or air. The company was founded by Rafael del Pino y Moreno on December 18, 1952 and is headquartered Amsterdam, the Netherlands.
