A10 Networks (ATEN) — DDoS, ADC, and Edge Security TailwindsCompany Overview
A10 Networks NYSE:ATEN provides advanced cybersecurity and application delivery across cloud, hybrid, and carrier networks—direct exposure to rising demand for DDoS protection, secure networking, and cloud infra security.
Key Catalysts
Threat Landscape & Compliance: Escalating global cyberattacks + stricter regs are accelerating adoption of Thunder ADC and ThreatX—mission-critical for high-performance, distributed environments.
Execution Momentum: Q3’25 revenue $75M (≈+5.6% beat) and EPS $0.17 (≈+9.7% beat) underscore resilient demand and leverage to a recovering IT spend cycle.
5G & AI Infrastructure: A10’s load balancing, DDoS, and edge security sit in the flow of 5G rollouts and AI data center growth, supporting multi-year capacity upgrades.
Platform Differentiation: Carrier-grade performance, automation, and visibility help consolidate point tools while optimizing latency and throughput.
Why It Matters
✅ Direct play on cloud + telco capex (5G/edge)
✅ Beneficiary of AI-era traffic growth and low-latency requirements
✅ Balanced mix of appliance, software, and subscription helps cushion cycles
Investment Outlook
Bullish above: $14.75–$15.00
Target: $22.00–$23.00 — driven by enterprise/telco upgrades, AI/edge security demand, and continued operating discipline.
📌 ATEN — securing next-gen networks with high-performance ADC and DDoS protection.

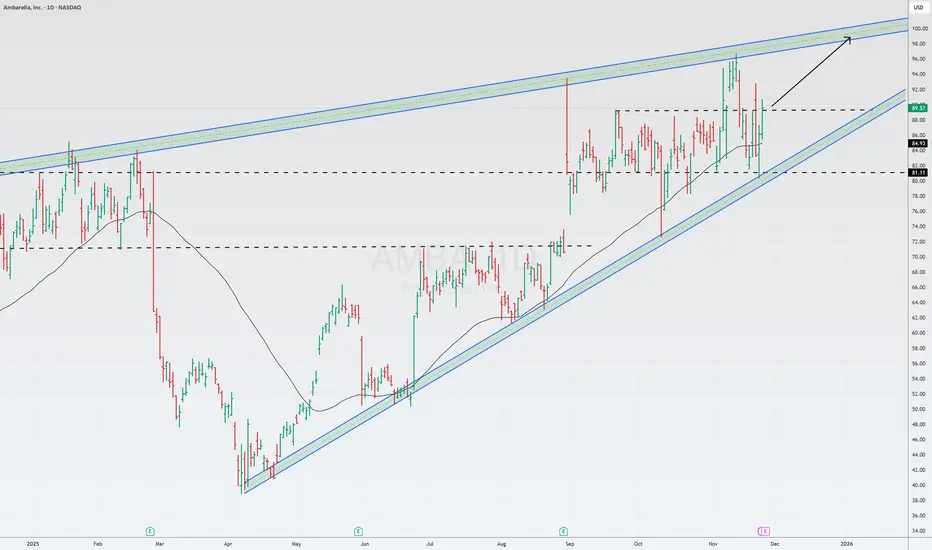
AMBA US🌎 Ambarella is demonstrating impressive revenue growth, exceeding 50% year-on-year, thanks to a strategic shift in focus from the automotive market to the Internet of Things (IoT). IoT, rather than the once-primary focus of autonomous vehicles, now generates the majority of revenue and is a key driver behind the company's improved financial outlook.
Ambarella's investment case was previously based on promising but slowly developing autonomous driving projects. Today, 75% of its revenue comes from the IoT segment, which includes not only surveillance cameras but also wearable cameras, robotics, and edge computing equipment.
The foundation of this success is the new CV5/CV7 processors, manufactured using 5nm technology. These chips are unique in their ability to combine image processing, video encoding, and artificial intelligence on a single chip. This integration allows the company to offer more powerful solutions for compact, power-constrained devices (such as drones or video cameras) and set high prices, avoiding direct price competition with lower-cost manufacturers.
The short product development cycle for IoT allows R&D investments to be converted into revenue more quickly compared to the long cycle time for automotive products. Using a common technology platform (CVflow) for both IoT and automotive applications reduces development costs.
Cons:
Growth is not converting into significant free cash flow. There is a worrying dependence on a single distributor (WT Microelectronics, 71% of revenue) and a single manufacturer (Samsung), creating supply chain risks. High chip production costs may begin to pressure profitability.
Lexeo Therapeutics, Inc. (LXEO) Links Heart And Brain WorkLexeo Therapeutics, Inc. (LXEO) is a clinical-stage genetic medicines company developing AAV gene therapies for inherited heart disease and APOE4-associated Alzheimer’s. Their pipeline targets cardiomyopathies like Friedreich ataxia-related disease and other genetically defined cardiovascular conditions, plus CNS programs that aim to protect high-risk Alzheimer’s patients. Growth is driven by clinical trial milestones, regulatory support, and rising demand for precision, one-time treatments.
On the chart, a confirmation bar with increasing volume signals buyers stepping in as price pushes above the .236 Fibonacci level and into the momentum zone. After that break, traders can lock in risk by setting a trailing stop using the Fibonacci snap tool just under the .236 line, letting the trade breathe while still having a clear line in the sand if momentum fades.

IREN eyes on $77.63: Golden Genesis at ATH may give DIP buyIREN got a big surge on deal news with Microsoft
The surge has hit a Golden Genesis fib at $77.63
Look for a Break-n-Retest or Dip-to-Fib like $70.73

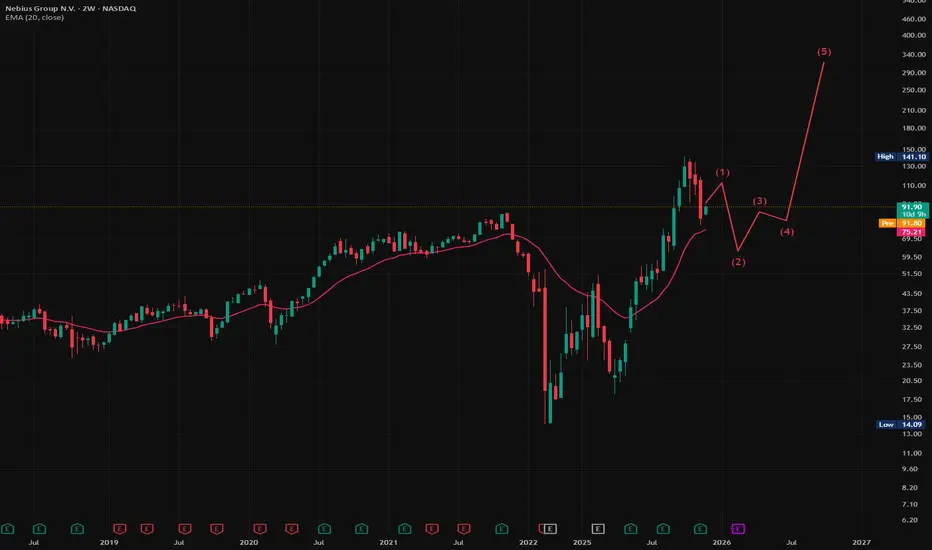
$NBIS is most likely in a broad range for a whileNebius is an AI-centric cloud + GPU infrastructure play. Great narrative for the coming years.
But technically, I’d wait. It just triggered a correction after ~25 weeks of trend strength and made small double-top. Historically, it usually needs more time.
Next ~6 months probabilities:
20%: strong upside expansion
20%: major downside leg
60%: broad chop/range ($50–$140)
Conclusion: I will likely be long in the future but for now there are better swing trades to take.
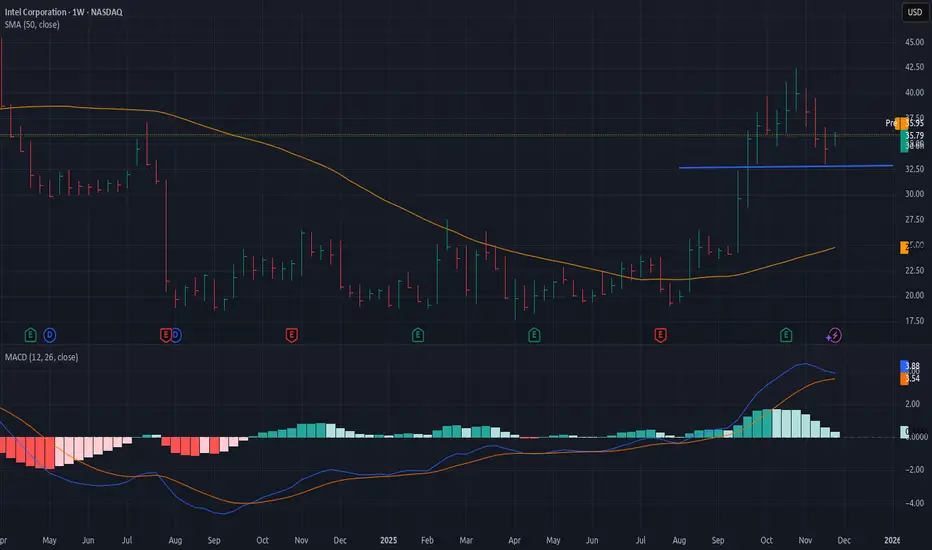
INTC long-term TAIntel is strong, it's a beautiful reversal of a downtrend on a long-term trend. Current uptrend is in correction and there's a distribution going on mid-term, which means now is not the best time to enter but considering strong weekly reversal INTC is something you should keep an eye on and pick up. The blue line for the support has been standing so far, we will see if it's going to be the lowest target in this correction.
DELLDELL has pulled back sharply from the September peak & remains below its 50d MA, so trend pressure remains downward heading into earnings since price rejected off it cleanly earlier in November
This makes earnings more binary since support is more vulnerable on a miss
RSI ~38 is still washed out, so there is room for a reversal & stochastics turning up which suggests early bullish divergence
Price is under the short-term trend, but momentum is turning up
This combination tends to produce violent post-earnings moves because a trend-down with momentum curling means the catalyst decides the direction
Upside potential is cleaner into earnings because price sits far beneath the 50d MA which means a good print results in an immediate reclaim attempt of $138-$144 since shorts covering into a 50d MA breakout creates a slingshot move; however, the downside is no longer cushioned by a long-term MA so a bad print may result in a fast flush through $124 & sellers will push for $115-$118
The implied earnings setup shows a bullish break could open the path back to $150-$155 making the 50d MA support again, but a miss, shows bearish continuation where price loses $124 with a straight shot to $115-$118
NASDAQ:QQQ AMEX:SPY

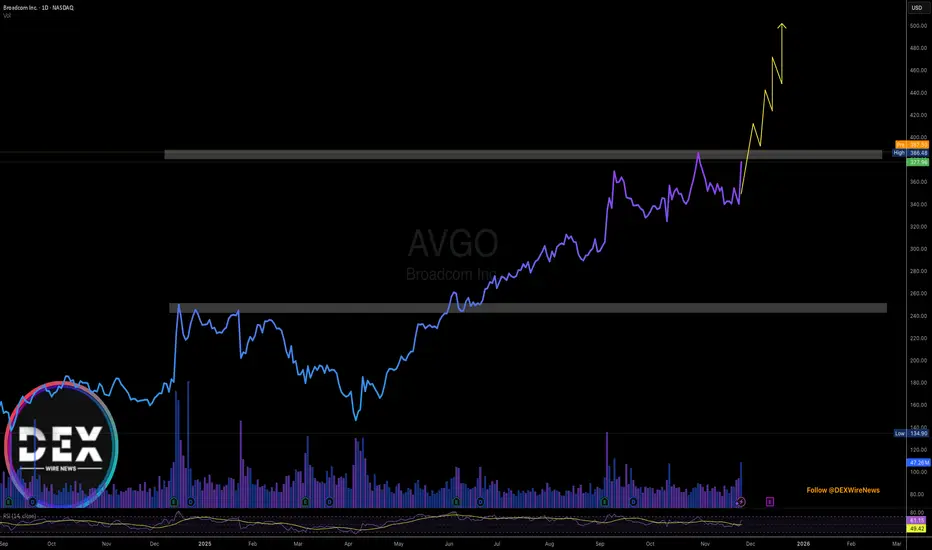
Breaking: Broadcom Inc. (AVGO) Surged 11% Yesterday Eyeing $500 Broadcom Inc. (NASDAQ; NASDAQ:AVGO ) shares saw a noteworthy uptick of 11% in extended market trading further extending the gains to todays premarket session up by 2.34%.
Should the stock break the ceiling of the $388 resistant zone, coupled with the RSI at 61, a bullish move to the $500 resistant is feasible and possibly $700 before the year runs out.
Similarly, failure to pull that stunt from NASDAQ:AVGO might resort to a move to the $250 support point.
With earnings slated for December 11th, 2025, In 2024, Broadcom's revenue was $51.57 billion, an increase of 43.99% compared to the previous year's $35.82 billion. Earnings were $5.90 billion, a decrease of -58.14%.
Analyst Summary
According to 28 analysts, the average rating for AVGO stock is "Strong Buy." The 12-month stock price target is $353.86, which is a decrease of -6.38% from the latest price.
About AVGO
Broadcom Inc. designs, develops, and supplies various semiconductor devices and infrastructure software solutions worldwide. The company operates in two segments, Semiconductor Solutions and Infrastructure Software. It provides Ethernet switching and routing custom silicon solutions, optical and copper physical layer devices, and fiber optic transmitter and receiver components; set-top box system-on-chips (SoCs), data over cable service interface specifications cable modem and networking infrastructure.
GOOGL long-term TAGoogle is strictly bullish on long-term, is one of the best survivors in tech sector at the moment during this market correction. But be aware of the negative divergence on mid-term, the negative correlation between price and volumes accumulation has been building up recently, which means eventually the correction will occur and then it could be a wise stock to pick up.

QBTS long-term TAD-wave is going through the countertrend correction on weekly that has started about a month ago and it's almost done, mid-term is still broken so it needs more time to finally bottom out but there are plenty of resources on weekly time frame to continue the uptrend.

Cognex (CGNX) – Downtrend Breakout + Double Bottom ConfirmationOn the Weekly timeframe , NASDAQ:CGNX is showing strong bullish technical signals:
The long-term downtrend line has been broken both on body and shadow, confirmed with high volume .
The last weekly candle is forming near a retest, while on the Daily chart, a strong bullish candle confirms buyers stepping in.
A clear Double Bottom pattern has formed, with the neckline overlapping the downtrend line, providing stronger confirmation.
Price is trading above EMA50 & EMA100 , with EMA50 attempting a bullish cross over EMA100.
The stock has also broken through local resistance , opening the way for higher targets.
MACD is bullish, showing positive momentum.
RSI is already inside the overbought zone. However, since no divergence is present, this could still support bullish continuation, though short-term pullbacks are possible.
Key Levels:
If the breakout and retest confirm, the first target is the nearby resistance zone.
A further move towards the next resistance level (~$72–73) is possible if momentum sustains.
Important Note:
This analysis is not a buy/sell signal , but rather an educational outlook. While technicals are bullish, traders should remain cautious as RSI is in the overbought zone, where short-term corrections are common.
(For educational purposes only, not financial advice.)

SMCI - Bull Flag Breakout SetupSMCI formed a strong bullish impulse followed by a bull flag pattern.
A breakout above the flag structure may signal continuation if confirmed with strong price action.
Trade Plan:
• Entry: On breakout or retest
• Stop Loss: Below flag support
• TP1: Recent high
• TP2: Measured flagpole extension
This setup is worth monitoring for potential bullish continuation.
Disclaimer: This is not financial advice. For educational purposes only.

Walt Disney (DIS) – Reversal Cup & Handle FormationOn the Daily timeframe, NYSE:DIS is forming a reversal cup and handle pattern.
The price is moving below both EMA 50 and EMA 100 , confirming short-term bearish momentum. The recent decline matches the depth of the previous cup’s widest part, indicating potential continuation toward the next strong support near $106.
If this support level breaks, the price could move down to test the psychological zone around $100 , and possibly fill the gap below it.

TESLA IS ENTERING A CRITICAL ZONETesla currently remains in an uptrend while moving inside the existing ascending channel. The most recent reaction came from the trendline, but an important structure has formed above: a clear double top pattern . After the pattern completed, price declined and is now retesting the neckline, which has already acted as resistance. The 50 EMA is also positioned at this same level, adding confluence.
According to the mechanics of the double top, the expected downward projection is typically equal to the distance between the top of the pattern and the neckline. That measured move aligns almost perfectly with the lower support zone and the 200 EMA , forming a strong confluence area.
Additionally, there is an imbalance inside that lower region, which commonly pulls price back to fill it. RSI has formed a downtrend and is moving toward the 30 level, which supports the likelihood of a continued decline.
If price breaks above both the RSI downtrend and the neckline, the move back upward along the channel becomes possible. However, the bearish confirmations remain strong unless a significant positive catalyst invalidates the setup.

It is a time for MPLT - 40% POTENTIAL PROFIT - 18.50 USDOn the 4H chart of MapLight Therapeutics, the price is sitting in a heavily oversold zone after an extended downward move, but the recent candles indicate a potential slowdown in selling pressure. The price is reacting near a local bottom, suggesting that the market may be forming a base for a possible rebound. Additionally, the RSI is hovering near extreme oversold levels, which historically often precedes short-term upward corrections.
Although the moving average is still angled downward, it has begun to flatten, hinting at a potential shift in momentum. If buyers defend the current support zone, the market may generate a short-term bullish impulse.
Under such a scenario, a natural target for the price would be a move toward $18.50, which represents a significant resistance area based on previous market reactions and a psychologically important level for traders.
⚠️ Disclaimer: This analysis is for informational and educational purposes only. It does not constitute financial or investment advice. Always conduct your own research or consult a licensed financial professional before making investment decisions.

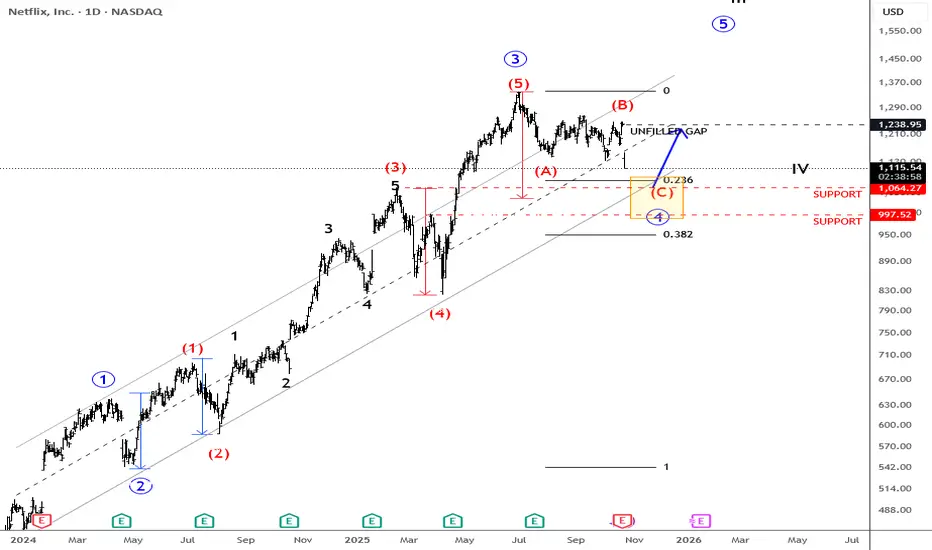
Netflix Down After Earning, But Its Hunting SupportNetflix is coming down after earnings and is currently trading more than 10% lower. Whenever we see such a sharp reversal, it’s important to zoom out and look at the broader trend. From the 2023 lows, there is still a very strong and impulsive recovery, so this could be just a temporary deeper corrective pause before the uptrend resumes.
In Elliott Wave terms, it looks like a potential fourth wave retracement that could start to stabilize somewhere around the previous wave three high near the 1060 area, or possibly a bit lower, closer to the 1K level. This whole zone could be quite attractive for a rebound, especially since some of the gaps above the current price may still be filled — something that often happens when a stock remains in an uptrend.
In my view, there’s still a good chance for a nice recovery and continuation higher in the weeks to come.
Grega
Highlights:
Trend: Bullish (consolidation in wave four approaching support)
Support: 1060, 1000
Resistance: 1260
Note: Stock can stabilize after wave 4 and try to fill the earnings gap at some point in the future.
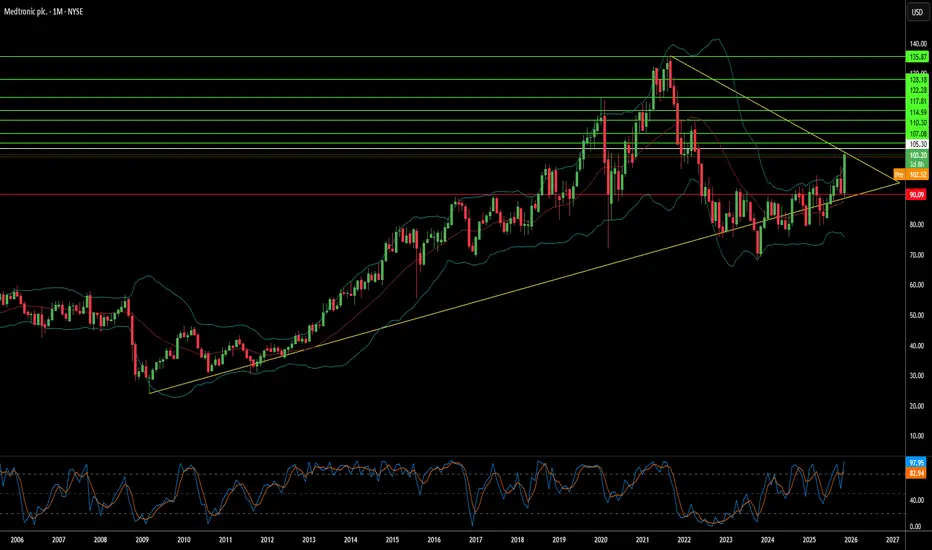
Can a Medical Giant Transform Into a Growth Story?Medtronic has demonstrated significant momentum entering 2026, with its recent 23% share price appreciation reflecting fundamental improvements rather than speculative enthusiasm. The company delivered strong fiscal Q2 2026 results with revenue reaching approximately $9 billion, up 6.6% year-over-year, while adjusted earnings per share rose 8% to $1.36, surpassing both internal projections and analyst expectations. Most notably, cardiovascular revenue surged 10.8% to roughly $3.4 billion, marking the strongest growth in over a decade outside pandemic periods and suggesting sustainable acceleration across its core business.
The company's pulsed-field ablation technology has emerged as a transformative growth driver, with the PulseSelect system achieving FDA clearance as the first PFA platform for treating atrial fibrillation. This innovation propelled a 71% revenue surge in Cardiac Ablation Solutions during Q2, including 128% growth in the United States. Beyond cardiology, Medtronic's Hugo robotic-assisted surgery system represents a strategic initiative to penetrate the underdeveloped surgical robotics market. The system has recently been submitted for FDA clearance following successful urologic trials, achieving a 98.5% success rate. These technological advances position Medtronic across multiple high-growth segments, including neuromodulation, renal denervation, and diabetes management.
From an investment perspective, Medtronic offers a compelling combination of quality, income, and growth potential. The company has raised its dividend for 48 consecutive years, maintaining Dividend Aristocrat status with a current yield in the low-3% range above the S&P 500 average while preserving capital for R&D investment and strategic acquisitions. Management has demonstrated improved execution with consistent guidance raises, and balanced capital allocation between shareholder returns and innovation funding. While risks remain around robotics execution, diabetes strategy decisions, and payer negotiations, the fundamental thesis appears intact for long-term investors seeking defensive growth with rising cash flows and exposure to structural healthcare trends driven by aging demographics and minimally invasive procedure adoption.
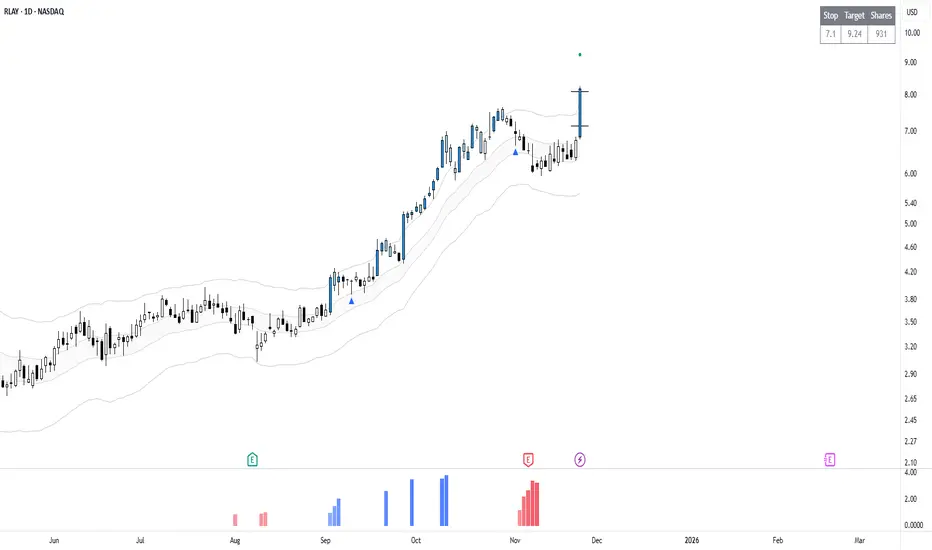
RLAY Trade ReviewThis approach is based on pullbacks. A pullback is a short-term counter-move in response to a strong impulse move. It is a controlled reversion towards the mean, which offers a structured approach to enter in case of momentum resumption. There is no precise execution point, rather approximation and patience.
A weekend watchlist is created using objective criteria and discretion. Alerts are placed and monitored during the week, with entries taken either on a valid pullback condition or in response to indication of continuation.
Watchlist: IMTX, NEE, FDMT, FE, EVRG, RLAY.
FE has been active since November 17 and has bracket orders. No interference.
RLAY Trade
Entry: 7.14
Stop: 2.25 ATR
Target: 1R
Risk: 1% of Account
The target was reached within the same session. Closed at 8.09 for a full 1R result.
If you want more trade reviews, weekend watchlists, or how to build a simple process, comment and let me know.
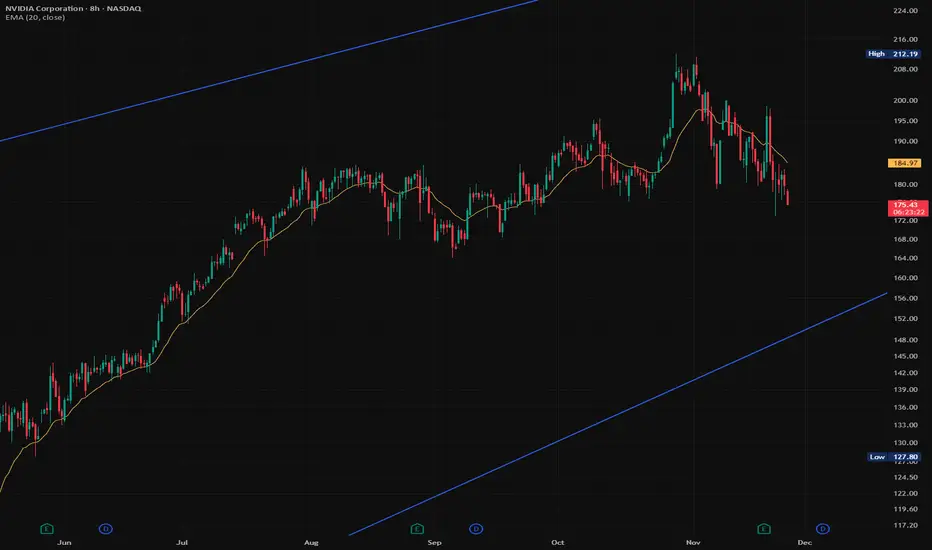
$NVDA Structure keeps improving for a move lower.Just added to my NASDAQ:NVDA short.
Structure keeps improving for a move lower.
And the competitive pressure is real:
NASDAQ:GOOGL ’sTPU stack is becoming a legitimate alternative to Nvidia for training/inference.
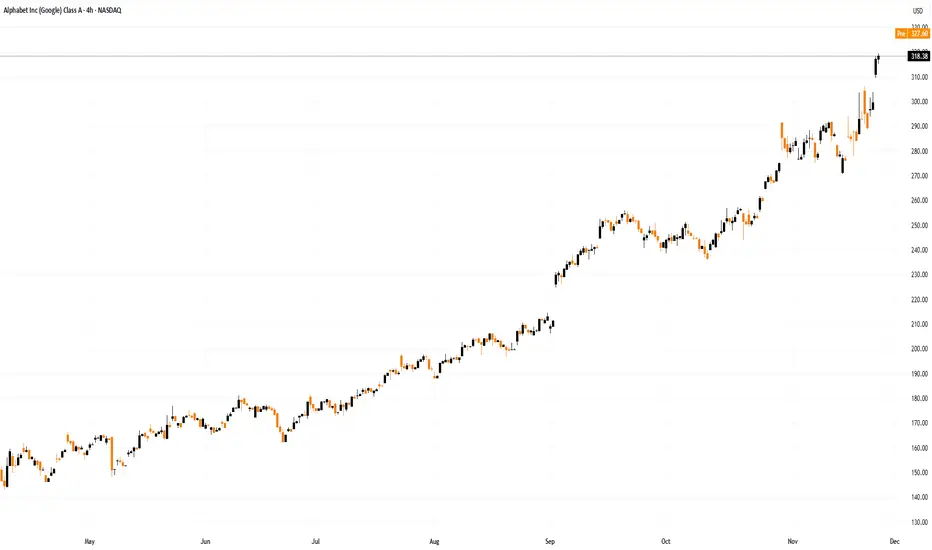
Alphabet (GOOGL) Shares Close Above $300 for the First TimeAlphabet (GOOGL) Shares Close Above $300 for the First Time
Charts show that Alphabet (GOOGL) shares have reached a record high, closing around $318. In doing so:
→ the price has surpassed the psychological $300 mark;
→ the stock has gained roughly 70% since the start of the year;
→ Larry Page has become the world’s second-richest person, after Elon Musk.
Why Have Alphabet Shares Risen?
The surge is explained by several factors, the most significant being news of strong performance in tests of the AI model Gemini, upgraded to version 3.0. In many benchmarks, it outperformed ChatGPT.
The rise in GOOGL’s share price seems to signal a shift in leadership in the “best AI” race — which could translate into higher sales of paid Gemini versions and increased revenue for Alphabet, which already exceeds analyst expectations, as confirmed by the report released in late October.
Technical Analysis of GOOGL Shares
Price movements have formed an ascending channel (shown in blue), originating in the summer of this year. Along the way, the price recently encountered resistance around:
→ $290: acting as a barrier following the earnings release;
→ $300: a psychological hurdle, as investors were hesitant to pay over three hundred dollars per share.
These levels had kept the price in the lower half of the channel. Now, with GOOGL’s fundamentals strengthened, the stock has reached the channel’s median — typically a point where supply and demand balance. It is reasonable to assume that:
→ the bullish momentum may begin to ease;
→ in the event of a correction, the $290–300 zone may shift roles to act as support, reinforced by the channel’s lower boundary.
This article represents the opinion of the Companies operating under the FXOpen brand only. It is not to be construed as an offer, solicitation, or recommendation with respect to products and services provided by the Companies operating under the FXOpen brand, nor is it to be considered financial advice.
Silicon Is Not Enough: The Rush for Metals That Drive AIIon Jauregui – Analyst at ActivTrades
The technological race of the 21st century is no longer fought solely in laboratories or data centers. The true power of artificial intelligence, quantum computing, and advanced defense depends on critical metals and rare earths that are extracted and processed in a handful of strategic facilities around the world. Hafnium, niobium, lithium, or neodymium are now geopolitical resources as sensitive as oil was in the 1970s.
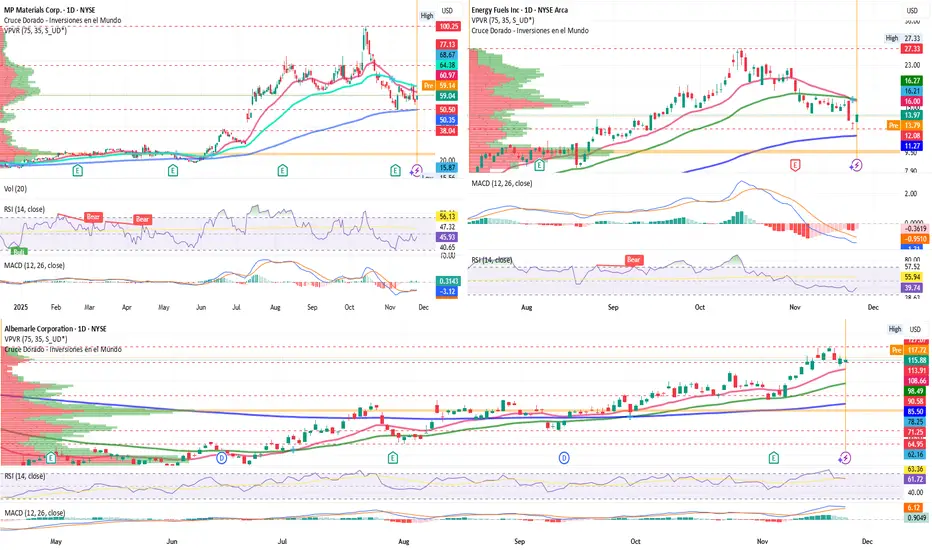
In this scenario, three companies emerge as key to the industrial autonomy of the West: MP Materials, Energy Fuels, and Albemarle Corporation.
MP Materials (MP.US): the return of U.S. industrial muscle
In the California desert, the Mountain Pass mine has become a symbol of the U.S. mining revival. Having been abandoned in the 2000s, it is now the only significant source of rare earths in the country. From there come the oxides essential for manufacturing permanent magnets, indispensable components in electric motors, guided missiles, drones, and robots. MP Materials wants to complete the value chain: not only to extract the mineral, but also to process it and transform it into finished magnets. A step that, if consolidated, would reduce the absolute dependence that the West maintains on China.
Fundamental
It has the strategic support of the U.S. government. It is making progress in vertical integration, key for industrial sovereignty. Results are pressured by the drop in global rare earth prices. It has high potential if it consolidates its refining and magnetization capacity.
Technical
The stock retreated from triple-digit highs to stabilize around $50, a zone that acts as long-term support above the 200-day moving average after losing the 50- and 100-day averages. Significant resistance appears around $77, while further corrections could take it to the $30–$40 range, where historical supports converge. Below lies the point-of-control zone, the previous price consolidation area before the May surges that led to the all-time high of $100.25. RSI is at 45.93%, near equilibrium, and MACD is in a recovery phase after a strong pullback.
Energy Fuels (Ticker AT: UUUU.US): North America’s strategic wildcard
Few companies have been able to leverage the geopolitical pivot toward nuclear energy like Energy Fuels. The company operates at the intersection of three critical industries: uranium, vanadium, and rare earths. Its White Mesa plant in Utah is one of the few complexes capable of processing high-purity strategic minerals in the West. At a time when governments in the U.S., Europe, Japan, and South Korea are seeking secure fuels for a global nuclear renaissance, Energy Fuels is in the right position.
Fundamental
It has been one of the beneficiaries of U.S. incentives for domestic uranium production. It is an emerging player in Western rare earth refining. Diversification reduces exposure to a single market. It is sensitive to uranium volatility, always a critical factor.
Technical
After a significant rise accompanying the uranium rebound, the stock has corrected sharply. The $12–$14 zones represent the technical area of greatest interest for base formation, while $10 remains immediate resistance and coincides with the point-of-control (POC) and previous consolidation area. The 100-day moving average acts as current support after the 50- and 100-day averages were lost. RSI is clearly oversold at 39.74%, and MACD confirms this bearish scenario.
Albemarle (Ticker AT: ALB.US): the giant sustaining electric mobility
Albemarle is one of the world’s major lithium powers, but limiting its importance to batteries would be a mistake. Its chemical compounds are used in catalysts, energy storage, power electronics, and defense systems. The drop in lithium prices since the 2022 highs impacted its profitability, but structural demand remains strong. With long-term supply agreements and presence in the largest deposits worldwide, Albemarle is an irreplaceable player in the global industrial chain.
Fundamental
It is the lithium leader with large-scale infrastructure. Its margins are under pressure, though stabilizing. The company has high operational leverage when lithium prices regain strength.
Technical
The stock has retraced after recently touching all-time highs at $127.07, moving to $155.88. The previous consolidation zone is around $81–$82, with a range between $90.58 and $64.95. Its moving averages remain clearly bullish, with RSI in overbought territory at 61.72% and MACD supporting the bullish theory, though reduced histogram volume could indicate slight exhaustion.
Around them orbit other relevant names like Lynas Rare Materials, Iluka Resources, TerraPower, Hyperion Metals, or Noveon Magnetics, all pointing to the same conclusion: the future of artificial intelligence is not decided in software, but in access to the materials that allow it to be built.
*******************************************************************************************
The information provided does not constitute investment research. The material has not been prepared in accordance with the legal requirements designed to promote the independence of investment research and such should be considered a marketing communication.
All information has been prepared by ActivTrades ("AT"). The information does not contain a record of AT's prices, or an offer of or solicitation for a transaction in any financial instrument. No representation or warranty is given as to the accuracy or completeness of this information.
Any material provided does not have regard to the specific investment objective and financial situation of any person who may receive it. Past performance and forecasting are not a synonym of a reliable indicator of future performance. AT provides an execution-only service. Consequently, any person acting on the information provided does so at their own risk. Political risk is unpredictable. Central bank actions can vary. Platform tools do not guarantee success.
$KO Tradespoon – Neutral Bias $71.21Tradespoon model shows a neutral setup for NYSE:KO . Predicted range: $70.62–$71.21. Trend: –0.13%. NYSE:KO

UAMY - United States Antimony Corp.One week charts
United States Antimony Corp. engages in the extraction, processing and sale of antimony, zeolite, silver, and gold products. It operates through the following segments: United States Antimony Operations, Mexican Antimony Operations, Precious Metals Recovery, and United States Zeolite Operations. The company was founded by John C. Lawrence in June 1968 and is headquartered in Thompson Falls, MT.
