AEHR - New Breed Semiconductor Stock With Pump PotentialAEHR has had a nice little bounce in the last hour as Nasdaq slumps.
This may be an example of higher risk providing a leading indicator:
This bounce may signal that a Nasdaq recovery will arrive in this area.
Notice on the right Nasdaq has slumped below support, bounced and then printed a lower low.
This has the potential to be a "shakeout of the shakeout" to stop out bulls that buy the shakeout bounce from below support.
Considering how impulsive Nasdaq has been to the downside , AEHR has held very well in this area - signalling strength in trend and likely continuation up.
And if it is a leading indicator, then Nasdaq may be completing a running 3 wave correction where the first wave down printed after the Trump threat on China tariffs.
For now Nasdaq certainly has its scary face on and there is no defined bullish pivot - so it could well slump lower.
But if it recovers then AEHR may move on up.
Notice that AEHR appears to be in a shallow compression fractal - so it may be building cause for a bullish pop.
...
AEHR is a high risk new breed semiconductor.
It appears to have much better fundamentals than other high volatility stocks I am covering btw - better than IONQ and other quantum stocks.
I have begun asking the AI for a score out of 10 for fundamentals - which seems quite helpful.
AEHR has a high score of the new breed tech stocks that I cover - 7.5 out of 10 and low bankruptcy risk 🤨.
AI write up:
" AEHR is best classified as a high-beta, small-cap growth stock in the semiconductor testing space, with strong revenue momentum but moderate margin pressure. Fundamentals score: 7.5/10. Bankruptcy risk: very low (0.63%).
Aehr Test Systems (NASDAQ: AEHR) operates in the semiconductor equipment sector, specializing in test systems for silicon carbide and other emerging technologies. With a market cap around $792 million and a beta of 2.42, AEHR exhibits high volatility and strong cyclical sensitivity, typical of growth-oriented tech stocks. Its recent 1-year share price gain of +86.66% underscores investor enthusiasm for its niche positioning in electric vehicle and power semiconductor testing.
From a fundamentals perspective, AEHR shows solid top-line performance. In its latest report (Q4 2024), revenue reached $32 million, growing +9.3% YoY, which outpaced the industry average. However, quarterly growth was just +2.1%, suggesting some deceleration. Earnings per share (EPS) hit $0.98, a healthy figure for its size. Profitability metrics are respectable: gross margin at 34%, operating margin at 18%, and net margin at 12%. While these margins are solid, the gross margin trails industry peers, hinting at room for cost optimization.
On the downside, AEHR’s valuation is stretched, typical for growth stocks. Its price-to-earnings ratio (P/E) is elevated, and its share price recently traded 23.5% below its 52-week high, reflecting some cooling after a strong run. The company’s fundamentals remain robust, but sustaining momentum will require margin expansion or new product wins.
Crucially, AEHR’s probability of bankruptcy is just 0.63%, based on Altman Z-score and other solvency metrics. This places it in the low-risk category, with no immediate signs of financial distress."
I bought back in here 👍.
This analysis is shared for educational purposes only and does not constitute financial advice. Please conduct your own research before making any trading decisions.

NVDA buy zone NVDA has had some bearish news recently despite very strong earnings. I believe this was the extent of the pullback and the stock has reached a local weekly demand zone. Given the multi year strength I doubt it pulls back to 130-140 but anything is possible. If I enter the trade here I’d be net long.

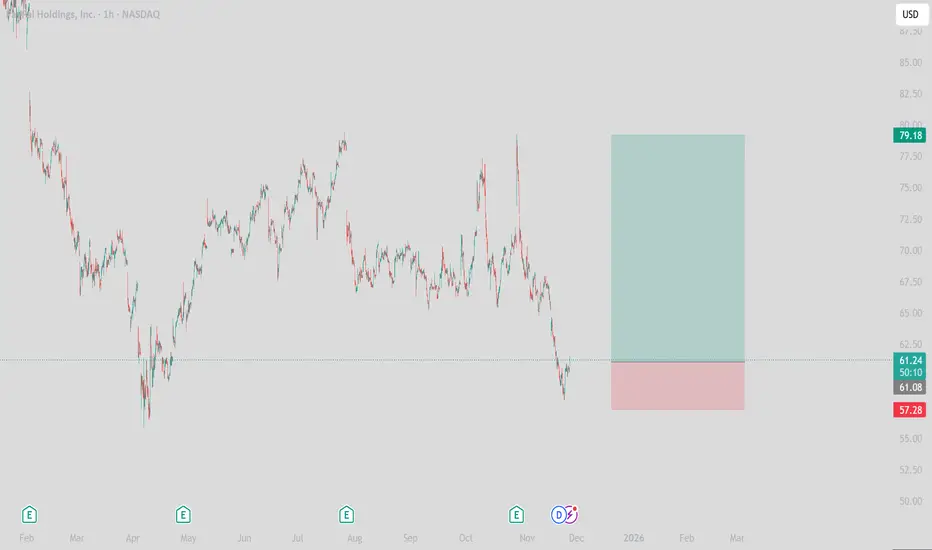
Coca-Cola: Approaching Key Resistance LevelCoca-Cola shares continue their upward trajectory, marked by minor pullbacks and brief periods of sideways movement. Overall, the stock maintains a bullish trend and is currently trading just below resistance at $74.38, which is likely to be tested next. We anticipate that the blue wave (y) will push the stock into our red short Target Zone between $76.58 and $81.51. Within this range, we expect the beige impulse wave III to complete. Once this high is reached, a significant correction is likely. As such, we view this zone as an opportunity to establish short positions. If a new high fails to materialize, it could indicate that the beige wave alt.III has already concluded. In that scenario, a direct drop below $65.35 would be expected (probability: 30%).

Zeta Global (ZETA) – Strong Fundamental Rebound SetupNYSE:ZETA Fundamental Overview
Zeta Global continues to show strong improvement in fundamentals.
Revenue growth:
From 2021 to 2024 revenue expanded from 360M to 1B, which represents a stable annual growth rate of 25 to 30 percent. This is a solid pace for a company still scaling into profitability.
EPS momentum:
Starting from 2023 EPS began accelerating rapidly. It grew 40 percent in 2023, then 60 percent, and based on quarterly trends 2024 EPS growth is likely to exceed 100 percent.
Quarter over quarter EPS growth from mid 2024 has also been stable at around 25 to 30 percent.
Current EPS is 0.12 and the company is moving closer to full profitability.
Forward valuation:
Forward P/E sits around 18.73 which is attractive considering triple digit EPS growth projections. This suggests that the stock is undervalued relative to forward earnings potential.
Free cash flow:
Free cash flow continues to improve. Historically, when EPS was negative, the stock still traded around 30 dollars. Now with much stronger EPS the stock is only 18 dollars, which highlights a valuation disconnect.
Dilution risk – the main negative factor:
Since 2022 the company has been increasing share count by roughly 2 to 3 percent each quarter.
A major dilution happened in November 2024 when shares increased by roughly 30 percent, which triggered the sharp decline from 30 to 18 dollars. This is currently the main fundamental risk.
Technical Analysis
Price is still inside a broad accumulation range.
Two key volume clusters:
14 to 22 dollars
7 to 9 dollars
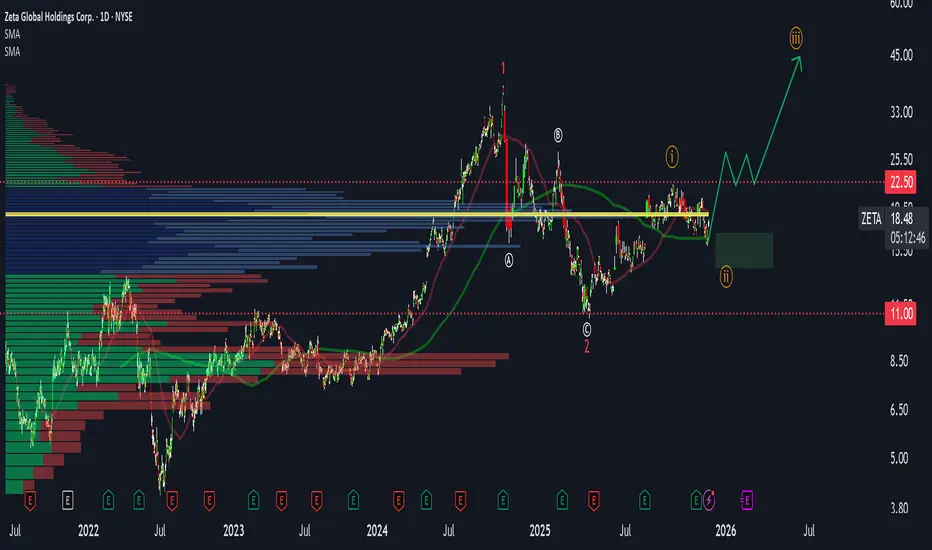
Current decline looks like a completed wave 2 correction with early signs of wave 3 formation.
Fibonacci structure:
Wave 2 typically retraces 38 to 62 percent.
The 38 percent level has already been touched, but price can still revisit 13 to 14 dollars which matches the subwave 4 zone of the previous wave 3. This creates a strong confluence support.
Entry and risk management:
Potential entry zone: 13 to 15 dollars
Stop loss: 11 dollars – below this level the structure becomes invalid
Targets:
22.5 dollars – high of wave 1
After breakout of this level: 38 dollars – global wave 1 high
If price holds above 38 dollars after retest, a much larger rally becomes possible as institutional accumulation typically unfolds above the breakout zone.
Conclusion
Zeta Global presents a rare combination of improving fundamentals and a potentially completed corrective structure on the chart. Dilution remains a notable risk, but the valuation gap and strong earnings trajectory create an attractive reward to risk scenario.
I am monitoring the 13 to 15 dollar zone for long entries with targets at 22.5 and 38 dollars.
Google Is In Strong Bullish Trend; Unfolding A Five-Wave ImpulseAlphabet (Google) is a huge tech company best known for its search engine, but it also makes things like Android, YouTube, Gmail, and cloud services. Google is pushing hard into AI and cloud computing. They’re rebuilding search with AI, making stronger chips, and growing Google Cloud fast. They’re also investing in long-term tech like self-driving cars and quantum computing.
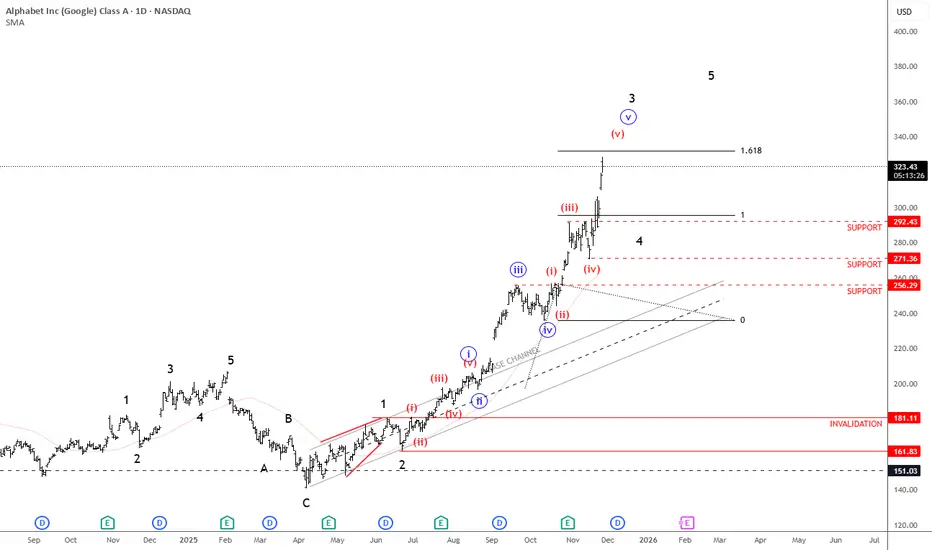
Google is in a very strong uptrend as expected, but we can now count five waves up within the black wave three cycle from around 160. Ideally, the next pullback would be wave four, stabilizing near the previous fourth-wave area around 292–271. And once or if we see that kind of correction, that's when new buying opportunities could appear, but for now, it’s better to stay cautious since we may already be in the later stages of this cycle.
Highlights:
Trend: Strong uptrend, but nearing late stages of wave three
Potential: Pullback in wave four before continuation higher
Support: 292–271 zone
Invalidation: Below 200
Note: watch for a correction before new long setups
FRSH - Long US MarketFRSH
Back at historic support of approx 10.50-11.50.
Breaking trend line with bullish harmonic patterns behind it and back testing support level.
Class A MACD bullish divergence on weekly, indicating potential strong reversal
Exit 25% of position at each TP level.
Weekly trade so could be slow going, but historically this moves fast.
Have previously traded this stock from this level with good results.

$SPCE long? Massive move incoming?NYSE:SPCE is starting to look really interesting here. It's been in a downtrend for years but the chart is starting to shape up.
If price can break up above $4.43, then I think it's likely that we could see a strong move to one of the resistance levels above.
We've already had multiple tests of resistance weakening it, and bc the consolidation has been so long, I think a breakout could lead to a massive move.
Will likely take a stab at this trade with both spot and options if we can see a retest of one of the lower support levels.

HBM Swing tradeReasoning:
Strong Industry/Sector
50MA Pullback
Long-Term Investors (3-12 Month Holds)
Entry: Full position on breakout
Profit Taking: Sell 1/4 to 1/5 at Goal 1
Exit Signal: Close below 20-day EMA (your trend guide) or 50EMA
Why: Strong moves are hard to time at the top, but the 20EMA acts as a reliable trend filter
Note:
Remember: Every long-term investment alert can also be played as a swing trade.

AG - Silver trade SwingReasoning:
Strong Industry/Sector
50MA Pullback
Long-Term Investors (3-12 Month Holds)
Entry: Full position on breakout
Profit Taking: Sell 1/4 to 1/5 at Goal 1
Exit Signal: Close below 20-day EMA (your trend guide) or 50EMA
Why: Strong moves are hard to time at the top, but the 20EMA acts as a reliable trend filter
Note:
Remember: Every long-term investment alert can also be played as a swing trade.

KGC SwingReasoning:
Strong Industry/Sector
50MA Pullback
Long-Term Investors (3-12 Month Holds)
Entry: Full position on breakout
Profit Taking: Sell 1/4 to 1/5 at Goal 1
Exit Signal: Close below 20-day EMA (your trend guide) or 50EMA
Why: Strong moves are hard to time at the top, but the 20EMA acts as a reliable trend filter
Note:
Remember: Every long-term investment alert can also be played as a swing trade.

SSRM SwingReasoning:
Strong Industry/Sector
50MA Pullback
Long-Term Investors (3-12 Month Holds)
Entry: Full position on breakout
Profit Taking: Sell 1/4 to 1/5 at Goal 1
Exit Signal: Close below 20-day EMA (your trend guide) or 50EMA
Why: Strong moves are hard to time at the top, but the 20EMA acts as a reliable trend filter
Note:
Remember: Every long-term investment alert can also be played as a swing trade.

HMY SwingReasoning:
Strong Industry/Sector
50MA Pullback
Long-Term Investors (3-12 Month Holds)
Entry: Full position on breakout
Profit Taking: Sell 1/4 to 1/5 at Goal 1
Exit Signal: Close below 20-day EMA (your trend guide) or 50EMA
Why: Strong moves are hard to time at the top, but the 20EMA acts as a reliable trend filter
Note:
Remember: Every long-term investment alert can also be played as a swing trade.

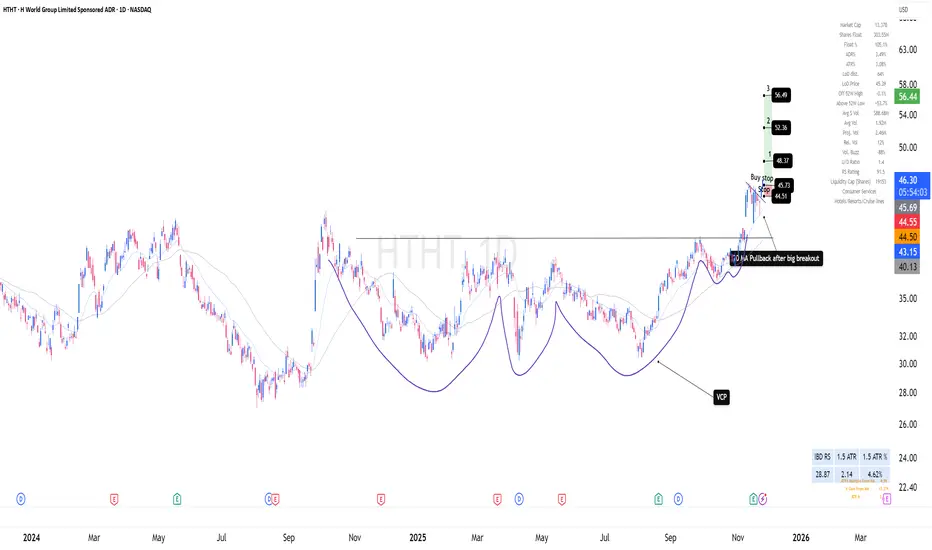
HTHT SwingReasoning:
Strong Industry/Sector
Strong stock in weak market
Long-Term Investors (3-12 Month Holds)
Entry: Full position on breakout
Profit Taking: Sell 1/4 to 1/5 at Goal 1
Exit Signal: Close below 20-day EMA (your trend guide) or 50EMA
Why: Strong moves are hard to time at the top, but the 20EMA acts as a reliable trend filter
Note:
Remember: Every long-term investment alert can also be played as a swing trade.
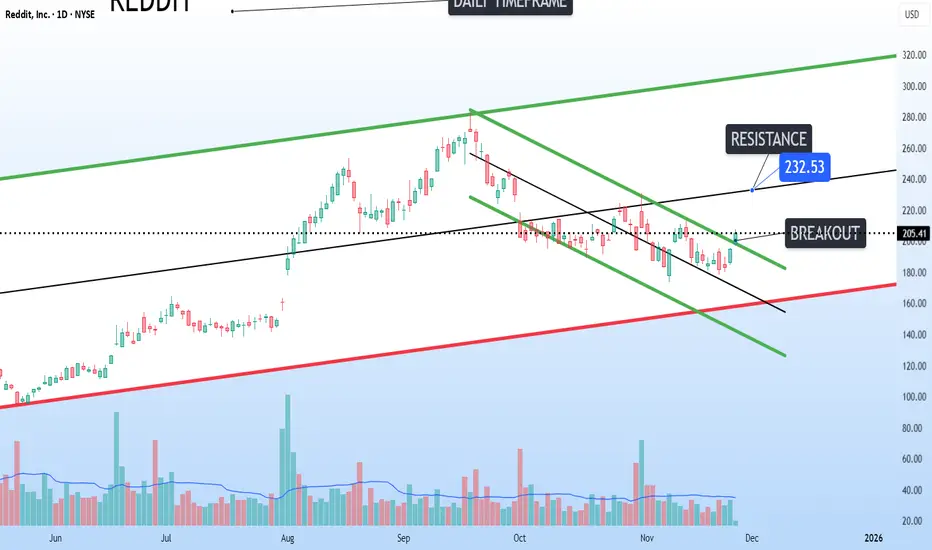
Breakout of local descending channelReddit NYSE:RDDT : The breakout from the local descending channel targets $232 before resistance, which is the mid-range of the ascending channel.
ONDS SwingReasoning:
Strong Industry/Sector
50MA Pullback w b/o on volume
Long-Term Investors (3-12 Month Holds)
Entry: Full position on breakout
Profit Taking: Sell 1/4 to 1/5 at Goal 1
Exit Signal: Close below 20-day EMA (your trend guide) or 50EMA
Why: Strong moves are hard to time at the top, but the 20EMA acts as a reliable trend filter
Note:
Remember: Every long-term investment alert can also be played as a swing trade.

COMM LongReasoning:
Strong Industry/Sector
Flat base breakout on volume
Long-Term Investors (3-12 Month Holds)
Entry: Full position on breakout
Profit Taking: Sell 1/4 to 1/5 at Goal 1
Exit Signal: Close below 20-day EMA (your trend guide) or 50EMA
Why: Strong moves are hard to time at the top, but the 20EMA acts as a reliable trend filter
Note:
Remember: Every long-term investment alert can also be played as a swing trade.

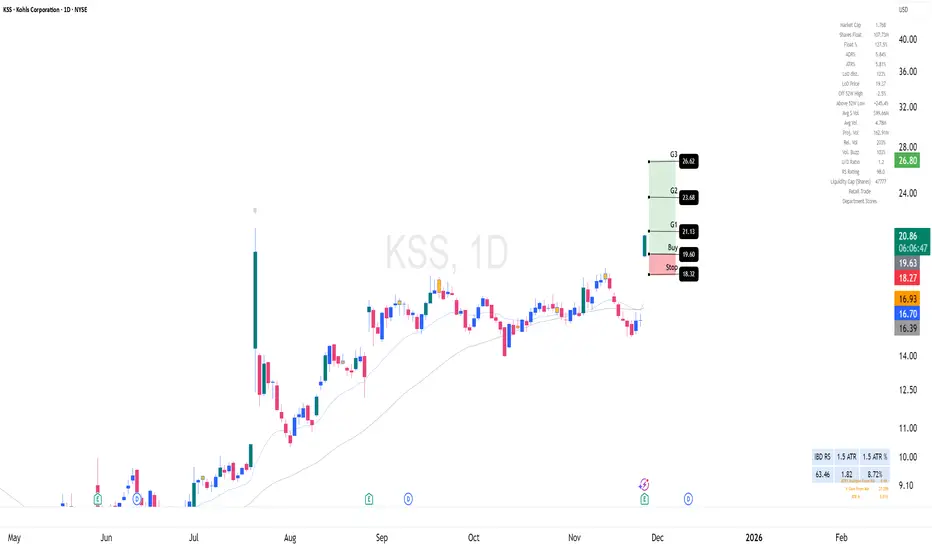
KSS EarningsLate post
Reasoning:
Strong Industry/Sector
Earnings trade
Long-Term Investors (3-12 Month Holds)
Entry: Full position on breakout
Profit Taking: Sell 1/4 to 1/5 at Goal 1
Exit Signal: Close below 20-day EMA (your trend guide) or 50EMA
Why: Strong moves are hard to time at the top, but the 20EMA acts as a reliable trend filter
Note:
Remember: Every long-term investment alert can also be played as a swing trade.
META Stock Tip LongHere is our stock signal for NASDAQ:META
Meta Stock Signal
🎉Entry: 597.13
⚠️SL: 482.50
✔️TP1: 732.42
✔️TP2: 911.95
✔️TP3: 1134.37
Don't forget, if you are on a challenge/funded you can trade main stocks
Hope all of our friends in USA have a good holiday
Best
ETAforex

SYM EarningsReasoning:
Strong Industry/Sector
Earnings Gap Up
Long-Term Investors (3-12 Month Holds)
Entry: Full position on breakout
Profit Taking: Sell 1/4 to 1/5 at Goal 1
Exit Signal: Close below 20-day EMA (your trend guide) or 50EMA
Why: Strong moves are hard to time at the top, but the 20EMA acts as a reliable trend filter
Note:
Remember: Every long-term investment alert can also be played as a swing trade.

11/25/25 - $NVDA - Norms gonna norm11/25/25 :: VROCKSTAR :: NASDAQ:NVDA
Norms gonna norm
- there are basically two things that you can own in this world
- AI and L1s (BTC and ETH)
- in AI landia, there's the king
- you own the kings
- "yuh but V google's making chips". yes. so does AMD... AVGO... MRVL...
- fade the norms. 25x PE for NVDA, laughably easy at this pt.
- higher.
V

Too Late to Buy Meta stock?META just reached the monthly demand imbalance at $592 and is reacting as expected using pure supply and demand price action. In this video, I show how META’s big drop was predictable from the monthly and weekly imbalances, and how the current reaction was part of the plan all along. Expecting a decent rally.

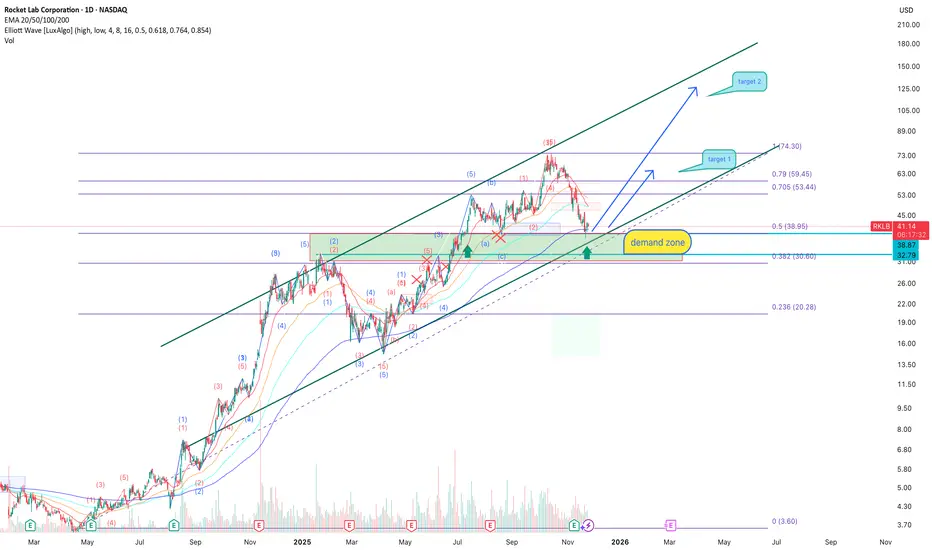
RKLB: demand zone may launch the next rallyRocket Lab remains one of the strongest long-term stories in the small-launch sector. The company continues expanding production capacity, scaling its launch cadence, securing new government contracts, and increasing recurring revenue from satellite services. The global demand for small-satellite deployment is growing faster than supply, and RKLB is steadily becoming the second major player after SpaceX in the commercial-launch and orbital-services niche. Additional growth in spacecraft manufacturing and analytics strengthens the company’s strategic positioning. From a long-term fundamental perspective, the recent price decline looks more like a technical correction inside a broader bullish cycle, rather than a structural reversal. For mid- and long-term investors, this area historically acts as a key accumulation zone -especially when fundamentals align with major technical supports.
Technically, price has held a major demand zone between 38–33 USD - the same zone that previously generated strong upward impulses. The correction stopped right at the 0.5 Fibonacci retracement (38.95), and buyers are showing absorption on lower timeframes. Price remains inside the broader ascending channel, while EMA 20/50 are stabilizing above the demand level, suggesting momentum may soon shift upward again. A clean entry setup forms once the market breaks and confirms the 0.705/0.79 Fibonacci cluster, opening the road toward the first target at 59.45 and then the extended target at 74.30. The bullish scenario remains valid as long as price stays within the demand zone and above the long-term trendline.
Fundamentally, the engine is already running -now all the chart needs is technical ignition to send RKLB back into the upper band of the long-term channel.
PYPL LongLooking for a move back to the local range highs. With a higher low put in, and a flag breakout on the 1H, it looks good to move from here.