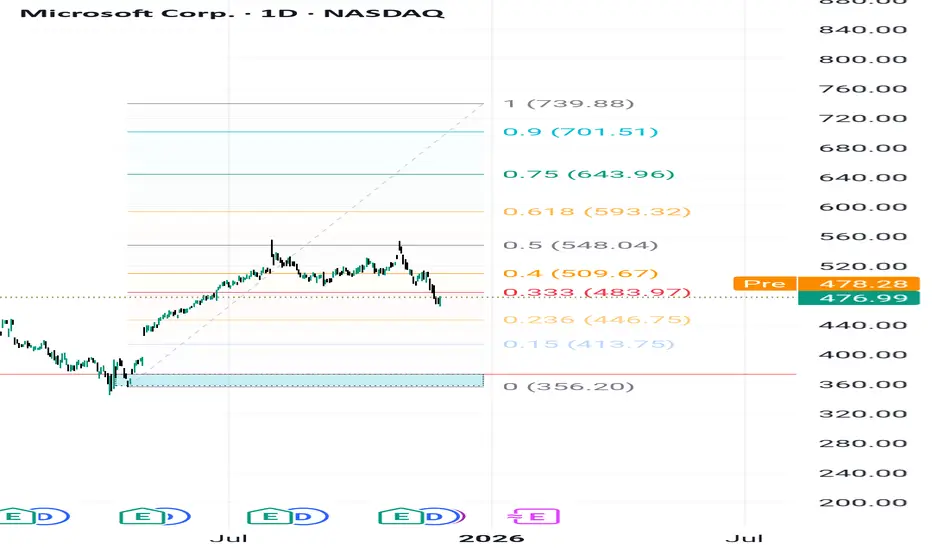
MSFT — Bullish Structure Intact Above 373.22, Targeting 739.88.Microsoft remains in a well-defined long-term bullish structure despite the current pullback from the 0.40–0.50 Fibonacci resistance cluster. The recent decline appears corrective in nature and does not signal any structural weakness as long as the stock preserves its main support foundation.
Key Support (Primary Structural Level): 373.22
The level at 373.22 represents the most critical demand zone on the chart.
It marks:
The origin of the previous bullish impulse,
A zone of strong institutional accumulation,
The base that
continues to anchor the long-term trend.
As long as price stays above 373.22, the broader upward cycle remains intact.
Fibonacci Expansion Targets (Long-Term Investor Levels)
The current impulsive leg projects the following upside targets:
483.97 (0.333)
509.67 (0.40)
548.04 (0.50)
593.32 (0.618)
643.96 (0.75)
701.51 (0.90)
739.88 (1.00 — primary long-term extension)
These levels correspond to strategic zones where institutional models anticipate consolidation or profit-taking.
Market Structure & Investor Outlook
The long-term trend remains strongly bullish.
The current pullback is normal retracement behavior.
Secondary demand pockets sit at 446.75 and 413.75 if the pullback deepens.
Macro structure remains fully intact above 373.22.
Bullish Continuation Scenario (Base Case)
If MSFT holds above 483.97 and regains momentum, the price can progress through:
509 → 548 → 593 → 643 → 701 → 739.88
This represents the natural continuation path of the current expansion.
Bearish Scenario (Limited & Non-Structural)
The only valid bearish scenario for now is a return to retest the key support at 373.22.
This move would represent:
A technical retest,
A liquidity sweep,
A refresh of institutional demand, not a trend reversal
As long as price holds 373.22, the long-term bullish structure remains unchanged.
Conclusion
Microsoft continues to demonstrate strong long-term structural integrity.
The only bearish possibility is a corrective move back toward the 373.22 support, after which the broader trend is expected to resume toward the long-term targets: 509, 548, 593, 643, 701, and 739.88.
NFLX Is Falling Into a Critical Zone — Rebound or Breakdown?Netflix is trading inside a descending channel, and the price has just touched the lower boundary, which is typically a zone of strong reaction—either a bullish reversal or a continuation breakdown.
The current price is around $104–105.
Bullish Scenario
If the lower channel holds and bullish candles form, a rebound toward the upper channel is likely.
Bullish Targets:
• Target 1: $112 (50-day SMA)
• Target 2: $118
• Target 3: $125 (top of the channel)
Bearish Scenario
If the price loses the $103–104 support, the downtrend may accelerate.
Bearish Targets:
• Target 1: $98
• Target 2: $92
• Target 3: $79 (major long-term support)
Stop Loss
• For long positions: Below $103
• For short positions: Above $112

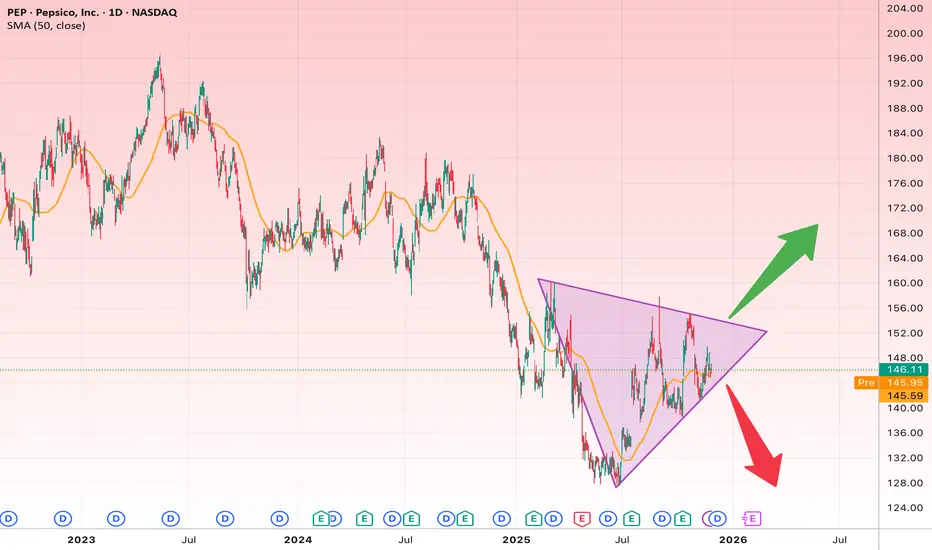
PEP Is Coiling for a Big Move: Breakout or Breakdown?The PEP daily chart is forming a symmetrical triangle, a classic consolidation pattern that often leads to a strong breakout. Price has been bouncing between the upper and lower trendlines and is now positioned around the middle of the structure.
Bullish Scenario
If the price breaks above the upper trendline around $150–$152, a bullish continuation is likely.
Bullish Targets:
• Target 1: $160
• Target 2: $168
• Target 3: Up to $175 if momentum is strong
Bearish Scenario
Breaking below the lower triangle boundary (~$142) could trigger a deeper decline.
Bearish Targets:
• Target 1: $136
• Target 2: $130
Stop Loss
• For long positions: Below $142
• For short positions: Above $152
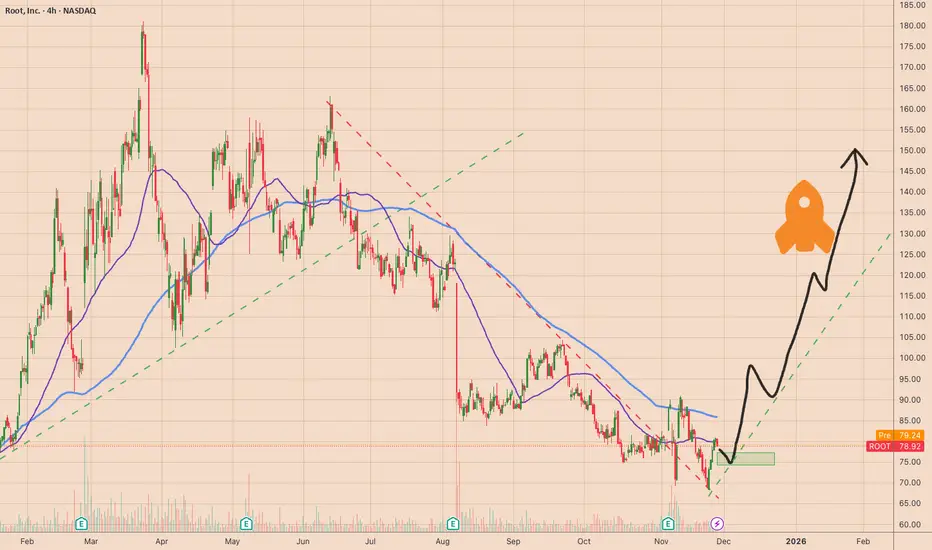
ROOT AI powered Insurance company BREAKOUT!2025 has seen explosive gains in companies building AI infrastructure — data centers, chips, and networking. But the next wave of opportunity may lie in the industries that unlock real productivity and profit improvements from adopting AI.
Insurance is a prime example. Historically, insurers have been heavily dependent on large workforces and legacy processes. Now, advanced analytics and automation are creating a path toward lighter, more efficient operating models. The companies embracing this shift early stand to benefit the most.
One standout is Root Insurance ( NASDAQ:ROOT ) — a tech-driven auto insurer leveraging AI and telematics to improve pricing accuracy, underwriting results, and customer conversion. Root has only missed earnings once since its first full year post-IPO in 2021, and operational execution continues to improve quarter after quarter.
The growth potential is significant. Technically, ROOT has recently broken out of its multi-month pullback, which may signal the beginning of its next upward move. However, for risk-managed positioning, it may be prudent to wait for a modest retracement to secure a better entry level.
😎👍
Micron Technology . Buyer exhaustion, $110 next? - November 2025When euphoria hits RSI over 80, the hangover's never far behind.
You've got to hand it to Micron, it's been on an absolute tear. Three months of green candles, 300% return in six months, RSI through the roof, price action outside the Bollinger Band.. if this isn't "buyer exhaustion", it's the closest thing to it since crypto traders discovered leverage.
The technicals
Let's start with the what's actually on the chart:
Three week hanging man candle, the kind that makes experienced traders reach for the Asprin. (Remember that 3 week candle on Bitcoin no one wanted to believe at $117k, yeah well..)
Bearish divergence, price making higher highs and RSI saying "Nah, I'm done."
The Fibonacci 1.618 extension and price action rendezvous at a popular meeting place where emotions say "This time is different", not different, just an expensive reality check.
Bull flag forecast now met and then some, textbook.
Price action outside the Bollinger Band. Translation: Buyers have officially left the chat.
RSI at historical overbought levels. Last time we saw this, the party ended with a 50% drawdown and a lot of denial.
When every indicator starts shouting the same thing, it's not a conspiracy... it's confirmation.
Narrative versus reality
Of course, the narrative machine is in full swing:
"Micron's at the forefront of AI memory expansion!"
"Semiconductors are the new oil!"
"Buy the dip, buy the rip, buy everything!"
Sure. But look left. Every time Micron's RSI toughed these levels, 2018, 2021, 2024, the same thing happened. Price ripped, buyers got greedy, and then the chart did what charts always do, reverted to the mean, which is currently $110
Structure check
Notice where price is now? Extended beyond both the flag channel and the upper Bollinger Band. The bull flag's measured move has been met and exceeded, and what comes next isn't rocket science: Momentum fades, structure breaks, price retraces to support.
Nearest major support? Around $145-150, followed by the broader $120 region, which also aligns nicely with prior structure and the 0.382 Fibonacci level. That's your sanity zone where value buyers return, and over leveraged bulls pretend they always planned to "scale in lower".
Context matters
Micron isn't a bad company. It's a good company doing too well, too fast, in a market that's gone a bit mad for anything with "AI" in the press release. But markets don't trend on virtue, they trend on emotion. And this emotion looks a lot like euphoria. Euphoria is fun. Until it isn't.
Conclusions
Micron’s had its sprint. The bull flag target’s hit. Momentum’s wheezing. RSI’s screaming. And the candle pattern’s spelling it out: buyer exhaustion.
Could it push higher short-term? Sure. That’s what blow-off tops do, they taunt you. But probability now favours consolidation or a correction. If you’re holding long, tighten stops. If you’re flat, wait for the retrace. If you’re still buying here, well, good luck. You’re basically buying confetti at a wedding after the cake’s been eaten.
Ww
Disclaimer
==========================================================
This isn’t financial advice. Obviously. If you’re basing your trades on the sarcastic ramblings of a bloke who names chart patterns after furniture, that’s your problem. If it goes up, you’ll take credit. If it goes down, you’ll blame the Fed. Either way, I’ll still be here sipping tea, because that's what we British do, watching the RSI fall back to 50 and muttering “told you so.”
Without Worries (Ww)

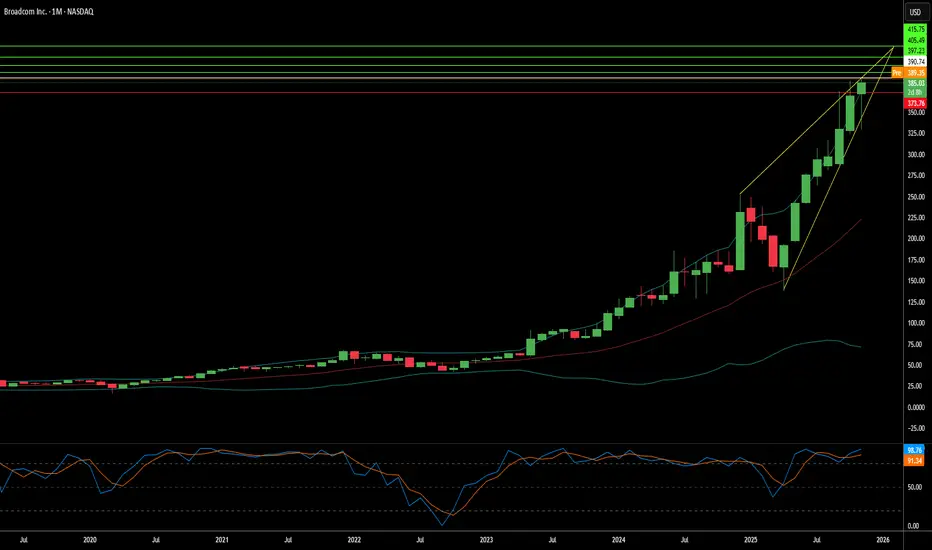
Is Silicon's Silent Giant Rewriting the Rules of AI?Broadcom has emerged as a critical, yet understated, architect of the artificial intelligence revolution. While consumer-facing AI applications dominate headlines, Broadcom operates in the infrastructure layer, designing custom chips, controlling networking technology, and managing enterprise cloud platforms. The company maintains a 75% market share in custom AI accelerators, partnering exclusively with Google on their Tensor Processing Units (TPUs) and recently securing a major deal with OpenAI. This positioning as the "arms dealer" of AI has propelled Broadcom to a $1.78 trillion valuation, making it one of the world's most valuable semiconductor companies.
The company's strategy rests on three pillars: custom silicon dominance through its XPU platform, private cloud control via the VMware acquisition, and aggressive financial engineering. Broadcom's technical expertise in critical areas like SerDes technology and advanced chip packaging creates formidable barriers to competition. Their Ironwood TPU v7, designed for Google, delivers exceptional performance through innovations in liquid cooling, massive HBM3e memory capacity, and high-speed optical interconnects that allow thousands of chips to function as a unified system. This vertical integration from silicon design to enterprise software creates a diversified revenue model resistant to market volatility.
However, Broadcom faces significant risks. The company's dependence on Taiwan Semiconductor Manufacturing Company (TSMC) for production creates geopolitical vulnerability, particularly given rising tensions in the Taiwan Strait. U.S.-China trade restrictions have compressed certain markets, though sanctions have also consolidated demand among compliant vendors. Additionally, Broadcom carries over $70 billion in debt from the VMware acquisition, requiring aggressive deleveraging despite strong cash flows. The company's controversial shift to subscription-based pricing for VMware, while financially successful, has generated customer friction.
Looking ahead, Broadcom appears well-positioned for the continued AI infrastructure buildout through 2030. The shift toward inference workloads and "agentic" AI systems favors application-specific integrated circuits (ASICs) over general-purpose GPUs Broadcom's core strength. The company's patent portfolio provides both offensive licensing revenue and defensive protection for partners. Under CEO Hock Tan's disciplined leadership, Broadcom has demonstrated ruthless operational efficiency, focusing exclusively on the highest-value enterprise customers while divesting non-core assets. As AI deployment accelerates and enterprises embrace private cloud architectures, Broadcom's unique position spanning custom silicon, networking infrastructure, and virtualization software establishes it as an essential, if largely invisible, enabler of the AI era.
Dianthus — Precision Complement Medicine for gMG & CIDPCompany Overview
Dianthus Therapeutics NASDAQ:DNTH is a clinical-stage biotech developing next-generation monoclonal antibodies that modulate the complement system for severe autoimmune and neuromuscular diseases. Lead asset DNTH103 uses convenient subcutaneous dosing every two weeks, aiming to disrupt the gMG and CIDP markets projected to exceed $10B by 2030.
Key Catalysts
Phase 2 Momentum in gMG: The MaGic trial showed meaningful symptom improvement, supporting advancement toward Phase 3 and reinforcing a best-in-class profile.
CIDP Expansion: Planning a potentially registrational CIDP trial, extending the neuromuscular franchise and adding a second, sizable indication.
Platform Validation: Positive data backs DNTH’s precision immunology approach; q2w SC dosing directly addresses patients’ convenience and adherence needs.
Diversified Pipeline: Additional programs in rare inflammatory disorders create a multi-catalyst path through 2026, broadening the complement footprint.
Why It Matters
✅ High-value indications with unmet needs
✅ Differentiated dosing + mechanism
✅ Clear clinical path with near/medium-term readouts
Investment Outlook
Bullish above: $35.00–$36.00
Target: $80.00–$82.00 — driven by Phase 3 readiness in gMG, CIDP registrational potential, and complement-medicine leadership.

NVO - Potential Bottom FormingCurrently in a solid long position on NVO, micro count suggests a bottom has formed as well as a completed correctional. I would expect price to consolidate/back and forth due to multiple points of resistance in the area. But a swift breakout afterwards.
This is all very preliminary and speculative at the moment.
Stop-loss: 43.06
Take-Profit: $60+
Wave-Count Confidence: Below Average - Unusual structure

Qualcomm in 2025: From Smartphone Champion to Global AI PlatformThe company is out to prove it is worth far more than just iPhone modems.
1. Where does $ NASDAQ:QCOM stand today? Qualcomm remains a central piece of the semiconductor industry, even if it rarely makes the front page of general financial papers. Traditionally associated with modems and smartphone processors, the company is undergoing an accelerated transformation phase: it wants to stop being seen merely as a "mobile chip supplier" and start being valued as a horizontal platform for low-power computing and artificial intelligence across all devices—from cars to PCs, industrial equipment to data centers.
Financially, 2025 marks a year of consolidation for this shift. In the fiscal year ending in September, Qualcomm reported:
Revenue (Non-GAAP): $44.1 billion (+13% vs. 2024)
Pre-tax results: Up 16%
Adjusted EPS: Up 18%
The chip division (QCT) still accounts for the bulk of the business at $38.4 billion (+16% YoY), while the patent licensing business (QTL) remains stable around $5.6 billion, but with extremely high margins.
Crucially, the company remains a cash-generating machine: in 2025, Free Cash Flow reached ~$12.8 billion , with $12.6 billion returned to shareholders via buybacks and dividends—equivalent to nearly 100% of FCF.
2. A Portfolio More Diversified Than It Appears Behind the aggregate numbers, the core of Qualcomm’s "current situation" lies in the shifting revenue mix.
Smartphones still weigh in… but less so Smartphones still represent the largest slice of QCT—about $27.8 billion in 2025, a 12% growth in a relatively stagnant global market. Even with diversification, it is reasonable to assume that about two-thirds of revenue remains directly or indirectly linked to the mobile ecosystem. Qualcomm maintains a dominant position in high-end Android smartphones, with the Snapdragon 8 Family (now Elite Gen 5) setting the standard for performance and "on-device" AI capabilities.
Automotive: From "Optional" to Strategic Pillar The automotive segment is now a major growth engine. Revenue reached nearly $4.0 billion in 2025 (+36% YoY). The last quarter surpassed $1 billion for the first time. Pipeline: The company boasts a "design-win pipeline" of roughly $45 billion , supported by the Snapdragon Digital Chassis. Partnerships like the one with BMW illustrate the ambition to move up the value chain. The official goal is to reach $8 billion in annual automotive revenue by 2029.
IoT, XR, and Industrial: The "Invisible Network" The IoT business is already worth $6.6 billion (+22% in 2025). $ NASDAQ:QCOM targets $14 billion by 2029, anchored by demand for connectivity and Edge AI. PCs goal: $4 billion XR (Extended Reality) goal: $2 billion Industrial goal: $4 billion
3. AI PCs: A Strong Bet on Snapdragon X & X2 One of the most visible pillars of the current strategy is the aggressive entry into AI PCs via the Snapdragon X family.
During 2025, Qualcomm reinforced the message that "Windows on ARM" is finally a commercial reality. By early 2025, the company indicated it had over 60 Copilot+ PC models in production. At the recent Snapdragon Summit, Qualcomm unveiled the Snapdragon X2 Elite , promising significant performance-per-watt gains.
However, challenges remain: Linux PC manufacturer TUXEDO recently cancelled a Snapdragon X Elite project due to compatibility issues, highlighting that success is currently strongly anchored to the $ NASDAQ:MSFT Windows ecosystem.
4. First Serious Step into Data Center AI Until now, Qualcomm's AI narrative was mostly "Edge AI." In October 2025, the company made a clear move toward the data center, announcing two server AI chips launching in 2026.
These accelerators aim to compete in a segment dominated by $ NASDAQ:NVDA by focusing on efficiency and lower costs. The market welcomed the announcement (stock rose ~20% that day), valuing the optionality of this new business.
5. The $ NASDAQ:AAPL Relationship & Smartphone Dependency Any analysis of Qualcomm must address Apple. The 5G modem deal was extended for iPhones launching through 2026. However, Qualcomm projects only ~20% share of modem chipsets for the 2026 launch. Apple introduced the iPhone 16E in 2025 with its first internal 5G modem (C1).
Risk: Medium-term erosion of Apple revenue. Mitigation: "Non-Apple" QCT revenue is growing at double digits (~18% in 2025).
6. Regulatory, Litigation & Geopolitical Risks EU: Fine of ~€238.7M confirmed in 2024. China: Antitrust investigation opened in Oct 2025 regarding the Autotalks acquisition. Arm Dispute: Litigation with $ NASDAQ:ARM regarding IP licensing continues.
7. How to Look at Qualcomm Today (Investor View) This is not financial advice.
The Bull Case Diversified Edge AI Platform (Auto, PCs, IoT). Visibility in Auto ($45B pipeline). Strong Free Cash Flow and capital return discipline. Optionality in Data Center AI.
The Bear Case Dependency on the smartphone cycle remains high. Gradual exit of $ NASDAQ:AAPL revenue. Execution risk in PCs and Data Centers against competition like $ NASDAQ:NVDA , $ NASDAQ:AMD , and $$INTC. Regulatory risks.
Conclusion In 2025, Qualcomm stands at an interesting crossroads. The growth in Auto, IoT, and AI PCs shows that diversification is gaining traction. The central question for the coming years is whether the "smartphone discount" that historically weighed on its valuation will be replaced by an "AI platform premium."
This text is strictly informative and does not constitute a personalized investment recommendation or financial decision-making advice.

Health Rally: Trump’s Obamacare Subsidies Save the Sector
By Ion Jauregui – Analyst at ActivTrades
Health insurance stocks in the United States started the week with strong gains. Centene (NYSE: CNC) and Molina Healthcare (NYSE: MOH) surged following rumors that the Trump administration plans to extend Affordable Care Act (Obamacare) subsidies for two years, a move the markets interpret as relief for 2026.
According to Politico, the White House could officially announce the plan this Monday. The proposal would include new eligibility conditions and mechanisms to prevent a sharp increase in premiums, one of the main risks for the sector. Elevance Health (NYSE: ELV) also rose more than 2%, reflecting widespread optimism among insurers.
Why it matters
The fundamental impact is clear. Without subsidies, insurers faced:
A drop in enrollments, especially among lower-income customers.
Aggressive premium increases, affecting income stability.
Greater operational uncertainty for 2025–2026.
James Harlow of Novare Capital called the news a “better-than-feared scenario,” as it reduces the possibility of a collapse in enrollments and protects sector margins.
Technical Analysis
Centene (Ticker AT: CNC.US):
After a volatile year, Centene lost highs around $71.04 following the bearish gap on July 1, falling to an annual low of $25.08 in August. Since then, the stock has initiated a gradual recovery, supported by a solid support at $33.
Moving average crosses, which previously showed a marked bearish trend, partially corrected in October, with the 50-day moving average crossing above the 100-day, indicating the beginning of a short-term recovery. The Point of Control (POC) is around $28, reflecting a key reference level for accumulation and support.
Currently, the RSI is at 63, showing a slight overbought bias, while the MACD is lateralized with a histogram in indecision, indicating consolidation.
If the trend continues and the price surpasses the 200-day moving average (approx. $44), we could see a recovery toward the previous gap zone and recent highs. If it fails, the stock could retreat back to $33.
Molina Healthcare (Ticker AT: MOH.US):
MOH corrected its range after losing support at $359.97, reaching a recent low of $133.40. It currently seems to be initiating a rebound toward the POC at $148.27, acting as the first key control level.
If the bearish pressure breaks, the stock could recover toward $190, with a possible test of resistance at $204.20. Otherwise, the price is likely to remain sideways until a new pattern is defined.
After falling 68.53% from its all-time high of $423.92 in less than two years, MOH has yet to establish a clear floor. The RSI shows a recovery move to 44.20%, reflecting a gradual sentiment shift, while the MACD indicates a resumption of the bullish trend, though it remains in negative territory, suggesting caution until sustained momentum is confirmed.
Beyond the insurers
Hospitals also benefit. Stability in subsidies reduces the likelihood of uninsured patients, protecting revenues and easing pressure on emergency and primary care.
Overall, the extension of subsidies reinforces the sector’s predictability, offering a financial breather just as political and regulatory uncertainty threatened to shake the markets.
*******************************************************************************************
The information provided does not constitute investment research. The material has not been prepared in accordance with the legal requirements designed to promote the independence of investment research and such should be considered a marketing communication.
All information has been prepared by ActivTrades ("AT"). The information does not contain a record of AT's prices, or an offer of or solicitation for a transaction in any financial instrument. No representation or warranty is given as to the accuracy or completeness of this information.
Any material provided does not have regard to the specific investment objective and financial situation of any person who may receive it. Past performance and forecasting are not a synonym of a reliable indicator of future performance. AT provides an execution-only service. Consequently, any person acting on the information provided does so at their own risk. Political risk is unpredictable. Central bank actions can vary. Platform tools do not guarantee success.

AMD Shares Fall Despite Strong NewsAMD Shares Fall Despite Strong News
It emerged this week that the US government, together with Advanced Micro Devices (AMD), has launched the “Mission Genesis” initiative aimed at boosting national computing power through advanced supercomputing. The project is expected not only to significantly expand federal computational capacity but also to increase AMD’s revenue.
Nevertheless, AMD was among yesterday’s weakest performers. Market sentiment has been dampened by concerns over intensifying competition from Google. According to media reports:
→ Google’s TPU (Tensor Processing Unit) chips show strong potential for AI training.
→ Meta Platforms is already in talks to invest billions in Google’s chips for use in its data centres from 2027.
A decline of around 20% in AMD’s share price since the start of the month is worrying, yet the chart analysis offers some encouragement for the bulls.
Technical Analysis of AMD Shares
Price action suggests that since April, AMD has been trading within a broad upward channel (shown in blue). Within this structure:
→ the price set an all-time high at the end of October, where the upper boundary acted as resistance;
→ between 7 and 17 November, the median line held as support before eventually giving way;
→ today, AMD is testing the lower boundary of the channel, which may act as support.
Additional factors that could reinforce this lower-channel support include:
→ the psychological $200 level;
→ a wide bullish gap, with its upper boundary near $205.
Taking these elements into account, it is reasonable to assume that conditions may be favourable for the bulls to attempt to revive the broader 2025 uptrend.
This article represents the opinion of the Companies operating under the FXOpen brand only. It is not to be construed as an offer, solicitation, or recommendation with respect to products and services provided by the Companies operating under the FXOpen brand, nor is it to be considered financial advice.

AAPL soon to be $285Double top pattern formation. Target area is 285-286 region.
DONT FORGET STOP LOSS
More info in video

Is the Age of the Human Warehouse Over?Symbotic is no longer just a vendor; it is becoming the operating system of the industrial economy. The robotics leader saw its shares surge nearly 40% Tuesday following a fiscal fourth-quarter report that shattered expectations. With revenue hitting $618 million and system deployments doubling, Wall Street is finally waking up to a new reality. Symbotic’s entry into the $93 billion healthcare logistics market signals a structural shift. The company is transitioning from a retail solution to a critical infrastructure provider, insulating the supply chain from human volatility.
Geopolitics & Geostrategy: The Automation of Sovereignty
Symbotic’s rise is a direct play on "supply chain sovereignty." As global trade routes fracture, nations are aggressively prioritizing domestic logistics resilience. Symbotic’s technology allows the U.S. economy to maintain high-velocity distribution without relying on a fragile, shrinking labor pool. By automating the "middle mile," the company reduces exposure to demographic decline and migration policy shifts. Logistics capacity is no longer just a business metric; it is now a national security asset.
Industry Trends: The Healthcare Alpha
The partnership with Medline Industries marks a pivotal diversification moment. Healthcare logistics demands a level of precision with zero tolerance for error that general retail does not. Winning a contract with a medical supply giant validates Symbotic’s AI as "clinical grade." This move aligns with the broader "Intelligent Supply Chain" trend of 2025. Resilience and redundancy now outweigh pure just-in-time efficiency. Symbotic is positioning itself as the backbone for mission-critical distribution.
Technology & Science: Density as a Deflationary Force
Symbotic’s "Next-Generation" storage architecture is a feat of spatial physics. By reducing warehouse footprints by nearly 40%, the technology acts as a deflationary force against rising industrial real estate costs.
High-Tech Engineering: The system uses proprietary mobile bots that operate independently of specific racking, a radical departure from legacy automation.
Physics of Density: The proprietary design maximizes cubic density, allowing companies to store more inventory in smaller, cheaper spaces close to urban centers.
Macroeconomics & Economics: The Inflation Hedge
The macroeconomic thesis for Symbotic is the spread between the cost of capital and the cost of labor. Even with interest rates elevated, the long-term cost of human labor is rising faster than the cost of robot depreciation. Symbotic’s systems provide a hedge against wage inflation, offering a fixed-cost structure in an inflationary world. This creates a predictable operational expenditure model that CFOs crave in volatile economic climates.
Business Models: The "GreenBox" Evolution
Symbotic is evolving its business model from pure hardware sales to "Warehouse-as-a-Service." The company is democratizing automation, allowing diverse sectors to access enterprise-grade logistics without massive upfront complexity. This recurring revenue model creates a stickier, more predictable cash flow profile. It commands a higher valuation multiple from investors who now view the company as a software platform rather than a hardware manufacturer.
Management & Leadership: The Owner-Operator Edge
CEO Rick Cohen leads with a "three-comma" operator mindset. As the third-generation leader of C&S Wholesale Grocers, Cohen built Symbotic to solve his own problems, not just to sell a product. This "owner-operator" culture permeates the company. Their disciplined refusal to chase growth at the expense of functionality sets them apart. His focus on "monitoring speculative trading" reflects a management team focused on long-term industrial value rather than quarterly stock jukes.
Cyber & Patent Analysis: The Digital Moat
With a massive portfolio of issued and pending patents, Symbotic has built a formidable legal moat around its "structure-independent" bot technology.
Intellectual Property: The patent wall prevents competitors from easily replicating their high-density architecture.
Cyber-Physical Security: As logistics centers become digital nodes, they become targets. Symbotic’s centralized AI "brain" offers a consolidated defense point, crucial for protecting the physical flow of goods from cyber threats.
Conclusion: The Industrial Prime
Symbotic has proven it can scale beyond its largest retail patrons. The Medline deal is the "proof of concept" the market demanded. Investors are no longer buying a grocery logistics company; they are buying the premier industrial automation platform of the decade. The stock’s surge is a delayed recognition of a simple truth: in a world of labor scarcity, the robot is not a luxury; it is a necessity.

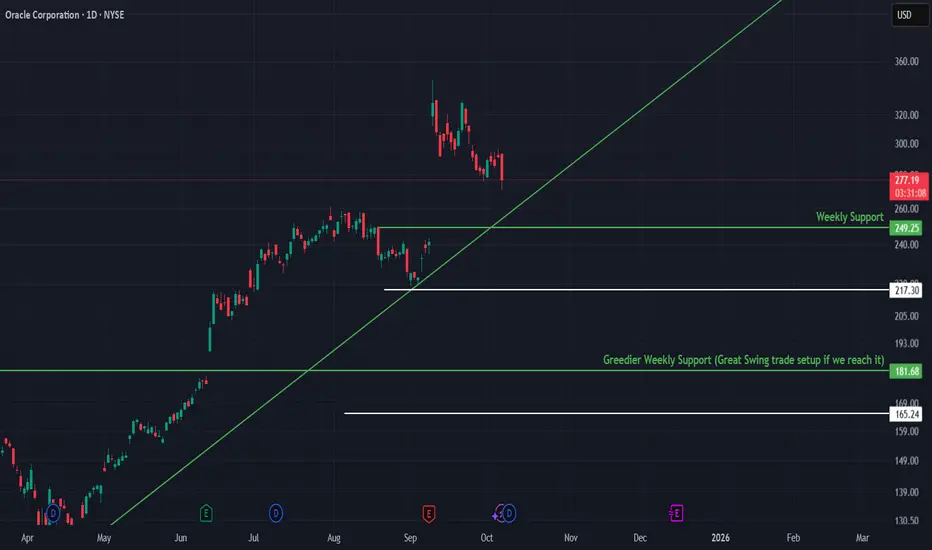
Oracle Corporation (ORCL) – Technical & Fundamental OutlookAfter a strong multi-month rally, Oracle (ORCL) recently broke below its short-term trendline, signaling a cool-off in momentum 📉 after months of steady gains.
Currently, price is holding around $275, with the next key weekly support near $249, which could offer a technical rebound opportunity if buyers step in.
The $181–$185 “greedier” support zone remains on the chart its a great swing position but high risk of not reaching it since reaching it requires a deeper tech correction.
📊 Technical Levels
Weekly Support: $249
Deeper Support (High-Risk Of not reaching it): $181–$185
🧠 Fundamental Insight
Oracle continues to strengthen its AI-driven and cloud-focused ecosystem ☁️, transitioning from traditional database services to high-growth enterprise cloud infrastructure.
Cloud services revenue continues to grow at double-digit rates, led by OCI.
Strong free cash flow supports steady dividends and ongoing share buybacks.
Expanding partnerships in AI, ERP, and autonomous data management place Oracle in a favorable position against major competitors like Microsoft and AWS.
These strong fundamentals maintain a long-term bullish bias, even amid short-term volatility.
✨ If you find this analysis useful, please don’t forget to like 👍 and follow for more technical & fundamental updates.
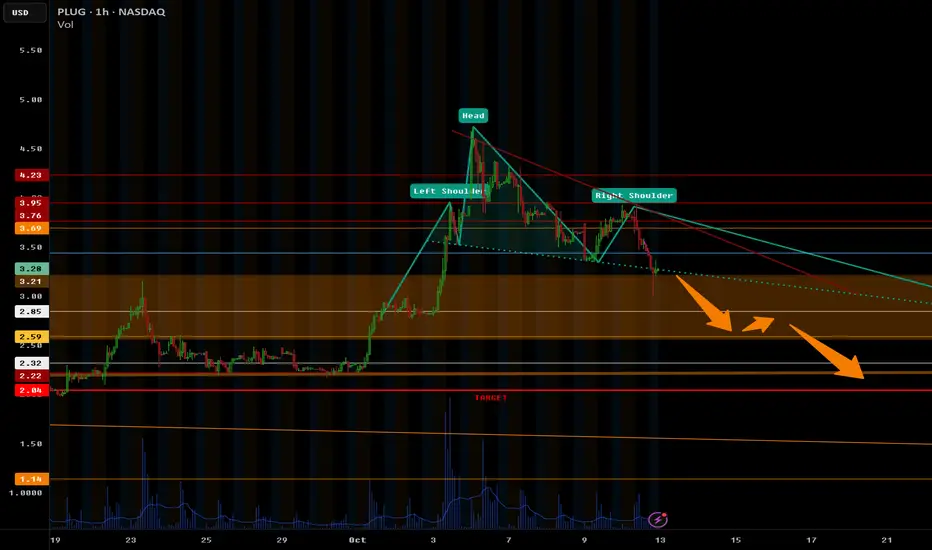
PLUG short.I'm looking for a PLUG Short on monday open. I see a head and shoulders pattern. I think it has a good possibility of opening high of course, but all my trades are just possibilities rather than setups. I'm ready to change my mind at any point.
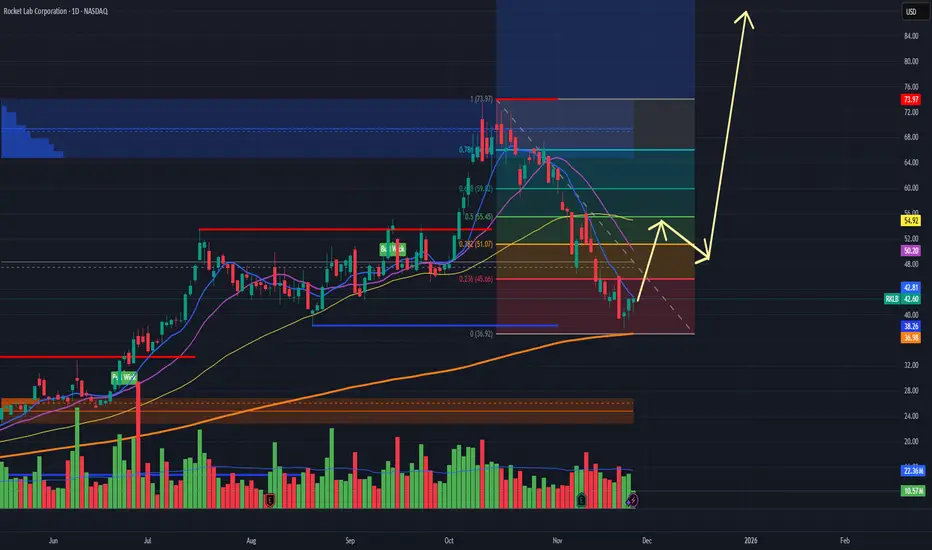
Rocket Lab to 80$Rocket Lab
NASDAQ:RKLB is showing a high-probability setup for a major run, supported by a bullish technical structure and strong underlying fundamentals.
Technical Perspective
The daily chart reveals Rocket Lab has bounced off its recent lows near $36.90 on 200SMA, forming a potential bottom with climbing volume. Fibonacci retracement levels show key resistance around $51 and $54, and a breakout above these puts the $73 and $83 zones firmly in play. Price action is now holding above the rising 200-day moving average—often viewed as a strong support line—and the yellow arrows forecast a classic “ABC” recovery pattern targeting prior highs and new expansion zones.
Momentum and volume profiles back this thesis: the last few green bars suggest accumulation is underway, and the blue buy zone near $42.60 offers a defined risk entry. Such setups feature optimal reward/risk ratios for swing and position traders.
Fundamentals
Rocket Lab recently posted $155 million Q3 revenue, up 48% year-over-year, with improving gross margins and projections for record turnover next quarter. The company sports a healthy contract pipeline (including government/hypersonic deals), rapid satellite deployment, and consistent launch cadence—all signs of operational momentum.
Analysts now see upside targets between $55 and $83, driven by both revenue acceleration and vertical integration. Most importantly, Rocket Lab continues to narrow EBITDA losses, proof that its path to profitability is intact.
Why a Double Is Plausible
Technical setup favors a rally back toward the $80 level if supply at $54 is absorbed.
Growth rates far exceed sector averages; additional launches and government contracts can fuel a re-rating.
Accumulation on the chart supports a near-term reversal and multi-month breakout.
With momentum building and fundamentals supporting a much higher valuation, Rocket Lab is positioned to potentially double from current levels within the next rally cycle.
Ascending TDSeq startedIREN did a 12 in TD Sequential, reaching the lower side of the pitchfork displayed.
Now the TP can be around 84-100$ looking at the fib extension levels of the latest swing.

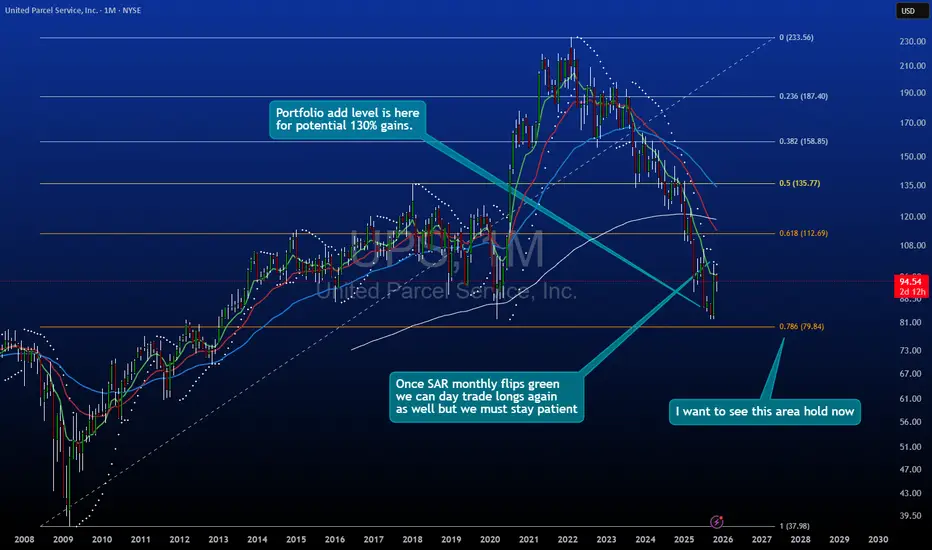
United Parcel Service - Long-Term Pullback AnalysisUPS has retraced approximately 65% from its 2022 highs, presenting a potential accumulation zone based on historical price structure and key retracement levels.
Technical Observations:
Price Structure:
Current price: $94.54
Trading near the 0.618 retracement level ($112.69) from the 2020 low to 2022 high
Approaching the 0.786 retracement zone ($79.84), which historically acted as strong support
Key Levels:
Monthly support zone: $78.60 area
Long-term trend line from 2008 lows remains intact
Price action showing signs of stabilization after extended decline
Risk Considerations:
Entry zone: Current levels to $79 area
Invalidation: Break below $70 would negate bullish thesis
Timeframe: Long-term position (12-24+ months)
Potential Upside Targets:
Based on historical swing analysis and fibonacci projections:
First resistance: $135-140 zone (0.5 retracement)
Second target: $158-165 zone (0.382 retracement)
Full recovery: $187-200+ zone (previous highs)
Fundamental Context:
UPS benefits from structural trends in e-commerce and logistics. Current valuation appears compressed relative to historical norms, though macroeconomic headwinds remain a factor.
Position Sizing:
Given the long-term nature and inherent volatility, this would be considered a tier 1 allocation in a diversified portfolio with appropriate risk management.
This is not financial advice. All investments carry risk. Past price action does not guarantee future results. Conduct your own due diligence before making investment decisions.
Nvidia plummeted amid the threat of competition from GOOGL
Optimism surrounding the Gemini 3 and news that Alphabet (GOOGL) will internally supply its TPUs to Meta Platforms (META) supported the AI rally. On the other hand, Nvidia (NVDA) experienced a significant decline due to concerns over the potential GOOGL threat.
Mizuho noted that the "Google wins, OpenAI/Nvidia loses" trade is gaining traction, accelerating the sell-off in OpenAI-related stocks like NVDA and Oracle (ORCL).
Meanwhile, the US administration's decision regarding the allowance of NVDA's H200 chip sales to China remains a potential positive catalyst for future NVDA stock prices.
NVDA briefly fell below the support at 173.00 after breaking below the ascending trendline. Diverging bearish EMAs indicate a potential extension of the downtrend.
If NVDA breaks below 173.00 again, the price could further decline to the next support at 164.50.
Conversely, if NVDA closes above 182.50, the price may advance toward the following resistance at 190.00.

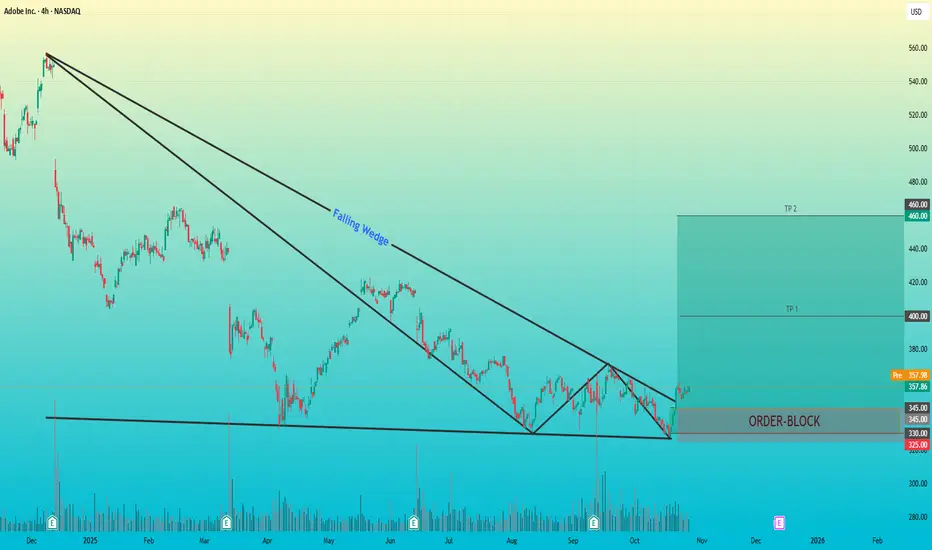
Adobe Inc.(ADBE) – Falling Wedge Breakout + Bullish Order BlockAdobe Inc. (ADBE) – Falling Wedge Breakout + Bullish Order Block
Timeframe: 4H
Pattern: Falling Wedge
Key Zone: Bullish Order Block (325 – 345 USD)
After an extended downtrend, Adobe formed a falling wedge pattern, signaling a potential bullish reversal.
Price recently broke the upper trendline with a clear Change of Character (ChoCH), confirming strength from buyers.
The order block around 325–345 USD acts as a strong demand zone where institutional buying interest is likely to be present.
A successful retest of this area could trigger a continuation move toward the next major resistance around 460 USD.
Trade Outlook
Entry Zone: 335 – 345 (Order Block Retest)
Target: TP 1-- $400
TP 2-- $460
Stop Loss: Below 325
Risk–Reward Ratio: 1 : 3, 5
Bias: Bullish
IREN charges up after the pullbackThe price of IREN pulled back to the lower boundary of the expanding channel and touched the 100 period moving average on the 8 hour chart. The 48 zone acted as support earlier and buyers are showing interest there again. A base is forming. A breakout above 62 can activate movement toward 76 and later 100 where the next expansion target sits.
IREN operates large scale data centers and high performance computing infrastructure including bitcoin mining and enterprise hosting. The key advantage of the company is access to low cost renewable energy which keeps hash rate costs low and allows stable scaling.
The fundamental picture on November 26 remains stable. The company continues to expand its data center capacity. Leverage stays low. The bitcoin network maintains strong activity which supports revenue. Hash rate competition increases but operators with cheap energy access like IREN gradually strengthen their market position.
As long as the price stays above the 48 zone and above the 100 period moving average the recovery structure remains valid. A confirmed move above 62 opens the path to 76 and then 100 . A move below 48 will return price to deeper consolidation.
Even miners need a pause to recharge but after such pullbacks energy normally returns very quickly.

Nasdaq Rallies into Thanksgiving, Meta Bounce Kicks InWall Street sentiment has perked up on renewed Fed cut bets, with the Nasdaq leading the way. This has allowed Facebook to finally rally from support levels I highlighted 3 weeks ago.
Matt Simpson, Market Analyst at City Index.

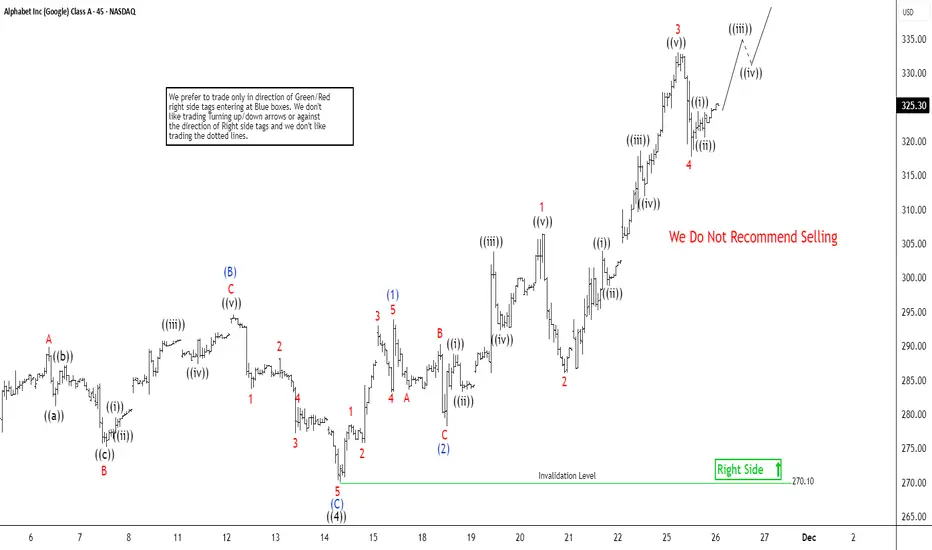
Google Stock (GOOGL) Approaches Historic Peak, $336 in SightThe short-term Elliott Wave view in Google (GOOGL) indicates that the stock is progressing within the final wave ((5)) of the impulsive rally that began from the April 2025 low. Wave ((4)) of this sequence concluded at $270.1, as reflected in the 45-minute chart. Following that completion, the stock resumed its advance toward new all-time highs, unfolding wave ((5)) as a five-wave impulse of lesser degree. From the termination of wave ((4)), wave (1) reached $293.95, while the corrective pullback in wave (2) settled at $278.2. The structure then nested higher into wave (3), reinforcing the bullish momentum.
From wave (2), wave 1 advanced to $306.42, followed by a modest dip in wave 2 that ended at $286.05. The third wave extended strongly, culminating at $332.98, before a corrective decline in wave 4 brought prices down to $317.65. The expectation now is for the stock to extend higher once more, completing wave 5 and thereby finalizing wave (3) of the larger degree. Afterward, a corrective phase in wave (4) should emerge, setting the stage for another rally in wave (5). This final advance would complete wave ((5)) and the broader cycle from the April 2025 low.
In the near term, as long as the pivotal support at $270.1 remains intact, dips are anticipated to find support within the typical three, seven, or eleven swing corrective structures. This suggests that the broader outlook continues to favor further upside, with each corrective phase offering opportunities for continuation of the bullish trend.