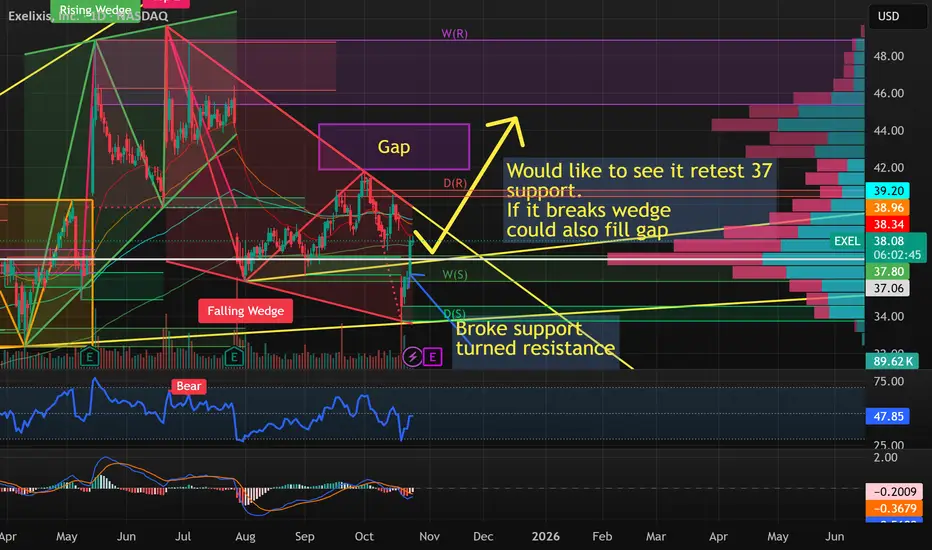
EXEL breakout incoming?EXEL's chart is interesting right now. It has been in a falling wedge since June.
It seemed to flip in July, but broke down again on Monday when it dropped as low as 33.8-ish
But it broke the resistance line fairly easily yesterday and it seems to be bullish once again.
The falling wedge seems like it could break on a decent earnings report - or even before then.
Ideally, I'd like to see it re-test the support that's at about 37. If it holds that level, or breaks the wedge, I'll start looking at options for a trade.
The other reason I like the potential of this trade is the volume gap that sits from about 41 to 44.
The downside to this trade? I'm not sure EXEL's value supports a jump. My 1 year targe on EXEL is about 44. So it's not exactly undervalued.
That said, I like the risk reward of this trade. Call options at the current price (38 strike) for the first available date after the earnings are about $2.25. I'm more likely to buy a call here than buy the stock outright to manage the earnings risk.
We'll see how this plays out over the next week and I'll update.
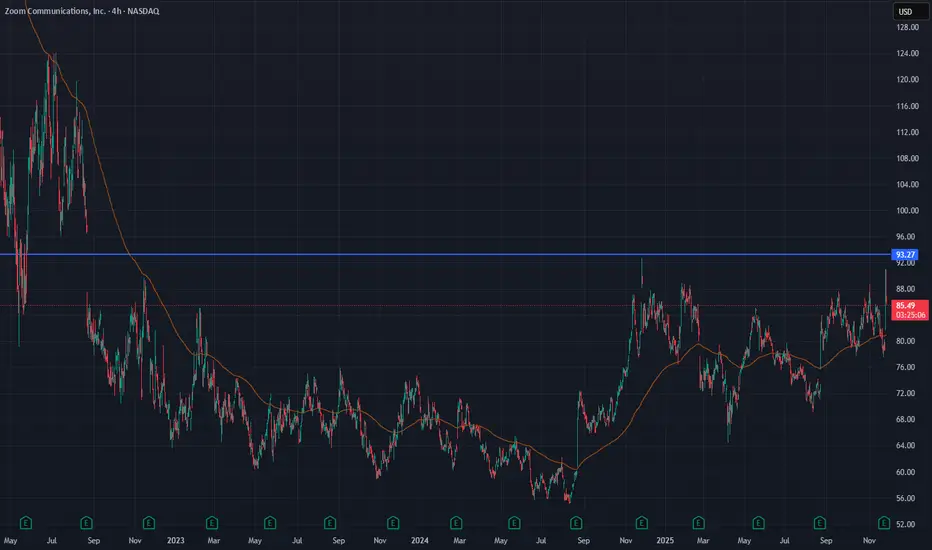
Short ZMNASDAQ:ZM
Zoom Video (ZM) was one of the major winners during the pandemic period. However, since August 2022 the stock has consistently failed to break above the $93 resistance, and it is increasingly unlikely to do so in a market where more alternatives now offer services similar to Zoom.
A solid Q3 earnings report pushed the price higher and brought it closer to that resistance zone, but the broader structure still suggests limited upside. In the coming weeks, the stock may retrace back toward the $73 area, or even revisit the $60 support zone, which has historically acted as a strong demand level.
This is not financial advice. Always conduct your own analysis and manage risk accordingly.
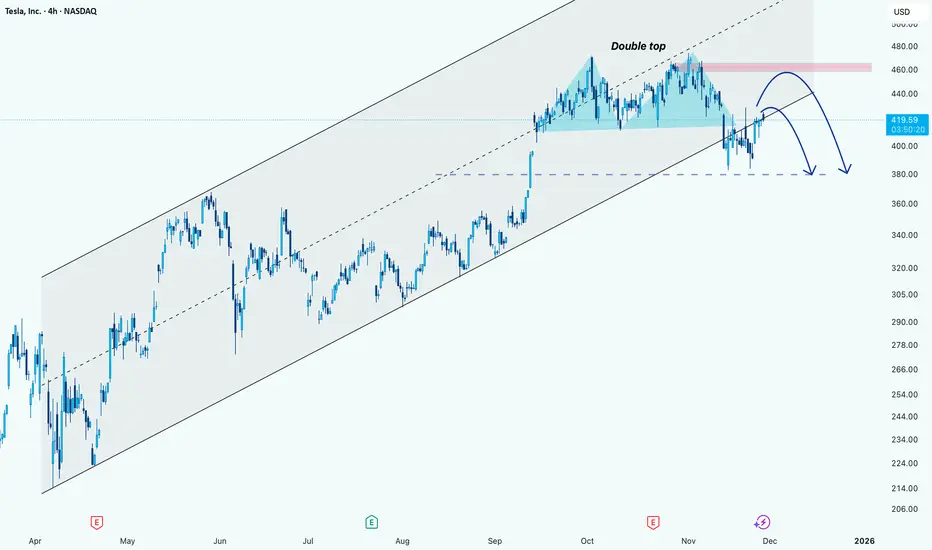
Tesla: A overview of itHi!
Trend Analysis:
TSLA has been trading in an ascending channel for several months, with higher highs and higher lows visible since April.
The recent price action broke above the midline of the channel but is currently consolidating near the $420-$425 area.
Pattern Formation:
A Double Top pattern near the $460 level formed.
This pattern signals a potential reversal if the price fails to break above the resistance zone (marked in pink).
The neckline of this double top appears around $400, which is also a key support zone.
Potential Price Action:
Short-term rebound:
TSLA could retest the resistance zone near $455-$460.
If it fails to break this area convincingly, the double top pattern could trigger a reversal.
Medium-term correction:
If the reversal occurs at the resistance zone, price may fall toward the neckline/support area near $380.
This aligns with the lower boundary of the channel and previous support levels.
SYM watch $80.xx: Golden zone could TOP or POP for a BIG MOVESYM got a nice surge off its last Earnings report.
It has spiked into a Dual Golden fibs at $79.98-80.34
Looking for a Break-n-Retest to launch next leg up.
.
Previous Plot that caught a PERFECT BOTTOM:
Hit BOOST and FOLLOW for more such PRECISE and TIMELY charts.
=========================================================

Nvidia likely to sell off throughout December 2025Nvidia has dominated 2025 with an exceptional upward trend, driven by relentless AI infrastructure demand. Recently, NVDA has finally broken below that steep up-channel — a signal that the stock may need a short-term cooldown before its next leg higher.
A retracement into the mid-$150 range would bring price back to a well-established support zone visible on the chart. This would represent a constructive pullback rather than a change in the long-term trend, especially heading into new product and AI-spending catalysts expected in early 2026.
For perspective: just three years ago, NASDAQ:NVDA was trading near $12 per share — a staggering +1,375% gain in only 36 months. Given that magnitude of appreciation, a modest pullback to $150 should be viewed as healthy consolidation rather than bearish pressure.

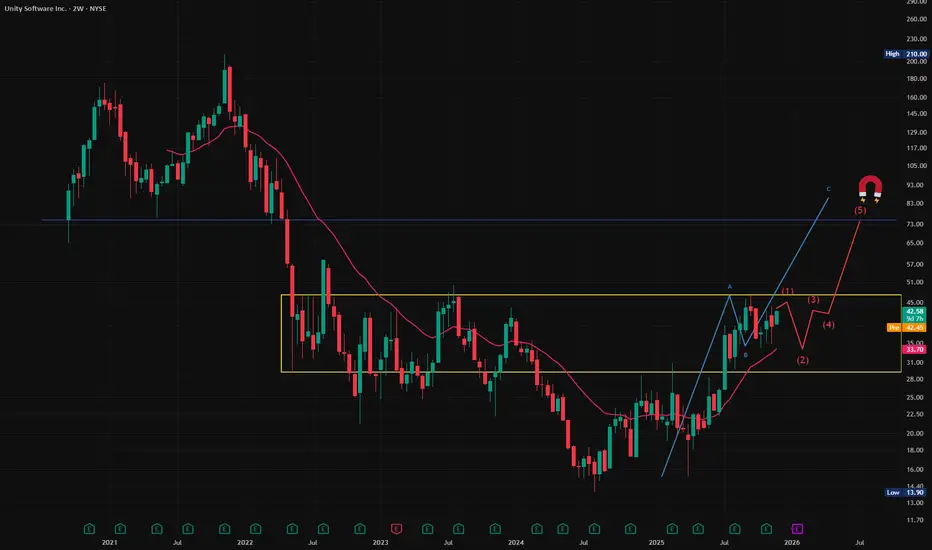
Unity Software $U looks set up to double into 2026.Not sure if we go straight up or first dip back into the low $30s, but I expect $70+ within the next 12 months.
Strong setup technically, and fundamentals are improving.
CSCOIs Cisco building using AI? The "ai bubble" that so many people think is not real and productivity and output will continue to increase with the implementation of AI.
New Highs incoming for CSCO, target levels plotted. Trends plotted by TrenVantage LITE

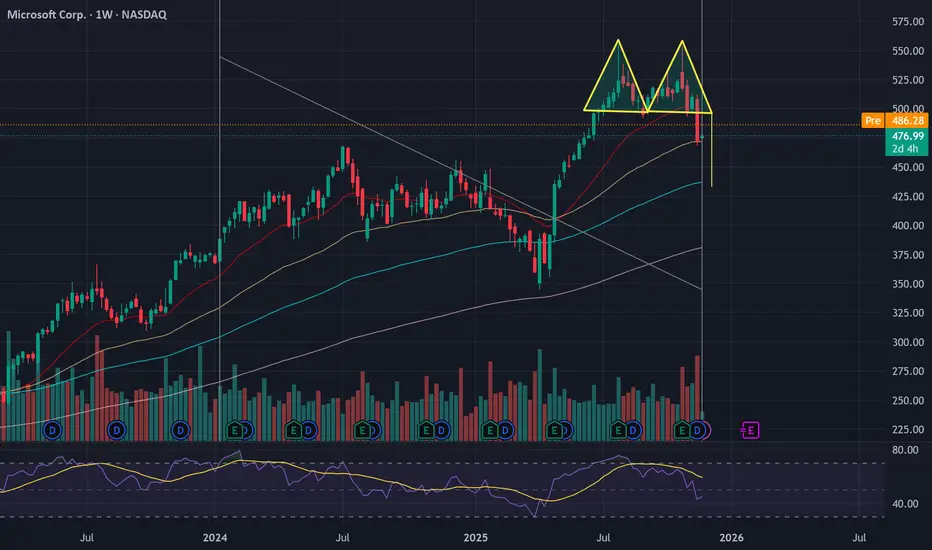
MSFT has a double top patternNASDAQ:MSFT chart looks to break the neckline of a double top pattern. If confirmed, you know where we are heading.
AEO watch $20.xx: Double Golden fib zone may give DIP to buyAEO took a serious dip and has now recovered.
Again testing Double Golden zone $20.04-20.86
Look for a Dip-to-Fib or Break-n-Retest to join longs.
.
Previous Idea that caught a PERFECT POP of >60% gain:
Hit BOOST and FOLLOW for more such PRECISE and TIMELY charts.
========================================================

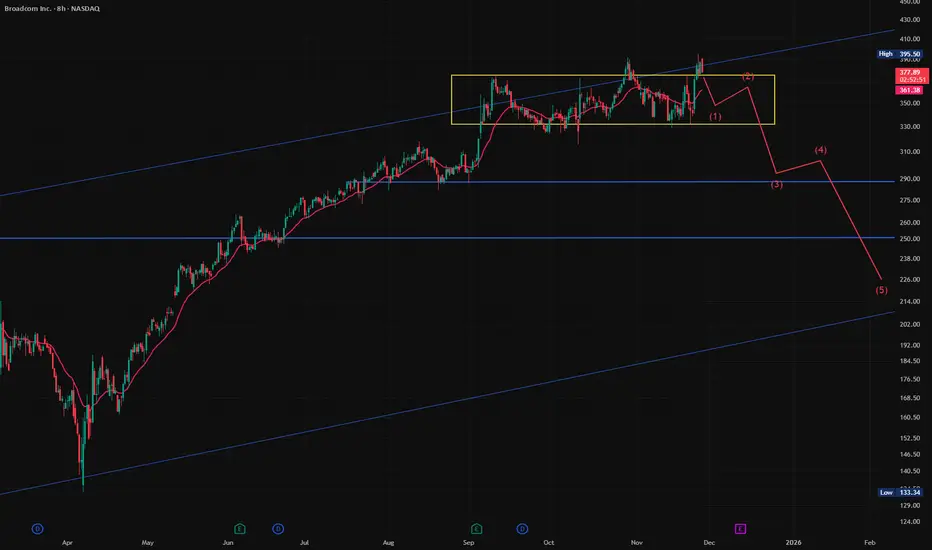
$AVGO a multi year channel overshoot is statistically bearishI have re-entered this NASDAQ:AVGO short. Odds are still 75% the yellow box will break to the downside eventually (a multi year channel line overshoot historically only has a 25% of succes)
This week is a seasonal Thanksgiving bullish week with strong news from Google, probably won't happen again next week.
HOOD Bearish Setup?HOOD on the daily chart has completed a clear bearish Market Structure Shift after its October peak. Price is now trading below the 20-day and 60-day moving averages (around 127.54 and 128.96), confirming short- to mid-term downside momentum, while resting on long-term support near the 120-day MA around 113.17. We’ve already seen price bounce off this zone, and with premarket now around 121, the earlier “bounce long” idea is effectively behind us.
From here, the primary plan is to fade strength into the former support turned resistance around 122.50. If price pushes into that zone and fails—confirmed by a bearish daily candle or a close back below 121.00—the short bias is favored. The first downside objective is a retest of the 110.00–113.00 area around the 120-day MA and recent lows. A clean break below 104.00 would open the door to a deeper move toward the psychological 100.00 level. Invalidation for the bearish view sits above 128.00, where a daily close would reclaim the 20- and 60-day MAs and negate the idea of simple rally-fades. This is a study, not financial advice. Manage risk and invalidations.
Thought of the Day 💡
Good trade ideas are built around “if–then” conditions, not predictions. Define the path, then wait for price to prove it.
--------------------------
Thanks for your support!
If you found this idea helpful or learned something new, drop a like 👍 and leave a comment, I’d love to hear your thoughts

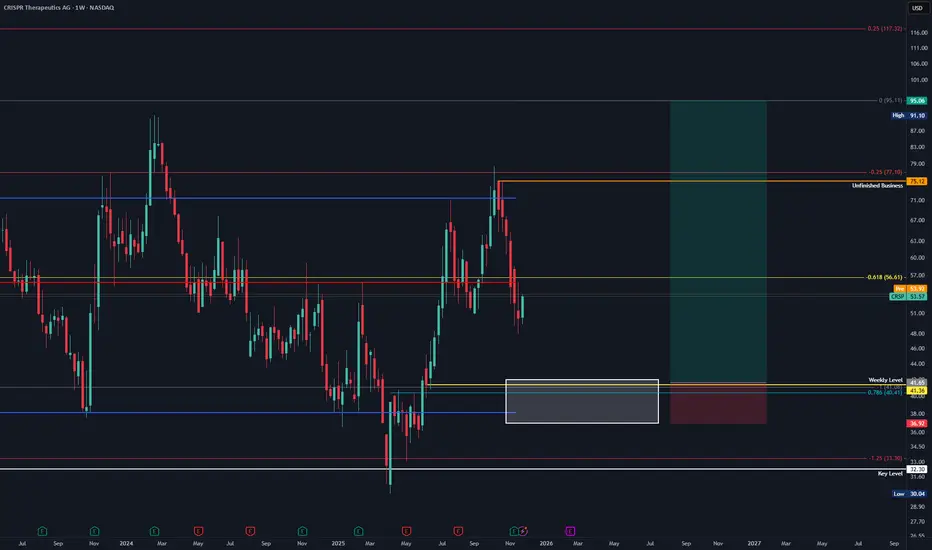
CRSP Swing LongIn the future should CRSP drop to 37-42 this would be a great area to look for swing long. With ATH Value Area Low sitting there in confluence with the negative 1. Weekly Level and 0.786 retracement.
BABA🌎Alibaba's AI Ambitions Gain Momentum: Qwen's Record-Breaking Launch and Strategic Investments
Alibaba is experiencing strong growth, fueled by the impressive success of its AI assistant, Qwen. Just a week after the public beta release, the app has surpassed 10 million downloads, marking the fastest launch of any such tool in history.
This success signals the company's decisive entry into the consumer AI market and strengthens its position as a direct competitor to ChatGPT and other global leaders in generative AI.
Why Qwen is More Than Just a Chatbot
The company positions Qwen as an "intelligent gateway to everyday life."
Unlike many Western subscription-based models, Alibaba is emphasizing a freemium model and deep integration of AI into its ecosystem. Plans include implementing "agent-based AI" features to automate tasks such as food ordering, travel booking, and shopping on platforms like Taobao.
The app is currently available in China, but an international version is expected soon.
Sizable Investments and Financial Results
To support its ambitions, Alibaba is mobilizing significant resources. The previously announced AI investment plan of RMB 380 billion (~$53 billion) over three years demonstrates a scale comparable to that of American IT giants.
These investments are already bearing fruit:
Revenue Growth: In Q1 FY26, revenue from the Cloud Intelligence division grew 26% year-on-year to RMB 33.4 billion, largely driven by strong demand for AI computing power and cloud services.
Explosive Growth in AI Products: Revenue from AI-based products has shown triple-digit growth for the eighth consecutive quarter, demonstrating the active adoption of technology by enterprises in China.
Increasing the profitability of the cloud business, which is under pressure from the high cost of building AI infrastructure, remains a key challenge.
Technological Innovation in the Face of Restrictions
In response to US export restrictions, Alibaba is finding creative ways to improve efficiency. Aegaeon's recently introduced GPU pooling system dramatically reduces dependence on Nvidia chips. During beta testing, this technology reduced the number of GPUs required by 82%—from 1,192 to 213—to support dozens of AI models.
This achievement highlights the company's ability to mitigate the impact of sanctions through software optimization.
Alibaba is one of the few global platforms offering a full stack of AI services. Strategic investments in promising areas such as international expansion and partnerships (for example, upcoming XPeng robotaxis trials using Amap maps in 2026) provide the foundation for long-term growth.
On the downside, the current stock valuation is already overly optimistic, and sustaining accelerated growth requires continued high investment and impeccable strategy execution.
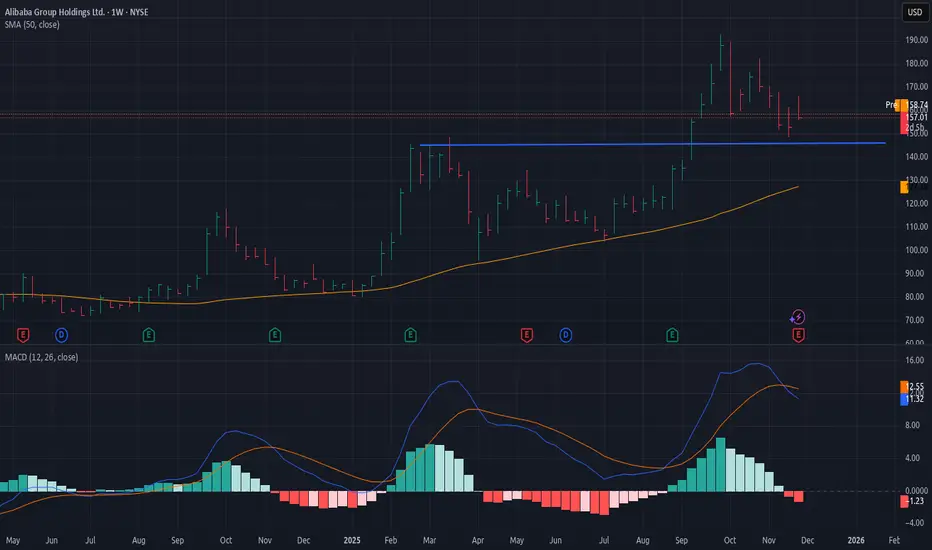
In our view, we are in Wave 4, where after a strong momentum, the stock needs a breather to continue its growth.
In general, we don't see the stock being distributed. Many factors point to a correction to future growth.

BIDU long-term TABaidu has a good and strong uptrend on weekly time frame, but it has entered the distribution on mid-term, watch for the support levels around $105-110 price range to hold, it has a good potential to continue its uptrend through the next year.

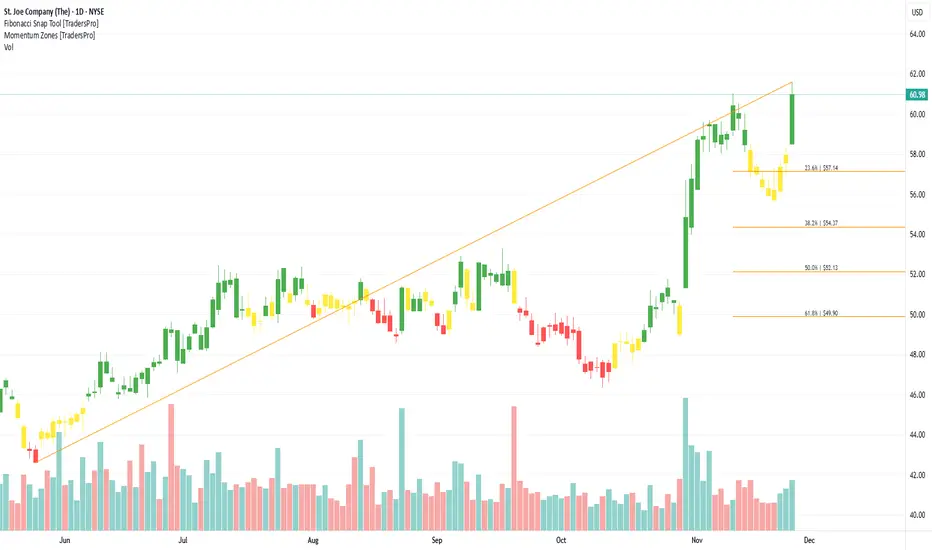
The St. Joe Company (JOE) Builds Coastal Communities In FloridaThe St. Joe Company (JOE) is a Florida-based real estate and development company focused on master-planned communities, resorts, and commercial projects along the Gulf Coast. It owns and develops large land holdings in Northwest Florida, building homes, hotels, apartments, and mixed-use spaces that cater to tourism, retirees, and businesses moving into the region’s growing coastal markets. Its growth is driven by population inflows to Florida, rising travel demand, and long-term land value appreciation.
On the chart, JOE just printed a confirmation bar with increasing volume as price pushed above the 0.236 Fibonacci level, moving into the momentum zone where buyers are in control. From here, a common trade plan is to anchor a trailing stop just under that 0.236 Fib using the Fibonacci snap tool, so the trend can keep working while your downside stays clearly defined.
BABA long-term TAOk Alibaba, it's in a good and strong uptrend on weekly time frame and it has a potential to continue its growth even the next year. Yes it has recently released its AI app, but don't be too excited yet, don't pay too much attention to the news, BABA is currently in distribution on mid-term which has started about a week ago, and any pump is a danger. Watch for $146 level to hold the support, if it's broken it may dive all the way to $130ish area.
Sundial Growers - A Stoners Paradise - An Investors DreamOnce again gang.
The charts always tell a story.....
and this right here has one that's dying to tell.
So let's all gather around the campfire and listen in...
for this will hit less like a fable and more like a Saga.
Where there is smoke... there can be fire.
Follow the flame.
Godbless.

FLNC - BullishFLNC – Volatility Expansion Thesis
The chart shows a multi-year range with two critical Volatility Expansion levels acting as the fulcrum of every major move. Price has repeatedly expanded away from these levels and then reverted back into them. They function as the midpoint of the entire structure.
1. Primary Setup
Price is attempting to reclaim the upper Volatility Expansion band near 17.40–17.76. Historically, every time price reclaimed this zone, it triggered a multi-month expansion leg to the upside (yellow arrow reference). When price failed this zone, the move unwound back into the lower expansion level at 14.83.
This is the same mechanic repeating now.
2. Why This Area Matters
This 17–18 zone is where prior expansions initiated and where prior failures collapsed. It is the single most important decision-making level on the chart. It represents:
• structural acceptance or rejection
• volume re-accumulation or distribution
• volatility compression or release
Holding above it converts the entire multi-year range into bullish continuation.
3. Current Structure
Price swept the lower expansion level at 14.83, held, and impulsively rotated back toward the upper expansion band. The current rejection wick only matters if price cannot reclaim 17.40–17.76. Reclaiming it confirms buyers stepping back into control and signals a new expansion cycle.
4. Expansion Target
The next untested zone is the large inefficiency at 36–38. This is the same grey box drawn on the chart. It is the only clean upside magnet left once price accepts above the expansion band. Liquidity is thin above 22, so the move accelerates quickly once the reclaim is secured.
5. Trigger
The trade is binary:
• Reclaim 17.40–17.76 → expansion toward 36–38.
• Fail the reclaim → mean reversion back toward 14.83.
Price is sitting right under the trigger and volatility is compressing, which usually leads to an expansion move.

SMCI long-term TASMCI is a biggie, it was slammed pretty heavily after the recent earnings report and as of this moment mid-term is in heavy distribution, which seems like it's close to bottom out, yet weekly time frame uptrend is not ready yet but there's a positive divergence in accumulation.
In general, SMCI has a perspective for growth but it's broken yet, it needs more time to bottom out.

AMD long-term TAWill AMD close this gap? Many traders should be asking this question now, well, technically speaking AMD is in a good uptrend on weekly time frame and it has a good run, but the countertrend correction has started, watch for the levels between $175-180 for a bounce. It needs more time to bottom out, for now let's keep an eye on it.

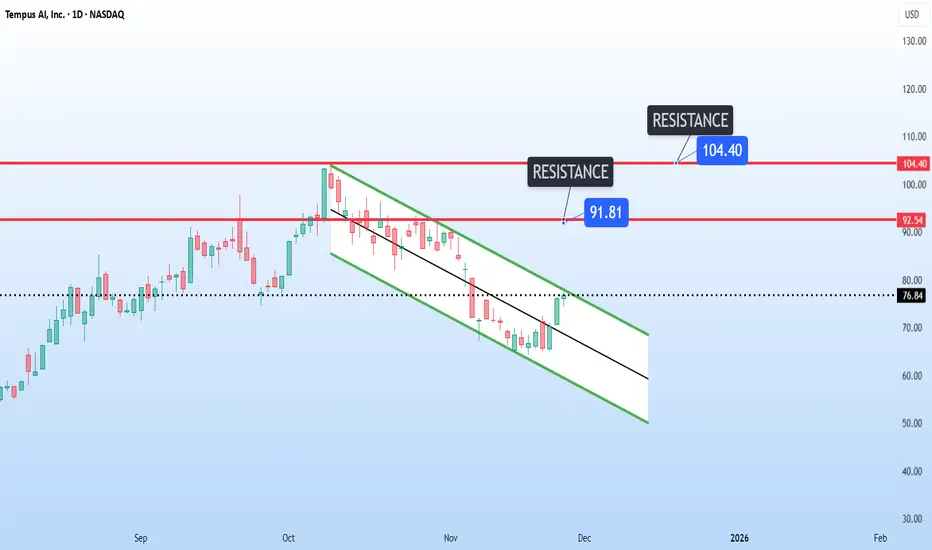
Tempus AI Potential Breakout of ChannelTempus AI NASDAQ:TEM is showing a text-book breakout setup on the daily chart.
It is hovering right at the top of the descending channel at 76, putting pressure on the trendline for a potential breakout.
The next key resistance levels could be at 91 and 104.
TSLA long-term TATesla stock is in uptrend on weekly time frame, but the distribution has started on mid-term, watch for $380 level to hold. If this level is broken it may go even lower to $360, let's keep an eye on it.

Shopify Breakout of ChannelShopify NASDAQ:SHOP is painting a breakout on the daily timeframe from the descending channel.
The next area of resistance is sitting right at the mid-channel trendline of the ascending channel.
Watch for the first test at around 165, clearing the path to the main target around 195 at the top of the channel.
