Deere & Company (NYSE: $DE) Stock: Q3 Drop After Earnings Deere & Company (NYSE: NYSE:DE ) traded sharply lower after releasing Q3 CY2025 results that showed strong revenue growth but weakening margins and softer forward guidance. The stock closed at $498.13 and dropped more than 5% after market open, falling to $478.78 pre-market. Management cut full-year earnings expectations, signaling continued pressure across agriculture and construction markets.
Revenue for Q3 reached $12.39 billion, beating estimates and rising 33.6% year over year. EPS of $3.93 also topped expectations but declined from $4.55 last year, highlighting ongoing cost pressures. Deere reduced its FY25 earnings outlook to $4.00–$4.75 billion, well below the market’s $5 billion expectation. Executives cited slow demand, elevated inventory levels, and weakness in large-equipment spending.
Long-term trends show deceleration. Revenue grew at 5.4% annually over the last five years, but the past two years saw declines of 14.4% annually. All segments—Production & Precision Agriculture, Construction & Forestry, and Small Agriculture & Turf—posted year-on-year revenue drops. Despite this, the latest quarter showed a recovery in activity, and analysts expect 14% revenue growth next year.
Margins remain a concern. Deere’s five-year average operating margin of 19.9% narrowed significantly. Q3 margin fell to 10.9%, down from 15.6% a year ago. Free-cash-flow margin also tightened sharply, falling from 47.4% to 14.3%. While buybacks helped EPS growth over the past decade, earnings have weakened for two consecutive years.
Management expects FY26 to mark the bottom of the agriculture cycle, projecting net income of $4.00–$4.75 billion. Markets reacted cautiously as guidance cut overshadowed the Q3 beat.
Technically, DE trades around $471 near an ascending trendline. Key support sits at $413, while major resistance remains at $533. A breakout above $533 would confirm recovery momentum.

AI expanded collaboration with MSFT MicrosoftPositioning for the next wave of enterprise AI adoption, rather than the last earnings print:
1. Deepening Microsoft Integration = Real Distribution Power
The most important recent development is C3ai’s expanded collaboration with Microsoft:
C3 ai is now natively integrated across Microsoft Copilot, Microsoft Fabric and Azure AI Foundry, effectively becoming an “intelligence layer” on top of Microsoft’s enterprise stack.
This makes it much easier for large customers already running on Azure and using Copilot to deploy, manage, and scale vertical AI applications from C3ai (manufacturing, energy, financial services, government, etc.).
In simple terms: Microsoft brings the distribution and cloud muscle; C3ai brings vertical AI apps. If this integration starts to convert more pilots into long-term subscriptions, the current depressed valuation may not last.
2. Beaten-Down Expectations + Long Runway
Bears focus on the obvious problems:
Revenue has recently declined and margins are under pressure as C3 ai spends to convert pilots and expand its product suite.
Cash flow is negative, and there’s no GAAP profitability in sight yet.
However, management guides for positive free cash flow by FY26 and non-GAAP profitability in the second half of FY27, with strong revenue growth resuming as production deployments scale.
If those targets prove even roughly correct, the stock today is pricing in a lot of failure. Any upside surprise on:
deal conversions,
operating leverage, or
new, high-profile customer wins via Microsoft’s ecosystem
could trigger a meaningful re-rating from these levels.
3. Macro Headwinds as Future Tailwinds
Recent economic data and rate worries have hit high-growth tech – including C3ai – as investors fled anything with long-dated cash flows.
For a contrarian bull, that’s exactly the kind of environment where:
expectations are low,
sentiment is washed out,
and good news is under-priced.
If the macro picture stabilizes and rate-cut expectations firm up, beaten-down AI names like C3.ai can suddenly look interesting again, especially with a strategic partner like Microsoft in their corner.
AI is a potential buyout candidate, in my opinion.

Breaking; Beyond Meat, Inc. (NASDAQ; BYND) Spike 20% TodayBeyond Meat, Inc. (NASDAQ; BYND) Spike 20% Today albeit market turmoil.
The stock is gearing for a move to the $30 resistant should it break the $2 ceiling acting as the falling wedge.
Stock soared as much as 20% this morning. So it may come as a surprise to learn that the company has just been hit with a $38.9 million legal defeat in a trademark infringement case.
Shares pared those gains, but remained higher by 8% as of 12:58 p.m. ET.
Jury verdict vs. short squeeze
The trademark violation verdict stems from a lawsuit filed for infringing on a Vegadelphia Foods trademark covering the phrase "Where Great Taste Is Plant-Based." Vegadelphia sued Beyond Meat, as well as the coffee and doughnut company Dunkin', in 2022, alleging that the defendants' advertising slogan, "great taste, plant-based," infringed on Vegadelphia's federally registered trademark. Dunkin' settled its portion of the claims against it last year.
The $38.9 million verdict is significant for Beyond Meat. Consider that the plant-based meat substitute company reported revenue of $70.2 million in its third quarter. So why did the stock soar today?
It is likely retail investors at work. Beyond Meat became a meme stock driven by social media hype last month. Shares soared more than 300% in about a week before giving back most of those gains.
Financial Performance
In 2024, Beyond Meat's revenue was $326.45 million, a decrease of -4.93% compared to the previous year's $343.38 million. Losses were -$160.28 million, -52.60% less than in 2023.

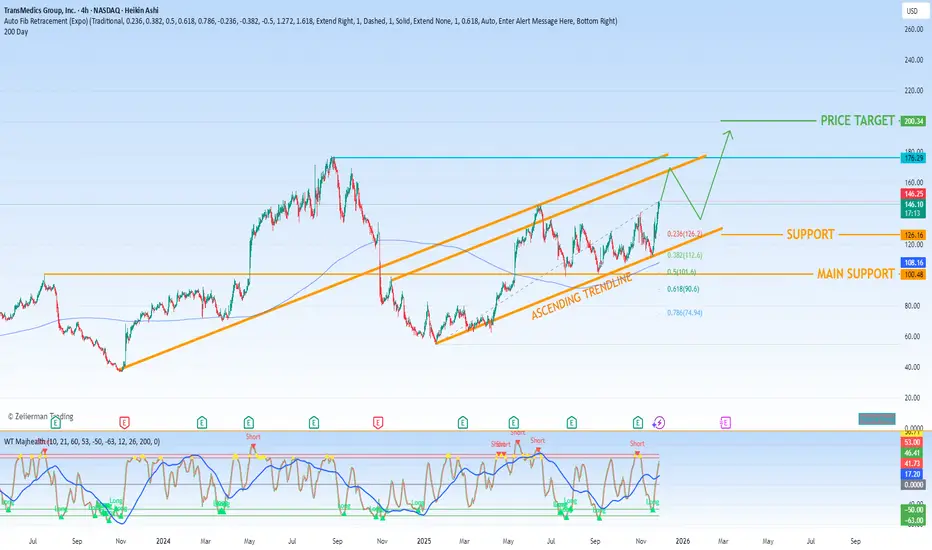
TransMedics Group (TMDX)Headquartered in Andover, MA, TransMedics Group (TMDX) is establishing itself as a disruptive force in the medical technology sector, focused on transforming organ transplant therapy. This innovative profile is being mirrored by its compelling performance in the public markets, where the stock is currently exhibiting a strong confluence of positive technical and fundamental indicators.
From a technical perspective, TMDX is demonstrating a robust and clearly defined bullish trajectory. The stock is consistently charting higher highs and higher lows, forming a solid ascending trendline that underscores a sustained and positive momentum. This upward channel suggests that buyer demand is consistently outpacing selling pressure.
A closer examination of key Fibonacci retracement levels, often used to identify potential support and resistance zones, reveals a healthy structure for continued upward movement. The primary and most significant support level rests at the 50% retracement mark, which corresponds to $101.60. This level represents a critical foundation for the current trend. A secondary, shallower support level is identified at the 23.6% retracement, positioned at $126.20. As long as the stock price maintains its position above these defined support levels, the technical outlook remains decidedly bullish. The overarching price target for this move is set at $200, a level that aligns with the measured momentum of the prevailing trend.
This strong technical posture is powerfully complemented by encouraging fundamental tailwinds. The stock currently holds a Zacks Rank #3 (Hold), accompanied by an attractive VGM Score of 'B'. Particularly noteworthy for momentum-focused investors is its high Momentum Style Score of 'B,' a quantitative assessment that confirms the stock's recent strength. This is evidenced by a notable 5.9% gain in share price over the past four weeks.
Furthermore, the fundamental picture is strengthening. Analyst sentiment is visibly improving, with six analysts revising their earnings estimates upwards for fiscal 2025 within the last 60 days. This collective optimism has driven the Zacks Consensus Estimate up by $0.27 to $2.61 per share. Adding to the company's impressive track record is its history of significantly outperforming expectations, boasting a staggering average earnings surprise of +79.3%.
In summary, TransMedics Group (TMDX) presents a compelling case where a powerful technical breakout, defined by a clear ascending trendline and key Fibonacci supports, is being validated by strengthening fundamentals and rising analyst confidence. This synergy between chart strength and earnings momentum paints a decidedly bullish picture for the stock's path toward its identified price targets.
VKTX Viking Therapeutics Potential Buyout Soon?!If you haven`t bought VKTX before the previous rally:
If GLP-1 obesity drugs are a multi-hundred-billion-dollar opportunity, a successful VK2735 (injectable + oral) could justify a valuation far north of where VKTX trades today—if it makes it to market.
My bullish thesis:
1. GLP-1 Momentum + “Mini Lilly / Novo” Narrative
VKTX is seen as a “pure play” on the global obesity and metabolic-disease boom.
Viking’s lead program, VK2735, is a dual GLP-1/GIP receptor agonist being developed in both injectable and oral form for obesity and related metabolic disorders.
Phase 1 and Phase 2 data for the injectable version have already shown meaningful weight loss with an encouraging safety/tolerability profile, which is why it advanced into large Phase 3 obesity trials.
An oral version of VK2735 is in Phase 2 obesity trials and, in the VENTURE oral study, delivered up to ~12.2% mean weight loss at 13 weeks, with a clear dose response.
2. Rapid Trial Execution = Strong Momentum & Upcoming Catalysts
Another big talking point is how fast Viking is executing on its trials, which bulls see as a leading indicator of future news flow:
Viking recently announced completion of enrollment in its Phase 3 VANQUISH-1 VK2735 obesity trial, with ~4,650 patients (above the original 4,500 target).
The company highlighted VK2735 data at ObesityWeek 2025 and continues to position both injectable and oral formulations as core programs.
Management has reiterated that VK2735 oral and injectable programs are moving forward on schedule, with more data expected as Phase 3 and longer-duration studies mature.
3. Short Interest + “Squeeze Fuel” Angle
VKTX has a high short interest, which Twitter traders love to highlight:
Recent data shows around 22–23% of the float short, with days to cover >5 based on average volume.
For many momentum and options traders, this is exactly the kind of setup they look for:
High short interest = a lot of investors betting against the stock.
Any positive surprise (trial data, partnership, M&A rumor, or a strong breakout on the chart) could force shorts to cover.
If that happens during a period of high retail interest, the price action can get violent to the upside.
4. Analyst Targets + Big Pharma Takeover Speculation
Analyst consensus is currently Strong Buy, with an average price target around $95+.
On top of that, there’s constant speculation that VKTX could become a takeover target:
The GLP-1 market is being dominated by Eli Lilly (Zepbound, Mounjaro) and Novo Nordisk (Wegovy, Ozempic).
Many large pharma companies without a strong obesity franchise might prefer buying a late-stage asset rather than starting from scratch.
VK2735, with Phase 3 obesity trials underway and promising oral data, is the kind of asset that fits that narrative.

Bullish Divergences on Lower TimeframesBullish divergences currently presenting on the 30min and below timeframes on the Accum/Distr and Money Flow Index indicators. Pop to $1.50 + could be imminent. If so, I will prepare for a subsequent retest of the floor at $1.13.

$UPS Good value setup to pair with technicals range breakStarted a NYSE:UPS long position.
One month of tight range = energy building. Next leg should be a breakout, and odds favor an upside resolve.
Good value setup to pair with the technicals.

PALANTIR Is there time to reach $250 before Bear Cycle begins?Palantir (PLTR) has been trading within a multi-year Channel Up throughout this Bull Cycle, which despite the recent correction just above the 1W MA200 (orange trend-line), it still stands.
The last time in fact that we had a similar 1W MA200 approach on such a 1D RSI pattern (RSI reaching 34.00) was on January 05 2024. What followed was a 1-month rally to the 1.618 Fibonacci extension.
As a result, if the market delivers a strong 'Santa Rally', we may see Palantir peak at $250.00 before a Bear Cycle begins.
---
** Please LIKE 👍, FOLLOW ✅, SHARE 🙌 and COMMENT ✍ if you enjoy this idea! Also share your ideas and charts in the comments section below! This is best way to keep it relevant, support us, keep the content here free and allow the idea to reach as many people as possible. **
---
💸💸💸💸💸💸
👇 👇 👇 👇 👇 👇

Elliot Waves on $OTSKY (Otsuka Holdings / Pocari Sweat)Potential 3rd wave beginning for OTC:OTSKY / 4578 (TSEJ).
Idea would be invalidated with a break below ~$22.
Expected confirmed move to be ~$50+.
Watching for a strong upward break above ~$29 to confirm move.
Could come from upcoming earnings results.
Additionally, IBD MarketSurge is showing a Cup & Handle with pivot @ $28.93.

fishing for the 3rd $ASST elliot waveAll recent up gaps have been filled. I like this setup when fishing for the bottom of an elliot correction wave, especially the 2nd wave. I am using the initial unusual volume candle around $0.90 as the bottom of a possible 3rd wave. But given the bounce after closing the final up gap, the 3rd wave could be in motion now. Not financial advice. Trade to be de-risked below $1.09. Trade invalidated and vacated below $0.90.

NKE Weekly Swing Insight – Bearish Bias Despite Bullish Market"QuantSignals V3 – Katy AI
Analysis Type: Swing (17-day horizon)
Current Price: $62.50
Trade Direction: BUY PUTS
Strike Price: $62.50 PUT
Entry Range: $1.85 – $2.15
Target 1: $3.50 (+67%)
Target 2: $4.80 (+123%)
Stop Loss: $1.10 (≈40% loss)
Expiry: 2025-12-12
Position Size: 3% of portfolio
Confidence Level: 62%
⚠️ Risk & Conflict
Katy-LLM Conflict: Katy AI predicts bearish move (-0.86% over 2-3 weeks), but LLM recommendation is BUY CALLS. Medium severity.
Risk Level: Moderate
VIX Context: Falling but elevated at 20.19, moderate volatility environment.
🧠 Analysis Summary
Technical: Stock near 84.9% of swing range, weak momentum, resistance at $66.32, support at $61.01.
Candlestick Patterns: None detected
Options Flow: Strong bearish bias, Put/Call Ratio 1.40, unusual activity at $51 PUT indicates institutional positioning.
Market Context: Overall bullish market, but NKE relatively weak. Sector pressures from tariffs noted.
News Sentiment: Mostly neutral; some negative apparel sector news (tariffs, Levi’s CEO statements).
⚡ Competitive Edge
Katy AI’s bearish prediction combined with elevated put/call ratio and technical resistance creates a high-probability swing setup.
Timing advantage: stock at top of swing range with weak momentum – optimal for reversal.
Risk mitigation: 17-day expiry, tight stop, conservative position size.

QuantSignals V3: META Lacks Sufficient Momentum for TradeMETA QuantSignals Katy 1M Prediction 2025-11-26
Ticker: META
Signal Type: QuantSignals Katy 1M
Date: 2025-11-26
🔍 Analysis Summary
Current Price: $636.90
Final Prediction: $636.00 (-0.14%)
30min Target: $637.62 (+0.11%)
Trend: NEUTRAL
Confidence: 42.4% (Below trade threshold)
Volatility: 12.6%
⚠️ Trade Signal
No trade signal generated
Reason: Insufficient confidence and insufficient move size
Market shows flat momentum with tight trading range.
📌 Summary
0 trade signals generated from 1 analysis.
Recommendation: Wait for stronger trend or higher confidence before entering a trade.

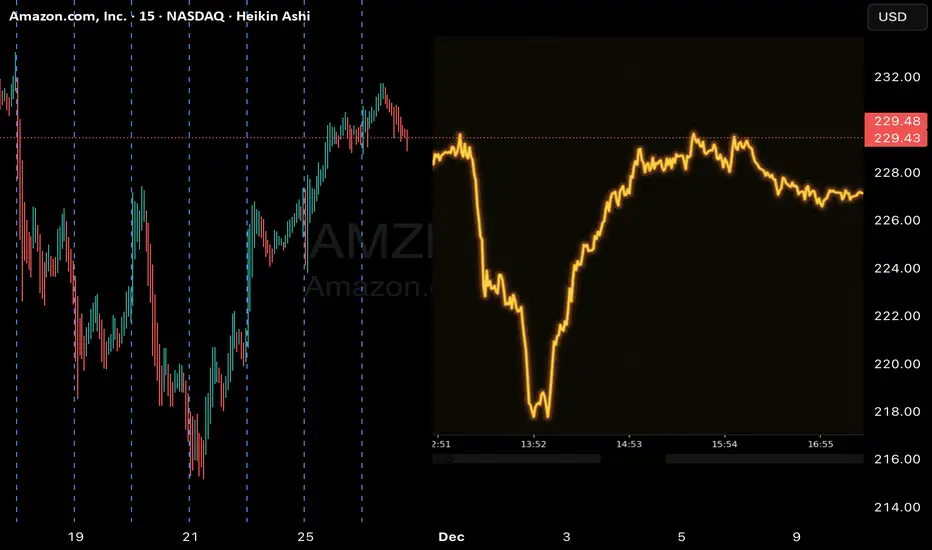
AMZN Sideways Action — Quant Model Predicts Minimal MoveAMZN QuantSignals Katy 1M Prediction 2025-11-26
Ticker: AMZN
Signal Type: QuantSignals Katy 1M
Date: 2025-11-26
🔍 Analysis Summary
Current Price: $230.84
Final Prediction: $230.55 (-0.13%)
30min Target: $230.91 (+0.03%)
Trend: NEUTRAL
Confidence: 46.2% (Below trade threshold)
Volatility: 8.8%
⚠️ Trade Signal
No trade signal generated
Reason: Insufficient confidence and insufficient move size
Market conditions show flat momentum and tight range.
📌 Summary
0 trade signals generated from 1 analysis.
Model suggests waiting for clearer trend or higher confidence before entering.
Micron Technology - The end will come soon!✂️Micron Technology ( NASDAQ:MU ) will create a top soon:
🔎Analysis summary:
Starting back in mid 2025, Micron Technology retested a major confluence of support. This retest was followed by an expected rally of about +250%. But soon, Micron Technology will create a short term top formation, followed by a healthy correction towards the downside.
📝Levels to watch:
$250
SwingTraderPhil
SwingTrading.Simplified. | Investing.Simplified. | #LONGTERMVISION

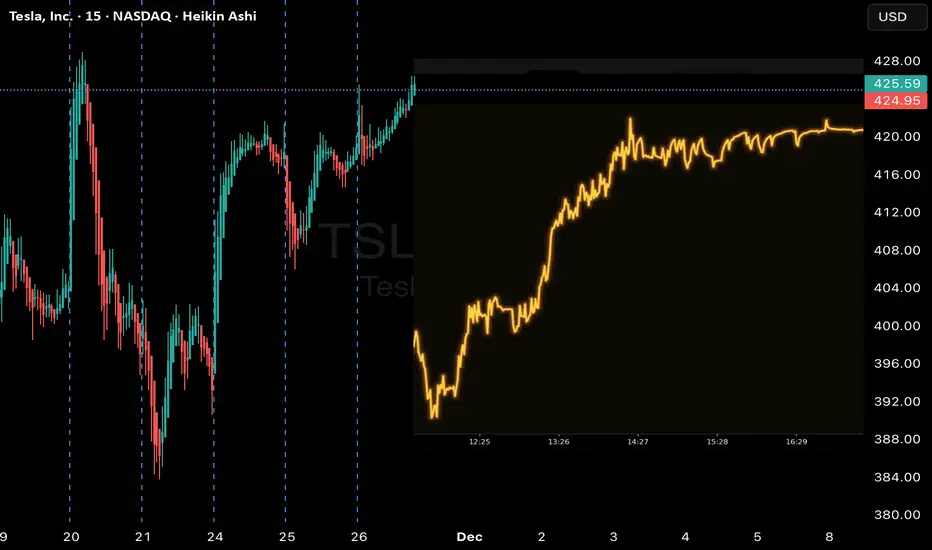
Tesla Long Alert: Katy AI Projects Upward MomentumTSLA QuantSignals Katy 1M Prediction 2025-11-26
Ticker: SPY
Signal Type: Daily / Weekly
Direction: BULLISH / BEARISH / NEUTRAL
Confidence: 0%
Current Price: $0.00
Entry: $0.00
Targets:
T1: $0.00
T2: $0.00
Stop Loss: $0.00
Expiry: (If using options)
📈 TradingView Information — Template 2 (Advanced)
📉 Trend:
Primary Trend: XX
Volume Strength: XX
Volatility Index: XX
Momentum Score: XX
🎯 Signal Levels:
Buy Zone: $0.00 – $0.00
Risk Zone: $0.00
Profit Zone 1: $0.00
Profit Zone 2: $0.00
📌 Analyst Note:
Short summary (e.g., “Momentum weakening, approaching supply zone.”)
🚀 TradingView Information — QuantSignals Style
Ticker: SPY
Final Prediction: $0.00 (±0.00%)
30min Target: $0.00 (±0.00%)
Trend: BULLISH / BEARISH / NEUTRAL
Confidence: 0.0%
Volatility: 0.0%
Google - A major correction starts now!🚽Google ( NASDAQ:GOOGL ) is now creating a top:
🔎Analysis summary:
Over the course of the past couple of months, we witnessed a major rally on Google of about +100%. This rally was totally expected, following the underlying bullish rising channel. But with the current retest of the trendline, Google is heading for a major correction.
📝Levels to watch:
$300 and $200
SwingTraderPhil
SwingTrading.Simplified. | Investing.Simplified. | #LONGTERMVISION

Waldencast, bullish potential?I bought in around $2.20 last week after spotting the setup on the chart. The breakout to $3 was perfect, so I sold a portion to lock in profits. With the recent positive news, I believe the stock has now broken out of its longer-term downtrend. The pullback after the Q3 report feels normal, and it looks like a classic retest of the breakout level is underway. If the price successfully holds and retests this zone, I expect it to push back toward $3 and potentially higher. The real catalyst should come in Q1–Q2 2026—that’s the make-or-break period for this name.

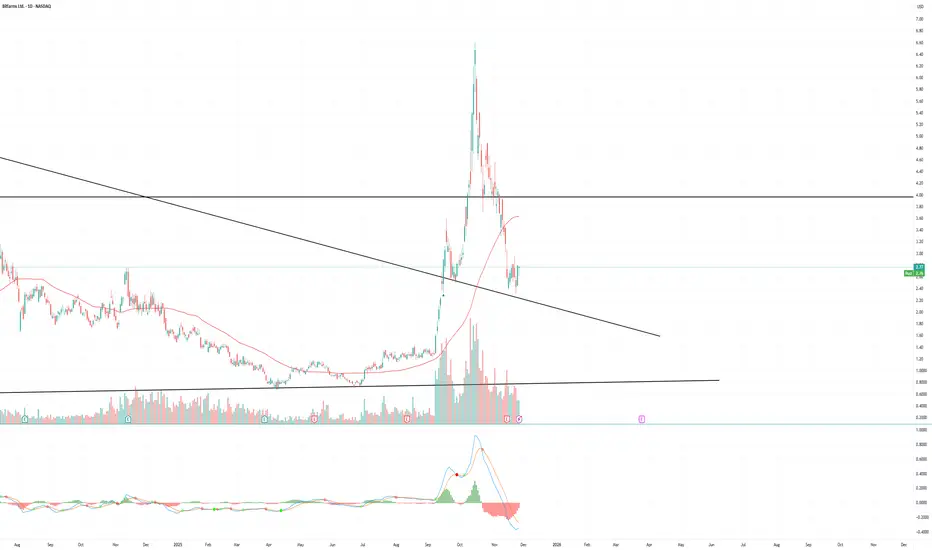
Is it time to reload $BITF? We caught the breakout in NASDAQ:BITF when it was below 3 earlier this year. It ripped all the way to $6+. Since then, the stock imploded back to the original crime scene amidst the AI overvaluation selloff. The $2.30 area provides good support and the stock has reacted off that level. If Bitfarms can scale its entrance into AI/HPC capabilities, the stock should be able to see the $3.8-4 area barring any further market selloff on AI names.
Stock is current trading around $2.70. I would put my stop at $2.30 if taking this idea.
Best of luck if tailing.
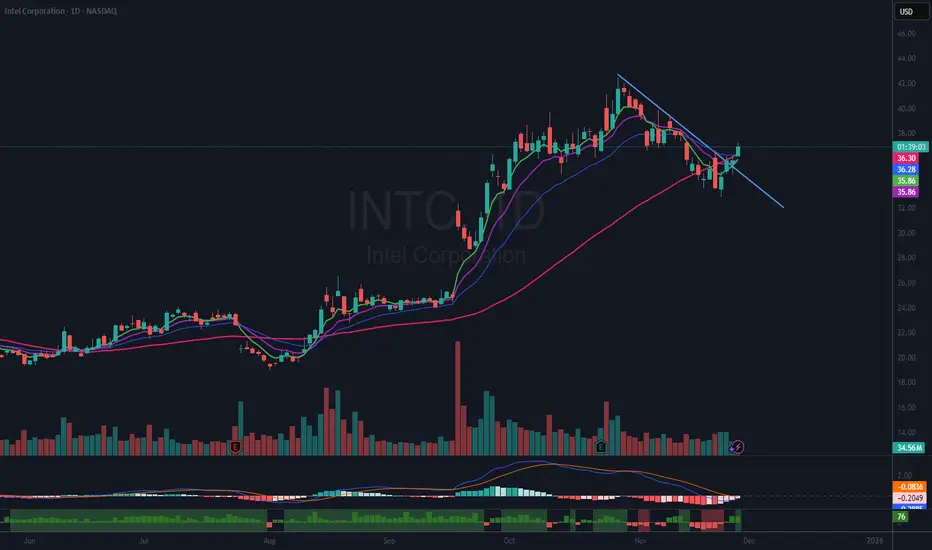
$INTC Classic 20% Pullback AnalysisOverview of Recent INTC Performance
Intel Corporation (INTC) experienced significant positive momentum following its gap-up breakout on September 18th. From the closing high on September 17th to the closing high on October 28th, the stock delivered an impressive gain of 67%.
Subsequent Pullback and Technical Retracement
After reaching its peak, INTC underwent a pullback of just over 19%. This decline represented a 50% retracement of the prior advance, a common technical milestone. During this period, the stock briefly dipped below its 50-day moving average (DMA), a level often regarded as a key support by technical analysts.
Recovery and Position Initiation
Today INTC reclaimed both the 50-day moving average and the 20-day exponential moving average (EMA). Additionally, the stock broke above its downtrend line, signaling renewed strength. In response to these technical developments, I initiated a half-size position in INTC, setting a stop-loss just below the day’s low to manage risk.
Risk Management and Investment Disclaimer
Readers need to conduct their own analysis and adhere to their personal trading strategies. Please remember that all investments involve inherent risks. Making informed decisions is crucial when allocating capital in the financial markets.
BYND IS READY FOR ROUND 2 AND TURKEYHoly moly my frennnnnn
BYND time for the second pump
We always get second pump when everyone finish and dead people
I dont think this does 1 more leg if it does my ass sore, but I will be in this baby papi when it does second pump. His freidns BTC PEPE GME AMC allways like second legs when everyone dead hehehehehe
I'm long a lot of BYND over TG and I think I lBYND LIKES TURKEY MY FREN

Klarna back up to $45Klarna is looking to run back up to $45. So far there has been no company selling of the stock which is a good sign for this holding.
There could be a retest of $30 support.
I'm honestly shocked this ever fell below the IPO price.
Good luck!

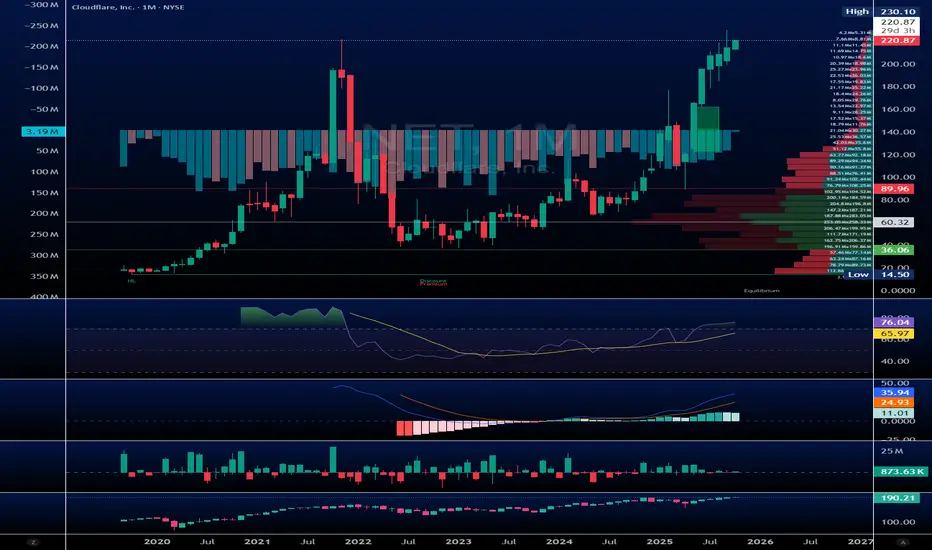
Bearish $NET 2021 Highs Finding Resistance 2025at Nov 2021 Highs and finding some resistance. earnings 10/30/25 potentially some downside bearish
High-Volatility Breakout Trade (Explosive Growth+Gold Leverage)🎯 Ticker: KGC (NYSE)
📈 Type: Swing Long / Momentum Trade
⏰ Timeframe: Daily & 4H
📊 Technical & Fundamental Analysis:
Trend Structure: BULLISH 4H/1H Trends, Daily Base Formation ✅
Key Level: Breaking above $27.40 multi-month resistance
Sector: Gold Mining - High Beta to Gold Prices
💡 Trading Thesis:
KGC offers explosive growth potential with gold sector leverage:
EXCEPTIONAL FUNDAMENTAL GROWTH (Score: 7/9):
Revenue Growth: +21.4% ($5.15B → $4.24B)
Earnings Growth: +127.9% ($949M → $416M) 🚀
Valuation: P/E 17.4 (Reasonable for growth)
Financial Health: Debt Score 10/10 (Excellent)
TECHNICAL BREAKOUT SETUP:
Testing critical $27.40 resistance level
Successful break opens path to $30+ zone
Gold sector showing renewed strength
MACRO CATALYSTS:
Gold price resilience amid rate cut expectations
Safe-haven demand during geopolitical uncertainty
Miner operational improvements driving margin expansion
⚡ Trading Plan:
🎯 Entry: $27.45 (Breakout confirmation above $27.40)
🛑 Stop Loss: $23.59 (Below key support & 50-day MA)
💰 Profit Target: $35.08 (Extended Fibonacci target)
📊 Risk/Reward Ratio: 1:2.0 (Strong for high-volatility name)
📉 Risk Management Notes:
High volatility stock - use reduced position size
Stop loss accounts for normal gold stock swings
Consider partial profit taking at $31.50-32.00
Monitor gold futures (GC) for sector direction
Maximum 1.5% portfolio risk recommended
🚀 Momentum Catalysts:
Gold breaking above $2400/oz resistance
Fed pivot expectations growing
Central bank gold buying acceleration
Mine production beating expectations
Conclusion: KGC offers a high-risk/high-reward breakout trade with exceptional earnings growth and gold sector leverage. The +127% earnings growth provides fundamental justification for the technical breakout above critical resistance.
Trade the breakout, respect the volatility!
Disclaimer: This is not investment advice. Gold miners are high-volatility instruments. Conduct your own research and manage risk appropriately. Never risk more than you can afford to lose.
#KGC #SwingTrading #Long #Gold #Mining #Breakout #GrowthStocks #TechnicalAnalysis
