Options Trading Idea: Energy Transfer LP 1-3 MonthsThree companies caught our eye last week from insider activity, namely:
Transocean (RIG): Offshore drilling upcycle fueling new high-rate contracts. Insiders bought millions of shares, signalling confidence. Strong oil prices and recent debt reduction amplify upside. Short-term catalysts: additional rig contract wins and positive earnings momentum.
Gran Tierra (GTE): Oversold oil producer with 30% YoY output growth. Upcoming catalyst: management’s debt-cut plan (Dec) – could re-rate equity higher. High risk-reward, as leverage magnifies upside if the plan succeeds.
Energy Transfer (ET): A high-yield midstream MLP offering, the insiders are accumulating shares at a cheap valuation. Lower-risk trade with a catalyst of potential distribution growth or project news.
1. What Energy Transfer Actually Does
Energy Transfer LP exemplifies an expansive midstream energy infrastructure, driven by its vast pipeline network and strategic market positioning. It is one of the most extensive midstream energy partnerships in North America, owning and operating more than 130,000 miles of pipelines and associated storage, processing, and export infrastructure across the U.S., moving natural gas, NGLs, crude oil, and refined products from wellhead to end markets.
Broadly, its system is organised into:
NGL & refined products (fractionation, the process where raw liquids are split into higher-value products; storage facilities; export docks)
Crude oil transportation (gathering, which involves collecting oil from different sources; long-haul pipelines for transportation)
Natural gas/midstream (gathering, processing, intrastate and interstate pipelines)
Investments in Sunoco LP & USA Compression (fuel distribution and compression services)
This integrated footprint gives ET exposure to most major U.S. basins, especially the Permian, and to global NGL markets via Gulf Coast export terminals.
2. Earnings Power and Margin Structure
Over the last 12 months, Energy Transfer generated about $79.8 billion in revenue and $4.3 billion in net earnings, implying a net margin of about ~5%. This margin can be attributed to the company’s strategic balance between tariff contracts and commodity exposure. A significant portion of the earnings is stabilised by long-term tariff contracts, which ensure consistent revenue regardless of market fluctuations. On the other hand, spot market deals tied to commodity prices introduce some variability. Gross profit was roughly $16.1 billion against a $63.7 billion cost of revenue. These figures underline the operational leverage and its capacity to manage expenses effectively.
These numbers matter because they frame the debate around ET:
On one hand, scale and diversification support relatively stable cash flows even when commodity prices swing.
On the other hand, it is still a capital-intensive, low-margin business, which means balance-sheet discipline and project selection are crucial for equity holders.
From a growth perspective, analysts expect ~11% annual EPS growth and ~6.4% revenue growth over the next several years, slightly below broader U.S. market earnings growth but ahead of typical pipeline peers on revenue.
3. Balance Sheet: Leverage With Cushion
Midstream investors care as much about leverage as they do about growth. Energy Transfer historically carried a heavy debt load following years of acquisition-driven expansion. Two years ago, the debt-to-EBITDA ratio was around 5.0x. Today, it has improved to approximately 4.3x, showcasing the company’s commitment to reducing leverage and highlighting tangible progress in its financial strategy.
Short-term assets: ~$17.4bn vs short-term liabilities of ~$12.4bn
Long-term assets: ~$111.9bn vs long-term liabilities of ~$69.8bn
This tells us three things:
The asset base is large and tangible – pipelines, plants, and terminals that are hard (and expensive) to replicate.
ET has favourable short-term coverage; current assets comfortably back near-term obligations.
Long-term leverage is meaningful, but assets still exceed liabilities by a wide margin, giving lenders and equity holders a buffer.
Credit-rating agencies and management guidance suggest a target leverage range around 4.0–4.5x debt/EBITDA, with recent trends moving gradually lower as growth capex moderates.
4. Ownership and Insider Alignment
One of the more interesting aspects of Energy Transfer is who owns it.
General public: 64.7%
Institutions: 31%
Individual insiders: 4.27%. That 4.27% is not trivial on a partnership of this size. It reflects substantial holdings by Executive Chairman Kelcy Warren and other insiders, who collectively own more than 140 million units. Warren’s recent purchase of an additional 2 million units in the open market represents a significant personal investment, estimated to be a considerable portion of his personal net worth. This strong alignment of interests with other stakeholders suggests a deep conviction in Energy Transfer's long-term prospects.
Recently, Warren purchased an additional 2 million units in the open market, at a cost of roughly $33 million of personal capital. Historically, Warren’s heavy open-market purchases have often coincided with attractive entry points for long-term investors.
5. Valuation: A Deep Discount on Cash Flows
Where the story becomes compelling is the valuation. The Simply Wall St fair-value gauge shows:
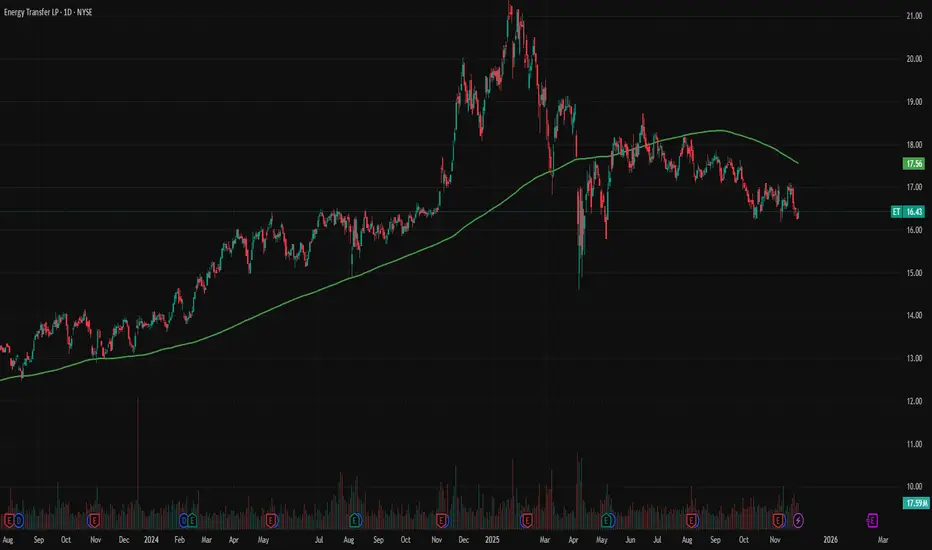
Current price: ~$16.27
Estimated fair value: ~$43.57
Implied 62.7% undervaluation
This fair value is based on a discounted cash flow (DCF) model using consensus forecasts and a cost of equity input. To stress-test these assumptions, consider a scenario in which growth drops by two percentage points or the cost of equity rises by 1%. Even under these more conservative assumptions, the valuation gap remains significant, suggesting ET is at least modestly undervalued.
External sources corroborate this discount:
The units trade at about 8–9x forward distributable cash flow (DCF), translating to an implied earnings yield of approximately 30%. This perspective highlights the potential upside for income-focused investors. In comparison, high-quality utility-like infrastructure often trades at mid-teens multiples, and many midstream peers trade at 10–12x. This gap in peer multiples can be viewed as a margin of safety for investors considering ET.
The distribution yield is ~7–8%, and coverage has been trending toward ~2x on a DCF basis, providing room for modest distribution growth or buybacks.
Relative PE vs Peers
Your PE-comparison chart reinforces the absolute valuation story:
ET: ~13x earnings
Kinder Morgan: ~21.8x
Williams Companies: ~30.6x
Enterprise Products Partners: ~12.3x
MPLX: ~11.3x
Peers on average trade closer to 19x, yet ET sits near the bottom of the range despite comparable or slightly better earnings growth forecasts.
6. Growth Outlook and Capital Allocation
Consensus expects ET’s earnings to grow ~11.2% annually, broadly in line with the midstream industry’s 12.1% but below the broader U.S. market at 16%. Revenue is forecast to grow 6.4% annually, versus the industry’s 3.1%.
In plain language:
Top line grows slightly faster than peers, driven by Permian volumes and NGL exports.
Bottom line growth is slightly slower than the market because ET is more mature and capital-intensive.
Management has signalled a pivot from “growth at all costs” toward balanced capital allocation:
Moderating growth capex, many big projects are either complete or nearing completion.
Using incremental cash to deleverage, targeting lower debt/EBITDA.
Gradually increasing distributions and opportunistically returning capital (e.g., buybacks) when units are undervalued.
7. Translating this into Strategy
Information on the strategies is based on options pricing data from TradingView, assessed on 26 November 2025.
7.1. Best Income Play (High Probability)
SELL CASH-SECURED PUT - Strike: $16 (Dec 26 or Jan 2)
Delta: ~0.24
Premium: ~$0.22–$0.28
Probability of expiring OTM: ~76%
Implied return: 1.3–1.7% for 35–40 days
Annualised return ≈ 14–17%
Why it works
ET is fundamentally undervalued.
Strike is very close to support.
You get paid whether the price goes up or stays flat.
Best market condition
Sideways to slightly bullish.
7.2. Best Directional Trade (High Reward, Low Risk)
BULL CALL SPREAD — Buy $16.5 / Sell $17.5 (Jan 2)
Buy 16.5 call (~$0.34 ask)
Sell 17.5 call (~$0.18 ask)
Net debit ~ $0.16
Payoff
Max profit: $1.00 spread – $0.16 cost = $0.84 (525% return)
Breakeven: $16.66
Max loss: $0.16
Why is this optimal
ET expected to drift into $17–18 zone.
Liquidity is strong at 16.5 and 17.0/17.5 strikes (your images show thick volume).
Small debit, very convex profile.
Excellent theta efficiency.
7.3. Best Intermediate Strategy (Theta + Delta Blend)
DIAGONAL CALL SPREAD — Buy Jan 2 $17 call / Sell Dec 19 $17.5 call
This captures IV skew + slow grind upwards.
Long leg has more time (Jan 2).
Short leg burns faster (theta gain).
You roll the short call forward every week.
Why it’s powerful
ET moves slowly → diagonals exploit drip-up movement.
You earn time decay each week as your long call appreciates.
7.4. High Win-Rate Spread (Good for Small Accounts)
CREDIT PUT SPREAD — Sell $16 / Buy $15.5 (Dec 26)
Collect ~$0.08–0.10 credit
Max loss: $0.40
Win rate: ~74%
Probability of profit: ~70%+
Better risk-adjusted than naked puts for smaller capital.
7.5. Directional “Rerating + Breakout” Strategy
BROKEN-WING BUTTERFLY — 16.5 / 17.5 / 19 (Jan 2)
Cheap entry (~$0.05–0.10)
Max profit if ET closes near $17.50
Higher profit zone extended due to long wing at $19
This captures the slow drift and gives a huge reward if ET spikes.
Note, this is not financial or trading advice; the information represented in this article is for information and research purposes only. All graphic information and options data were sourced from TradingView and Simple Wall Street.
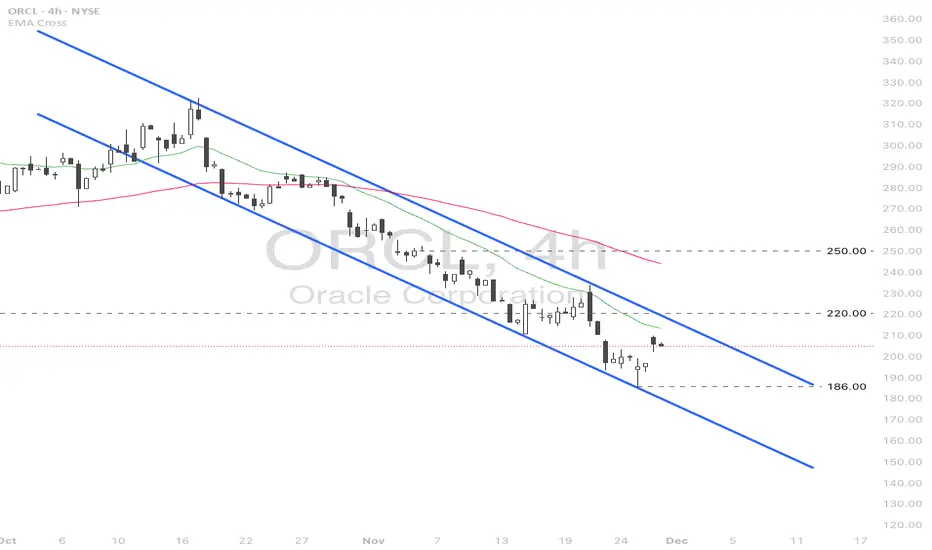
Oracle (ORCL) rebounded on renewed AI momentum.
Surging Alphabet (GOOGL) and revived Nvidia (NVDA) stock prices are leading the AI momentum. Oracle (ORCL), which fell over 40% from its high on amplified doubts over its 300 bln USD computing contract with OpenAI, saw a rebound.
Deutsche Bank assessed the drop in ORCL stock as providing an attractive entry point. They valued the current price as reflecting no positives, citing EPS (ex-OpenAI costs) at 17 USD and FCF at 31 bln USD, both below company guidance.
HSBC also issued a Buy rating on ORCL, expecting various financing strategies for data center costs to be announced, thereby mitigating balance sheet burden and diversifying risk.
ORCL briefly tested the 186.00 low before slightly rebounding. The price remains within the descending channel and below the bearish EMAs, indicating the potential downtrend extension. If ORCL breaches above EMA21 and 220.00, the price could advance toward the next resistance at 250.00.
Conversely, if ORCL fails to close above EMA21, the price may retreat toward the following support at 186.00.
Trading Strategies and Index Investment1. Introduction: Trading vs Index Investing
Trading involves buying and selling financial instruments in shorter timeframes to profit from price fluctuations. Index investing, on the other hand, focuses on long-term wealth creation by tracking the performance of a market index like the Nifty 50, Sensex, S&P 500, or NASDAQ 100.
While traders depend on market timing, momentum, volatility, and technical setups, index investors rely on discipline, low cost, and time-driven compounding. Both approaches serve different objectives and require different skill sets.
2. Major Trading Strategies Used in Financial Markets
A. Intraday Trading
Intraday trading refers to buying and selling within the same day. Traders aim to capture small price movements and typically close all positions before the market shuts.
Key techniques include:
Breakout Trading: Entering when the price breaks above resistance or below support.
Volume and Volatility Trading: Using spikes in volume or volatility to anticipate intraday trends.
Scalping: Making multiple quick trades to profit from tiny price changes.
Skill requirement: Strong technical analysis, risk control, and emotional discipline.
B. Swing Trading
Swing trading targets price moves spanning several days to weeks. This strategy is ideal for those who want to avoid the stress of intraday noise yet prefer active participation.
Popular tools include:
Trendlines and channels
Moving averages (20-, 50-, 200-day)
RSI, MACD, Stochastic
Support-resistance zones
Swing traders capitalize on market swings that occur within broader trends.
C. Position Trading
Position traders hold assets for weeks or months, combining technical triggers with macroeconomic analysis.
Key metrics:
Interest rates
Economic cycles
Earnings growth (for equities)
Commodity cycles
This strategy suits individuals seeking medium-term returns without daily monitoring.
D. Momentum Trading
Momentum traders buy assets that are rising and sell assets that are falling. The philosophy is simple: “the trend is your friend.”
Indicators include:
Relative Strength Index (RSI)
MACD
Rate of Change (ROC)
Volume analysis
Momentum strategies perform well during strong trending markets but can suffer in sideways markets.
E. Algorithmic and Quantitative Trading
Algo trading uses computer programs to execute trades based on mathematical models. Many institutions and advanced retail traders employ:
High-frequency trading (HFT)
Statistical arbitrage
Mean reversion models
Machine learning–based systems
Algo trading removes human emotions and allows ultra-fast executions.
F. Options Trading Strategies
Options expand trading flexibility through strategies like:
Buying Calls/Puts (directional bets)
Selling Options (income generation)
Spreads (Bull Call, Bear Put, Iron Condor)
Hedging portfolios
Options allow traders to manage risk, speculate, or generate regular income.
3. Core Principles Behind Successful Trading Strategies
Regardless of strategy, certain principles determine long-term success:
A. Risk Management
The most critical factor. Traders must fix:
Stop-loss levels
Position sizing
Maximum loss per trade
Daily loss limits
Without discipline, even the best strategy fails.
B. Psychology and Emotional Control
Fear, greed, and impatience lead to poor decisions. Professional traders emphasize:
Sticking to the plan
Avoiding revenge trading
Staying consistent
Recording trades and reviewing mistakes
C. Market Structure and Trend Recognition
Understanding trends, ranges, liquidity zones, and market phases helps traders avoid confusion and noise.
D. Backtesting and Strategy Optimization
Before risking real capital, strategies must be tested on historical data. Key evaluation metrics include:
Win rate
Average return per trade
Maximum drawdown
Risk-reward ratio
4. Introduction to Index Investing
Index investing involves buying a basket of securities that track a broad market index. It is a passive investment strategy, focused on long-term wealth building without frequent buying or selling.
Examples of popular indices:
India: Nifty 50, Sensex, Nifty Next 50, Nifty Bank
Global: S&P 500, Dow Jones, NASDAQ 100, FTSE 100
Index investing is typically done through:
Index funds
Exchange-Traded Funds (ETFs)
Index-based systematic investment plans (SIPs)
5. Why Index Investing Works
A. Broad Diversification
An index spreads investment across multiple sectors and companies, reducing single-stock risk.
B. Low Costs
Since there is no active fund manager, expense ratios are much lower.
C. Long-Term Compounding
Index investing leverages time rather than timing. Markets generally rise over the long run as economies expand.
D. Consistent Performance
Most actively managed funds fail to beat major indices over long periods. Index funds often outperform because they avoid high fees and complex decisions.
6. Popular Index Investment Strategies
A. Buy and Hold
Investing a lump sum or systematically and holding for decades. Suitable for retirement and long-term goals.
B. Systematic Investment Plans (SIP)
Investing fixed amounts regularly. Benefits:
Rupee cost averaging
Disciplined investing
Emotional neutrality
C. Smart Beta Strategies
Smart beta funds track indices based on factors like:
Value
Momentum
Low volatility
Quality
Equal weight
These offer a mix of passive and active management.
D. ETF Trading and Tactical Allocation
Some investors actively buy and sell index ETFs based on:
Market cycles
Interest rates
Sector rotations
This blends trading with index investing.
7. Combining Trading Strategies with Index Investing
Many professional investors use a hybrid approach:
Core Portfolio: 60–80% in index funds/ETFs for long-term stability
Satellites: 20–40% in active trading or high-conviction positions
This maintains balance between growth and risk.
8. Final Thoughts
Trading strategies and index investing represent two ends of the investment spectrum—one active and tactical, the other passive and long-term. Traders seek to capitalize on market inefficiencies, short-term momentum, or technical signals. Index investors rely on the power of diversification, low cost, and long-term market growth.
A smart market participant understands both worlds and uses them based on their financial goals, risk tolerance, and time availability. Successful wealth creation doesn’t depend on choosing one over the other, but on aligning them intelligently with one’s personal financial roadmap.
Best Ways of Trading1. Trade with a Clear Strategy (Not Emotion or Guesswork)
One of the biggest mistakes new traders make is trading without a defined plan. The best way to trade is to follow a tested strategy. Some proven trading styles include:
a) Trend Trading
This approach involves identifying the overall market direction and trading in line with it. Trend traders use tools like moving averages (20, 50, 200), MACD, or trendlines to determine direction. The idea is simple:
“Trade with the trend until it ends.”
b) Swing Trading
Swing trading works best for people who cannot monitor markets all day. This approach aims to catch reversals or continuation moves over days to weeks. Traders look for key support/resistance, breakouts, and candlestick patterns.
c) Intraday Trading
Intraday traders look for small, high-probability moves within a single session. The best intraday setups come from volume spikes, VWAP, breakout zones, and strong trend days.
d) Momentum Trading
Momentum traders focus on stocks or instruments that show strong volume and price acceleration. When markets move rapidly in one direction, momentum traders ride the wave.
e) Options Trading
Options allow traders to profit using leverage and hedge positions. Buying calls and puts, selling options for premium, or using spreads can significantly enhance risk-reward profiles.
f) Algorithmic or Systematic Trading
A growing method that uses rules, automation, or AI-driven models. This reduces emotions and increases consistency.
The best traders select one main strategy and master it, rather than attempting everything.
2. Follow Multi-Time-Frame Analysis
Always confirm trades using multiple time frames. For example:
Long-term trend – weekly chart
Medium trend – daily chart
Entry timing – 15-minute or 5-minute chart
This prevents taking trades against the broader market direction. When all time frames align, the probability of success increases dramatically.
3. Master Risk Management (The Heart of Successful Trading)
Even the best strategy fails without proper risk control. The strongest traders treat risk management as the core of their system.
a) Risk per Trade
Smart traders risk 1–2% of their capital on any single trade. This helps avoid catastrophic losses.
b) Stop-Loss Use
Always define where the trade is wrong and set a stop-loss accordingly. A systematic stop-loss protects capital and preserves longevity.
c) Position Sizing
Your position size should be based on your risk per trade and stop-loss distance, not on emotions or random judgment.
d) Risk-to-Reward Ratio (RRR)
Successful traders aim for at least 1:2 or 1:3 RRR.
This means:
If you risk ₹1, you target ₹2 or ₹3.
e) Avoid Overtrading
One of the most common reasons traders lose money is taking too many trades. Quality beats quantity.
Risk management is the backbone of consistent long-term profitability.
4. Use Technical and Fundamental Analysis Together
The best trading approach usually combines elements of both.
Technical Analysis helps with:
Timing entry and exit
Understanding trend structure
Recognizing chart patterns
Interpreting market psychology
Key indicators include RSI, MACD, Bollinger Bands, moving averages, and volume-based tools.
Fundamental Analysis helps with:
Identifying long-term direction
Understanding earnings, interest rates, inflation
Recognizing geopolitical and macroeconomic risks
Selecting strong long-term stocks or commodities
A trader who understands both sides sees the market differently and more accurately.
5. Develop Strong Trading Psychology
The market is a psychological battlefield. The best traders keep emotions under control. Some core psychological frameworks include:
a) Discipline and Patience
Only take setups that match your strategy. Good traders wait for the right moment.
b) Emotion Control
Fear and greed destroy accounts. The best way to avoid emotional decisions is to follow a rule-based system.
c) Accepting Losses
Even top traders lose 40–50% of trades. Losses are part of the game. The goal is to keep them small.
d) Avoiding the “Revenge Trade” Trap
Never attempt to win back losses instantly. This leads to impulsive decisions and bigger losses.
Mastering psychology is as important as mastering charts.
6. Backtest and Forward-Test Your Strategy
Before risking real money, test your strategy historically (backtesting). Check:
Win rate
Average gain vs average loss
Maximum drawdown
Consistency during different market conditions
Follow this with paper trading to see real-time behavior. A strategy that performs well in backtests and paper trading has higher chances of success in real markets.
7. Use Technology to Your Advantage
Modern trading has advanced tools:
Algorithmic screeners
Charting platforms
AI-driven market sentiment analysis
Automated alerts
Portfolio trackers
Order execution bots
Technology increases efficiency and reduces human error.
8. Follow Market Cycles and Global Trends
Markets move in cycles: accumulation, uptrend, distribution, correction.
Understanding economic cycles, liquidity conditions, central bank policy, and geopolitical events helps you choose the right instruments and strategies.
For example:
High inflation phase → commodities tend to outperform
Low interest rates → equities rally
Geopolitical tensions → gold, USD strengthen
Trading in sync with macro trends improves accuracy.
9. Diversify Your Trading Portfolio
Do not rely on one asset or one market. Trade multiple instruments (equities, commodities, indices, currencies) to reduce risk. A diversified portfolio smoothens performance and reduces emotional pressure.
10. Keep a Trading Journal
A trading journal is one of the most effective tools for improvement. Record:
Entry & exit levels
Strategy used
Reason for trade
Emotions felt
Result and analysis
Review your journal weekly. It reveals patterns in your behavior, helping you correct mistakes and become a more consistent trader.
Conclusion: What Is the Best Way of Trading?
There is no one “best way,” but the best traders combine:
A clear, tested strategy
Multi-time-frame confirmation
Strong risk management
Mastered psychology
Smart use of technology
Discipline in execution
Trading is not about predicting the future; it's about managing risk, following a system, and staying emotionally stable. If you approach it scientifically and patiently, you can achieve long-term success in any market.

Global Finance and Central Control1. The Architecture of Global Finance
The modern global financial system is built on several interconnected layers:
a) International Financial Markets
These include:
Foreign exchange (Forex) markets where currencies are traded.
Global bond markets where governments and corporations borrow.
Equity markets where companies raise capital.
Derivatives markets where risk is traded through futures, options, and swaps.
These markets operate almost 24/7 and link every financial center—New York, London, Tokyo, Singapore, Dubai, Frankfurt.
b) Cross-Border Capital Flows
Capital moves across borders in the form of:
Foreign direct investment (FDI)
Portfolio investments in stocks and bonds
Bank lending
Remittances
Trade financing
These flows allow nations to grow, but they also expose countries to global shocks.
c) Financial Institutions
The key pillars include:
Global banks (JPMorgan, HSBC, Citi, Standard Chartered)
Multinational corporations
Pension funds and sovereign wealth funds
Hedge funds and private equity
Central banks and regulatory bodies
Together, these institutions shape how money circulates globally.
2. The Rise of Central Control in Global Finance
Although global finance appears “free-flowing,” it is not without central oversight. Control is exerted in three broad ways:
A. Central Banks: The Nerve Centers of Financial Power
Central banks are the most powerful financial institutions within countries, but their influence spills into global markets.
Key Functions
Set interest rates that influence global borrowing.
Control money supply and liquidity.
Stabilize inflation and currency value.
Act as lenders of last resort during crises.
Global Impact
When the Federal Reserve (US) raises or cuts rates, the effects cascade worldwide:
Global investors shift capital.
Emerging-market currencies rise or fall.
Commodity prices fluctuate.
Debt burdens in dollar-dependent nations increase or ease.
Similarly, the European Central Bank (ECB), Bank of England, and Bank of Japan impact global liquidity and yield curves.
In this sense, global finance is not only shaped by markets but by centralized monetary decisions from a handful of powerful institutions.
B. International Financial Institutions (IFIs)
These include:
International Monetary Fund (IMF)
World Bank
Bank for International Settlements (BIS)
Financial Stability Board (FSB)
Their Role in Central Control
1. The IMF
Provides emergency loans, sets macroeconomic rules, and monitors global financial stability. Countries receiving IMF support must often adopt conditions such as:
Fiscal tightening
Structural reforms
Currency adjustments
This creates a form of policy influence over sovereign nations.
2. The World Bank
Finances development projects and shapes the economic policies of emerging markets through program design and conditional funding.
3. The BIS
Known as the “central bank of central banks,” the BIS sets global banking norms through the Basel accords:
Basel I: Capital requirements
Basel II: Risk management
Basel III: Liquidity and leverage rules
These rules unify how banks operate across the world.
4. Financial Stability Board (FSB)
Coordinates global regulators and sets standards for the world’s largest banks and financial institutions.
C. Regulatory and Political Control
Global finance is also influenced by:
Government fiscal policies
Trade agreements
Sanctions and geopolitical decisions
Financial regulations (AML, KYC, FATF rules)
The Power of Sanctions
The U.S., EU, and UN often use financial sanctions to control, punish, or pressure countries.
Sanctions affect:
Banking access (SWIFT restrictions)
Global payments
Trade receipts
Ability to borrow internationally
This highlights how finance becomes a tool of geopolitical influence.
3. The USD-Centric Financial Order
The U.S. dollar is the anchor of global finance:
60% of global reserves
88% of all FX transactions
50%+ of global trade invoicing
This dominance gives the U.S. unparalleled financial power:
It influences global liquidity via Fed policy.
It controls access to dollar clearing.
It sets global borrowing costs.
It can impose financial sanctions with global impact.
In short, the dollar system is a centralized backbone of global finance.
4. Technology and the Future Centralization of Finance
Digital innovation is transforming financial control.
A. Central Bank Digital Currencies (CBDCs)
Many countries—including China, India, the EU, and the U.S.—are researching or piloting CBDCs.
Implications
Real-time monetary policy tools
Greater surveillance of transactions
More control over taxation and fiscal distribution
Potential reduction in cash usage
Cross-border settlement improvements
CBDCs strengthen central authority and expand the scope of financial oversight.
B. Digital Payments & Fintech Networks
Platforms like:
UPI (India)
PayPal
SWIFT gpi
Visa/Mastercard
RippleNet
Crypto exchanges
These networks process billions of transactions daily. While they make finance efficient, they also consolidate control within digital ecosystems.
C. Cryptocurrencies and Decentralized Finance (DeFi)
Crypto represents the opposite of central control:
No central intermediary
Blockchain-based transparency
Peer-to-peer value transfer
However, regulators are increasing oversight on:
Exchanges
Stablecoins
DeFi protocols
On- and off-ramps
This means even decentralized systems are gradually being integrated back into the centrally regulated financial order.
5. The Tension Between Free Markets and Central Control
Global finance operates under constant tension:
Free Market Forces
Capital flows to high-return markets.
Traders respond to price signals.
Currency values fluctuate.
Central Controls
Interest rate decisions
Capital controls
Sanctions
Regulatory requirements
Monetary interventions
The global system depends on maintaining a balance between these forces.
Too much freedom leads to speculative bubbles and crises.
Too much central control restricts innovation and creates financial rigidity.
6. Crises and the Need for Central Coordination
Major financial crises have shown why central coordination is essential:
1997 Asian Financial Crisis
Massive capital flight destabilized multiple economies.
2008 Global Financial Crisis
The collapse of U.S. mortgage markets triggered global recession.
2020 Pandemic Shock
Central banks injected unprecedented liquidity to prevent collapse.
During crises, free markets alone cannot stabilize the system—central intervention becomes indispensable.
7. The Direction of Global Finance Going Forward
The future will be shaped by three trends:
1. Increasing Centralization
CBDCs
Stronger regulatory norms
Coordinated global oversight
Tighter cross-border monitoring
2. Multipolar Financial Power
Rise of China’s yuan
India’s rapid economic growth
Regional currency arrangements
Asian, Middle Eastern, and African financial alliances
3. Hybrid Financial Models
Mix of centralized control (CBDCs, regulations) and decentralized innovation (blockchain, tokenized assets).
Conclusion
Global finance is a vast, interconnected system shaped by markets, institutions, and powerful central actors. Central banks, the IMF, World Bank, BIS, and regulatory bodies exercise significant control over capital movement, banking standards, and financial stability. At the same time, digital transformation—from CBDCs to fintech—will increase central oversight while creating new tensions with decentralized technologies like crypto.
In essence, global finance is both free-flowing and centrally influenced, a system where market dynamics meet institutional power. Understanding this balance is essential to understanding how the world’s economic engine truly works.
Will Nvda crash the AI bubbleThis channel is not providing individualized trading or investment advice, nor is it a banking service, brokerage service, trading service, investment service or money management service

QGEN🌎 Qiagen N.V. is a Dutch holding company and global provider of molecular diagnostics and life sciences solutions.
Core activities:
Sample processing technologies: Extraction and processing of DNA, RNA, and proteins from blood, tissue, and other materials.
Analysis technologies: Preparation of biomolecules for analysis.
Bioinformatics: Software and knowledge bases for data interpretation and practical applications.
Key products and platforms:
QuantiFERON: A test for the diagnosis of latent tuberculosis
QIAstat-Dx: A syndromic testing system for the simultaneous detection of a broad range of pathogens
QIAcuity: A digital PCR system
QIAGEN Digital Insights (QDI): A bioinformatics division
The company serves more than 500,000 customers worldwide in the life sciences (academic institutions, pharmaceutical R&D, forensic medicine) and molecular diagnostics.
In the second quarter of 2025, revenue reached $533.54 million, exceeding the consensus estimate.
The company expects to achieve its mid-term adjusted operating margin target of 31% by 2025, above its initial 2028 guidance.
Management increased its full-year 2025 adjusted earnings per share guidance to approximately $2.35 per year from the previous $2.28.
In 2025, Qiagen received CE-IVDR certification for its entire QIAstat-Dx portfolio in Europe and US FDA approval for the QIAstat-Dx Rise system.
The stock is trading broadly sideways at the upper end of the channel.

CRWV: A patient planCRWV:
.
A patient plan
Will you be patient enough to catch this plan?
.
US STOCKS- WALL STREET DREAM- LET'S THE MARKET SPEAK!

VKTX Is Highly Recommended Stock To Buy!VKTX found strong support on 200 day EMA -- Smacking into and then bouncing off this support zone 3 days in-a-row!
(200 Day EMA = Pink Line)
The Golden Cross recently occurred on VKTX's daily chart (50 day EMA crossed above 200 day EMA), then stock pulled back to find support on the 200 day EMA. Viking Pharmaceuticals, Inc. has an impressive drug development pipeline and is a potential takeover target of a larger pharma company. 15 analysts currently gave an average 12-month price target of $92 for VKTX. This recent pullback is a great opportunity to buy this stock before it takes off!

MSTR still bullish. MSTR bullishness is still intact but it should close above the upper yellow line for the bullishness confirmation intact. If that happens then there's a big possibility that we will see a big sharp last parabolic run to new ATH. Of course this is not financial advised.
If this failed then the last hope is on the Red Line.

TSLA: Get ready...It doesn't get much prettier than this.
Textbook technical set up for some price discovery.
All that's needed is some sort of catalyst (say... FSD expansion warp speed?)
No trade advice. 607 PT.

CIFR | WeeklyNASDAQ:CIFR — Quantum Model Projection
Bullish Alternative — Weekly
As outlined in prior updates, Cipher delivered an outstanding 38.8% rally this week, launching directly🚀 from the apex of the convergent support equivalence lines!
As previously noted, Intermediate Wave (4) completed a decisive retracement into the $14.36 Fibonacci target, settling precisely ➤ at the structural apex.
The model favours an extension into Intermediate Wave (5) within Primary Wave ⓷, projecting an impulsive advance toward ➤ $254.
This target aligns with the confluence of divergent equivalence lines and corresponds to the 1.618 Fibonacci extension derived from the Leading Diagonal of Primary Wave ⓵ — a configuration typically associated with strong bullish continuation patterns.
Overall, the wave structure suggests the uptrend remains firmly intact, with the projected impulsive phase now potentially underway.
🔖 In my Quantum Models methodology, the equivalence lines function as structural elements, anchoring the model's internal geometry and framing the progression of alternate paths.
#MarketAnalysis #TechnicalAnalysis #ElliottWave #WaveAnalysis #TrendAnalysis #FibLevels #FinTwit #TradingView #Investing #CIFR #DataCenters #BitcoinMining #HPC #CryptoMining #CipherMining #BTC #Bitcoin #BTCUSD CRYPTOCAP:BTC NASDAQ:CIFR
#HighPerformanceComputing

MSTR Falls into Major Support—Bounce coming soon??MSTR dropped into major support and printed a bullish divergence, hinting that sellers are exhausted. MSTR & Cryptos are highly correlated, and they look like they're shifting into a quiet accumulation phase after crypto's major correction following the big washout.
Entry: Accumulation on major support 180-150.
SL: if Major support break,.
TPs: 250 → 300
Setup invalid if support breaks.

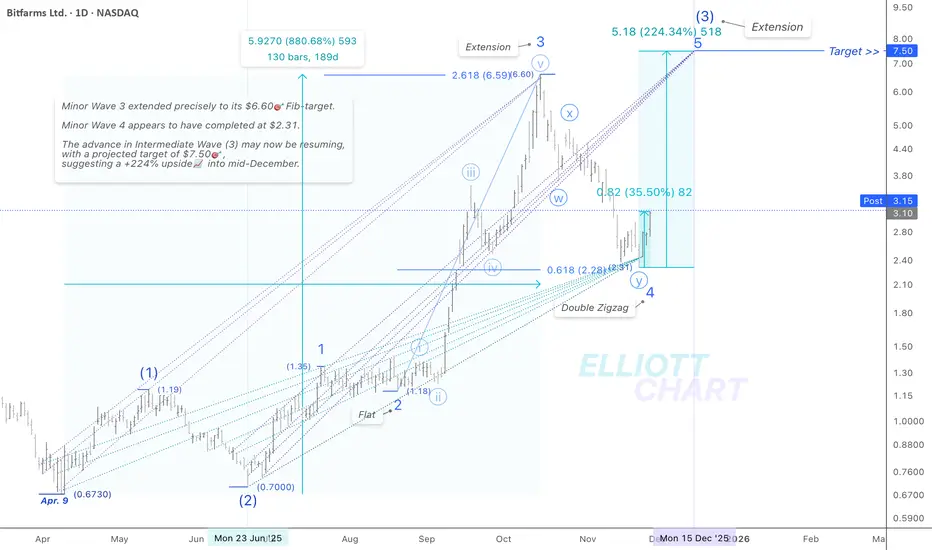
BITF | DailyNASDAQ:BITF — Quantum Model Projection
Technical Update (Daily)
$Bitfarms has surged 35.5%, marking one of the strongest rallies of the week — launching directly🚀 from the apex of the convergent support equivalence lines.
The trend of Intermediate Wave (3) has resumed, progressing through the projected advance of Minor Wave 5. There is no change to the NASDAQ:BITF technical outlook; the near-term bullish structure remains intact.
The advance of Intermediate Wave (3) is expected to re-extend toward the Q-Target ➤ $7.50, representing a total potential upside of +224%📈 by mid-December.
🔖 This outlook is derived from insights within my Quantum Models framework.
#QuantumModels #EquivalenceLines #Targeting #MarketAnalysis #TechnicalAnalysis #ElliottWave #WaveAnalysis #TrendAnalysis #StocksToWatch #FibLevels #FinTwit #Investing #MiningStocks #BITF #Bitfarms #DataCenters #BitcoinMining #CryptoMining #AIStocks #HPC #AI #BTC #Bitcoin #BTCUSD CRYPTOCAP:BTC NASDAQ:BITF
EH Alert: Extreme Bearish Flow + AI Decline EH QuantSignals V3 Earnings 2025-11-26
Instrument: EH
Direction: PUT (SHORT)
Expiry: 2025-11-28 (2 days)
Strike: $14.00
Entry: $0.50 (Range: $0.30–$0.70)
Target 1: $1.00 (+100%)
Target 2: $1.50 (+200%)
Stop Loss: $0.25 (–50%)
Position Size: 2% (reduced due to oversold conditions)
Confidence: 65%
Trend: Bearish
Risk Level: MEDIUM–HIGH
📈 Market Conditions
Options Flow: Extremely bearish – PCR 6.90
Heavy volume at $18 puts → institutional bearish bets
$14P: Delta -0.55, IV 100.1% → elevated volatility
RSI: 5.1 (extremely oversold) → bounce risk, but bearish continuation expected
Light volume → low conviction, requires confirmation
🧠 Why This Trade
Katy AI detailed series shows 5.6% decline starting Dec 1
Earnings miss + post-earnings drift favors downside
$14 strike has best risk/reward with strong delta exposure
⚡ Timing Advantage
Entering immediately after earnings captures the typical post-earnings downside drift
2-day expiry maximizes short-term directional move while minimizing prolonged theta burn
🚨 Notes
Oversold RSI → expect volatility and possible fakeouts
Light volume → watch for confirmation
Katy AI label is neutral, but time-series shows bearish acceleration, aligning with bearish fundamentals + flow

NEBUIS BREAKOUT??The chart shows NBIS trading in a short-term uptrend, the trendline that has been tested multiple times, we are seeing consistent higher lows and strong buyer interest. Price is currently pushing into a major resistance zone at the 200MA, which has acted as a rejection point in the past. There are two potential plays here: a bullish breakout through the 200MA that could open room toward the first target at $102 (T1) and potentially $109 (T2), or a bearish rejection that would likely send price back to retest the ascending trendline and possibly the support levels around $92–$90. Volume has tapered during the pullback(Holiday week) suggesting consolidation rather than selling pressure. Overall, the chart reflects a decisive moment where price must either break above resistance to continue the uptrend or fail and return to support.
Let me know what you think!

ttd almost time this is a quick update on ttd we have a solid support at a physiological 30.00 as soon as i see a reversal on the smaller time i will immediately update you note: after a rally of an incredible 6000% we now have been consolidating for nearly 2000 days it is now finally coming down to support at the 0.786 fib level from the high we have drooped 70% and still have a potential 20% drop to go before i expect a reversal

$ANET: AI Stock with major drawdown. Opportunity or bull trap. Arista Network is one of my favourite AI stocks within the networking and cybersecurity space. NYSE:ANET is a momentum stock and has given some handsome returns to its investors. NYSE:ANET give investor exposure towards the AI, Networking and the Data Center boom with a tilt towards Cybersecurity. This versatility of the stock makes its interesting for the investors.
On 11th of Aug, I said in my blog post that NYSE:ANET is in a price discovery mode and can touch 210 $ before any meaningful correction.
NYSE:ANET : Breakout candidate in price discovery mode. for NYSE:ANET by RabishankarBiswal — TradingView
I was directionally correct but pricewise wrong. NYSE:ANET topped out @ 165 $ and since then it has a 30% downturn in its stock price. Currently sitting @ 117 $ it is just @ 0.786 Fib retracement level on the daily chart shown below. At this price level we can see major support and resistance which makes this price level very interesting. With RSI of 22 it is as oversold as the Liberation Day lows. Hence, I think the stock is ripe for a bounce back from these levels.
Trade Set Up: NYSE:ANET with RSI of 22 is oversold. Major upside can be expected form here. Next price level should be above 175 if the long-term bullish momentum must persist.

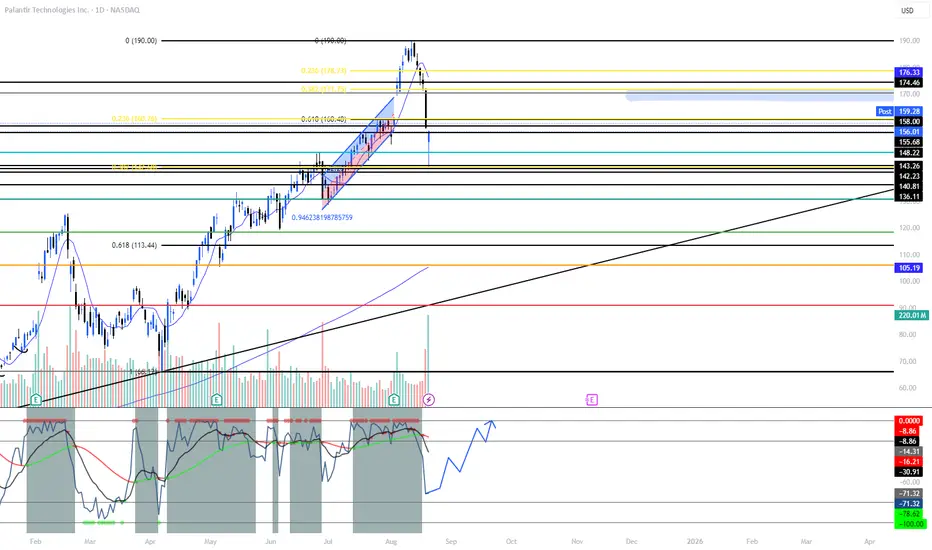
PLTR: This Drop ≠ February — Setup for 200+PLTR’s August dip looks nothing like February’s correction. In Feb, price unwound ~30% after insider-sale headlines + gov-spend fears and flushed to the 0.618 retrace, breaking key MAs. This time, the selloff paused at shallow fibs (0.236–0.382), held stacked support ($156 → $148 zone), and buyers stepped in before any trendline/50-DMA break. The catalyst is mostly valuation chatter, not fundamentals. With structure intact, a quick V-shape reclaim is on the table if we clear resistance levels in sequence.
What I’m watching
- Hold above $156 and build higher lows over $158 → momentum base.
- Trigger: reclaim $171.75 (0.382), then $178.7 (0.236) to re-ignite trend.
- Acceptance back over $186–$190 (prior ATH area) opens the 200s.
Why this isn’t Feb
- Depth: Feb = deep 0.618 wash; Aug = shallow 0.236/0.382 tag.
- Structure: Feb broke MAs/trend; Aug holds channel + MAs.
- Narrative: Feb = fundamental risk headlines; Aug = valuation noise while demand pipeline stays active.
Price Targets
- 171.50
- 178.70
- 186 - 190
- 205
- 217 - 235
Not financial advice.
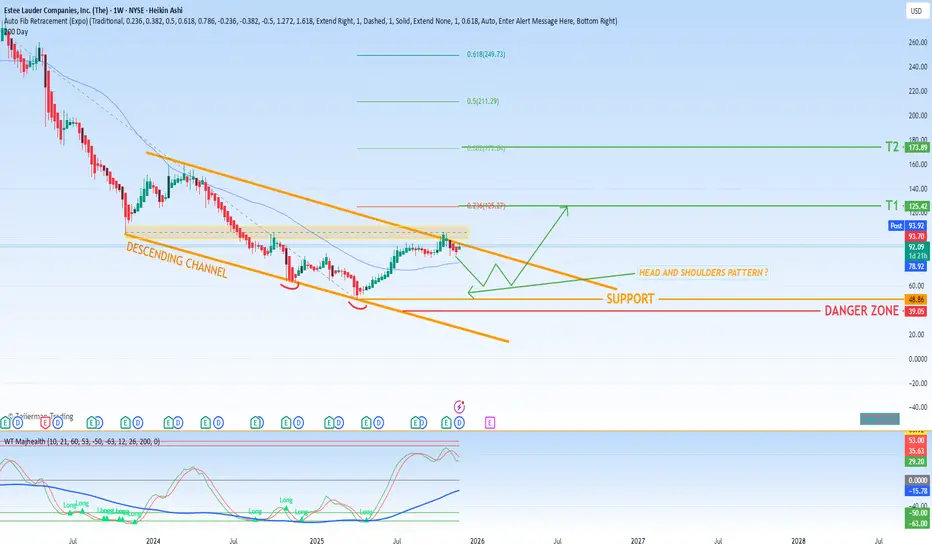
$EL Navigating a Technical Juncture Amidst Fundamental CatalystsEstee Lauder (EL) is currently at a fascinating technical crossroads, presenting a scenario with defined risks and a compelling potential reward structure. The stock is showing early signs of a potential trend reversal, making it one to watch closely as it approaches its next earnings catalyst.
From a fundamental standpoint, the company is positioned ahead of its upcoming earnings report on February 3, 2026. Currently, EL holds a Zacks Rank #3 (Hold). More notably, its Earnings ESP (Expected Surprise Prediction) stands at +1.09%. This figure, derived from the difference between the Most Accurate Estimate of $0.82 per share and the Zacks Consensus Estimate of $0.81, indicates a slight but positive bias toward an earnings beat. While not a dramatic catalyst in itself, this positive skew adds a layer of fundamental support to the technical picture.
The technical landscape is where the most compelling narrative unfolds. The prolonged descending channel that has characterized EL's price action for some time is showing clear signs of dissolving. This breakdown of the previous bearish structure is the first critical step toward a potential new bullish phase.
As this channel dissolves, a significant and classic reversal pattern appears to be emerging: a head and shoulders bottom. This pattern, if it completes, is one of the most reliable technical indicators of a major trend reversal from down to up. The formation of this pattern is a highly significant development that merits close observation for a confirmed breakout above the "neckline."
Within this context, the key price levels are clearly defined:
The Danger Zone: The most critical support level rests at $40. A sustained break below this level would likely invalidate the nascent reversal pattern and signal a resumption of the broader downtrend, making it a clear line in the sand for the bullish thesis.
Primary Support: A stronger, more immediate support floor is established at $50. This level has historically acted as a battleground between buyers and sellers and is crucial for maintaining the integrity of the potential head and shoulders formation.
On the upside, should the reversal pattern complete and a new bullish trend initiate, the Fibonacci extension tool provides clear profit-taking objectives:
First Take-Profit Target: The initial target is projected at the 0.236 Fibonacci level, which corresponds to $125.27. This represents a significant resistance zone and a logical first objective for a new bullish impulse wave.
Second Take-Profit Target: A more ambitious, secondary target is set at the 0.382 Fibonacci level, at $172.84. A move to this level would confirm a powerful and sustained recovery, potentially marking a return to prior highs.
Adding an interesting backdrop, recent news highlighted the sale of a Gustav Klimt portrait from the collection of Leonard Lauder, the company's heir, for a record $236.4 million. While not directly impacting the stock's valuation, this event underscores the immense underlying value and legacy of the Lauder family, providing a subtle reminder of the brand's enduring prestige.
In summary, Estee Lauder (EL) is teetering on the edge of a major technical reversal. The dissolution of the descending channel and the potential formation of a head and shoulders bottom pattern suggest that the prolonged downtrend may be exhausting itself. While the $40 level remains a critical danger zone, a successful hold above support at $50 could pave the way for a significant rally toward the $125 - $173 range in the medium to long term.
UMAC QuantSignals V3: Contrarian Put Play – Bearish Momentum AheUMAC QuantSignals V3 Weekly 2025-11-26
Recommended Strike: $8.00
Entry Price: $0.55
Target 1: $0.90 (≈ 64% gain)
Target 2: $1.20 (≈ 118% gain)
Stop Loss: $0.30 (≈ 45% risk)
Expiry: 2025-11-28 (2 days)
Position Size: 2% of portfolio
Confidence: 58%
Weekly Momentum: BULLISH (+1.56% 1W) – note: conflict with Katy AI bearish prediction
Flow Intel: Neutral
Risk Level: HIGH – low Katy confidence (50%) + conflicting weekly momentum + short expiry
Key Technical Levels:
Resistance: $8.70
Support: $7.25
VWAP: $7.98
Katy AI Predicted Move: -8.32% to $7.33–$7.73 range
Conflict: Katy predicts bearish puts while LLM guidance favors calls
Timing Advantage: Price at 88.5% of weekly range; short-term decline expected; mid-week entry captures potential trend exhaustion.
Notes:
Tight stop relative to Katy’s stop level $8.58
2-day expiry requires precise timing
Trade contrarian to weekly bullish guidance, follow Katy’s AI prediction
Monitor updates closely; consider reducing position size due to conflict

Micron just keeps moving - long at 235.48MU is a stock I forget about easily and am always mad when I rediscover it and wish I had been trading it. Memory prices are up 160% in the last MONTH and in a market gasping for good earnings, it's a safe bet they will deliver in the near term, at least.
It caught my eye because it is one of only a handful of mega cap stocks that is trading above its 20, 50 and 200d MAs. I think that despite its "overvaluation", mega cap is mega for a reason. They have the earnings to justify their mega status.
MU is in a really strong uptrend right now that began in early September, but is short term under a lot of pressure over the last couple of days. This has created a situation that has produced a winning trade in 2 days or less 13 of the last 15 times it has occurred, and the 2 times it didn't produced wins of 2.1% and 2.5% that just took longer (17 and 5 trading days, respectively) but on a per day held basis, even those handily beat the market.
I am looking for a quick rebound trade here, hopefully one of the one or two day variety. If longer, I will add if necessary and sell tactically until the original lot is sold profitably.
As always - this is intended as "edutainment" and my perspective on what I am or would be doing, not a recommendation for you to buy or sell. Act accordingly and invest at your own risk. DYOR and only make investments that make good financial sense for you in your current situation.

ORCL QuantSignals V3: Market Watching – Awaiting Breakout!ORCL QuantSignals Katy 1M Prediction 2025-11-26
Direction: (Neutral)
Current Price: $205.07
Final Prediction: $205.38 (+0.15%)
30min Target: $205.76 (+0.34%)
Trend: Neutral
Confidence: 40.0%
Volatility: 48.9%
Trade Signal Generated: ❌ None (insufficient confidence/move size)
Summary:
Katy AI predicts a very small move, so no active call or put recommendation.
The stock is essentially in a neutral stance for the short term.
No entry, target, or stop-loss levels are suggested.
