Will Verizon (VZ) Extend Higher After This Bullish Pullback?📊 VZ — Bullish Pullback Playbook | NYSE Swing Strategy 🛡️📈
🧠 Market Thesis
VZ (Verizon Communications Inc.) is showing a clean bullish pullback setup supported by:
✔️ Moving Average Pullback Confirmation
✔️ Re-Accumulation Zone Formation
✔️ Buyers regaining strength and stepping back in with momentum
Price behavior shows buyers dominating key levels, keeping the trend constructive and ready for continuation 📈💪
🎯 Entry Plan
🔓 Entry: Any valid price-level confirmation entry based on your strategy.
(Everyone has their own method — trade what fits your risk profile.)
🛑 Stop Loss
⚠️ Stop-Loss: “Thief SL” @ 39.00
(This is a personal reference point only. Not a recommendation — manage risk your way.)
🎯 Target Zone
🚓 Target: “Police force waiting at the Triangular Moving Average Barricade”
— A zone acting as strong resistance, combined with:
Overbought signals
Possible liquidity trap
Sellers waiting to react
📌 TP Level: 43.00
(Again — personal target. Trade responsibly and exit at your comfort level.)
📝 Notes to All Ladies & Gentlemen (Thief OGs)
I am not recommending you follow my SL or TP.
Your money → your rules → your trade → your responsibility 💼📌
This is a thief-style trading narrative made for fun, not financial advice.
🔎 Correlated Assets / Related Pairs to Watch
Keeping an eye on correlated telecom + defensive sector tickers strengthens conviction:
📡 $T (AT&T)
Moves similarly to VZ due to shared telecom sector flows
Similar defensive-sector inflows during risk-off periods
Can confirm or warn about momentum shifts
📶 NASDAQ:TMUS (T-Mobile)
Sometimes inversely reacts when capital rotates between telecom competitors
Relative strength comparison helps spot leadership shifts
🏦 AMEX:XLC (Communication Services ETF)
Sector ETF that often amplifies or confirms directional bias
Watching ETF flows helps validate whether buyers truly control the space
🧲 Key Correlation Notes:
Telecom sector = slow, steady movers with defensive qualities
When VZ, T, and XLC all align → trend continuation signals strengthen
Divergence between these pairs may warn early about losing momentum
🚀📈 Final Thief-Style Summary
We have a confirmed bullish pullback, re-accumulation strength, and a clear resistance barricade for TP planning.
Trade safely, protect profits, and don’t get caught by the “police” at resistance 🚓😂🔥
✨ “If you find value in my analysis, a 👍 and 🚀 boost is much appreciated — it helps me share more setups with the community!”
⚠️ Disclaimer
This is a thief style trading strategy just for fun.
Not a recommendation, not financial advice — purely educational and entertainment-oriented.
#VZ #Verizon #SwingTradeSetup #BullishPullback #TradingPlaybook #StockAnalysis #NYSE #MarketStructure #Reaccumulation #TelecomStocks #XLC #ATT #TMUS #ThiefStyleTrading #RiskManagement #ChartAnalysis #EditorsPickHunt

LULU Analysis | Crucial Support & Resistance Before EarningsIn this video, I break down a complete Lululemon (LULU) stock analysis ahead of its upcoming earnings.
You’ll learn the key support & resistance levels, expected volatility zones, and the technical signals that matter most.
🔍 What’s Inside the Video:
Lululemon’s current trend & momentum
Technical breakdown (chart pattern + volume + indicators)
Key support & resistance levels to watch
Earnings expectations & potential price reactions
Upside and downside targets
Risk zones and invalidation levels
Short-term and swing-trade ideas
📈 Why This Matters
LULU earnings often create huge price swings.
This video gives you a clear, actionable view of how the stock might react and what levels traders should focus on.

$UPST- A Black Friday SpecialUpstart chart is simple.
Channel held. Interest rates will continue to fall and will increase Upstart revenue. The effects of the interest rates will lag so it will take 3-6 months for the stock to reflect in price.
Targets:55,87, and 112
Time to final target: end of Q1 2026/ early Q2 2026
#SPY #QQQ #interestrates #financial

TSLA — Bullish Above 317.77, Targeting 544.53TSLA maintains a bullish structure as long as price holds above the key zone at 317.77.
This level represents the foundation of the current upward leg and serves as the invalidation point for the broader trend. As long as buyers protect 317.77, upside continuation remains the dominant scenario.
Price is currently reclaiming the 0.5 Fibonacci level at 424.43. A sustained close above this area strengthens bullish momentum toward 452.77 (0.618), followed by 472.47–484.48 (0.7–0.75). A breakout above these mid-range levels would open the path toward the major extension target at 544.53.
In a bearish scenario, price cannot break above the key support zone; any rally into it while trading below would be considered only a corrective bounce.
But as long as 317.77 holds, the primary outlook remains bullish.

MSTR Could Be Forced Out of MSCI — Here’s What That Means📌 Chart Overview
This chart compares MicroStrategy (MSTR) vs Bitcoin (BTC) on a YTD returns basis.
After several years of extreme outperformance, 2025 marks the first major divergence in years:
BINANCE:BTCUSDT YTD: about –4%
NASDAQ:MSTR YTD: about –41%
From highs: MSTR trades ~–63%
This is the widest decoupling in the last cycle, and it reflects a structural break in how the market prices MSTR.
1. MSTR = Leveraged Bitcoin With Higher Beta
For years, MicroStrategy acted as a leveraged Bitcoin proxy:
Higher beta than BTC
Equity issuance used to buy more BTC
mNAV premium amplified upside moves
Investors treated it like an ETF with embedded leverage
When BTC rallied, MSTR rallied even more.
That dynamic is now reversing.
2. The mNAV Premium Has Collapsed Into Discount
The second chart (mNAV Analysis) tells the real story:
Historical mNAV premium: often 1.5x–3.5x
Current levels: ~1.46x, falling toward 1.0x
In recent weeks, intraday prints have even touched discount territory (<1.0x)
This is critical:
➡️ MSTR only outperforms BTC when it trades at a premium to NAV.
When that premium evaporates, the “leveraged BTC” thesis breaks.
Today the market is pricing:
Higher risk,
Lower confidence,
Reduced ability to issue accretive equity,
And potential forced selling due to MSCI.
The entire flywheel depends on that premium — and it’s now gone.
3. The MSCI Catalyst: A Binary Structural Event
MSCI is reviewing whether companies with >50% digital asset exposure should remain in:
MSCI World
MSCI USA
MicroStrategy fits the proposed category perfectly:
➡️ Digital Asset Treasury Company
➡️ Balance sheet ~70% BTC
Decision date: January 15, 2026
If excluded:
Forced selling: ~$2.8B
Potential cascade: up to $8.8B
Equivalent to 15–20% of MSTR’s market cap
These outflows are mechanical, not discretionary.
4. Liquidity Risk: The Hidden Problem
The October 10th BTC drop exposed MSTR’s fragility:
~17% BTC drop
~90% liquidity evaporation in MSTR’s order book
Thin depth for a company of this size
Large block orders cause outlier moves
If MSCI-related outflows hit in a volatile period,
MSTR may not have enough liquidity to absorb multi-billion flows.
This is not a solvency problem — it’s a market microstructure problem.
5. The Paradox: While Risks Rise, MSTR Keeps Buying
Recent actions:
Purchased 8,178 BTC (~$830M)
Issued five BTC-backed structures this year
Continues using financing to expand BTC exposure
Saylor reiterates resilience even under 75–90% BTC drawdowns
If MSCI does not exclude MSTR, the stock could stage a violent rerating
because the market has already priced in significant downside risk.
6. Key Takeaways
MSTR has decoupled sharply from BTC in 2025
The mNAV premium has collapsed, removing its leveraged upside
MSTR now trades near or below NAV, losing its structural advantage
MSCI’s January decision is the defining catalyst
If excluded → forced selling
If retained → high-beta rebound potential
MicroStrategy is no longer just a BTC proxy.
It is now a test of:
Index methodology,
Market microstructure,
Capital-structure engineering,
And whether a listed company can operate as a quasi-ETF on Bitcoin.

Amazon 🎯 Key Levels & Risk Management
Critical Support: $215 or the Year-To-Date (YTD) Anchored VWAP. These levels must hold to maintain the bullish structure.
Stop Loss: A close below $215 invalidates the long thesis.
Bullish Target/Flow: Huge institutional interest observed with $250 Calls (May '26)—over $10M in premiums hit the tape this week.
📉 Technical Analysis & Price Action
Trendline Defense: The stock hit a "crossroads" of trendlines but ultimately managed a bullish close above the rising trendline.
Gap Fill: The daily chart successfully closed the previous Earnings Run (ER) bull gap last week.
Moving Averages: Significant overhead supply exists. Bulls have heavy lifting to do to reclaim key Moving Averages (KMAs) on multiple timeframes following last week's sell volume.
📊 Market Context
Relative Performance: It is shocking to see NASDAQ:AMZN still net negative YTD, suggesting it is lagging significantly behind the broader market/Magnificent 7.
Risk/Reward: Given the defined stop at $215 and the upside lag, the R/R ratio is highly favorable for a long position.

SNAP is HATED!BUT this monthly candle looks like it's sitting on the launch pad! Let's see if santa can bring us a present next month!

How to Use Simple Moving Averages (SMA) to Predict Price TargetsIn this video, you’ll learn exactly how to use the Simple Moving Average (SMA) to find both short-term and long-term price targets.
I explain which SMA settings work best, how to spot trend direction, and most importantly:
When you should take a trade and when you should stay OUT of the market to avoid losses.
What You’ll Learn:
How the Simple Moving Average works (SMA 9, 21, 50)
How to use SMA for short-term and long-term price targets
Best SMA crossover strategies
When to enter a trade using SMA
When to stop trading / avoid traps
How institutions use SMA to set levels
Tips to improve your accuracy and timing

AAPL Stock: 1-Week Trade Setup | Key Levels explainedIn this video, I break down a complete 1-week trade opportunity for AAPL (Apple Inc.) using technical analysis. We look at chart pattern formation, MACD signals, and important support/resistance levels to track. I also provide a clear entry zone, stop-loss placement, and potential upside targets for short-term traders.
Current AAPL chart pattern forming
MACD crossover and momentum analysis
Key support & resistance levels
My entry plan, stop loss, and target zones
Short-term outlook for the next 5 trading days
Risk management tips for Apple stock
📌 Why watch this?
If you’re planning a 1-week trade on AAPL, this video gives you a data-driven plan with clear technical signals.

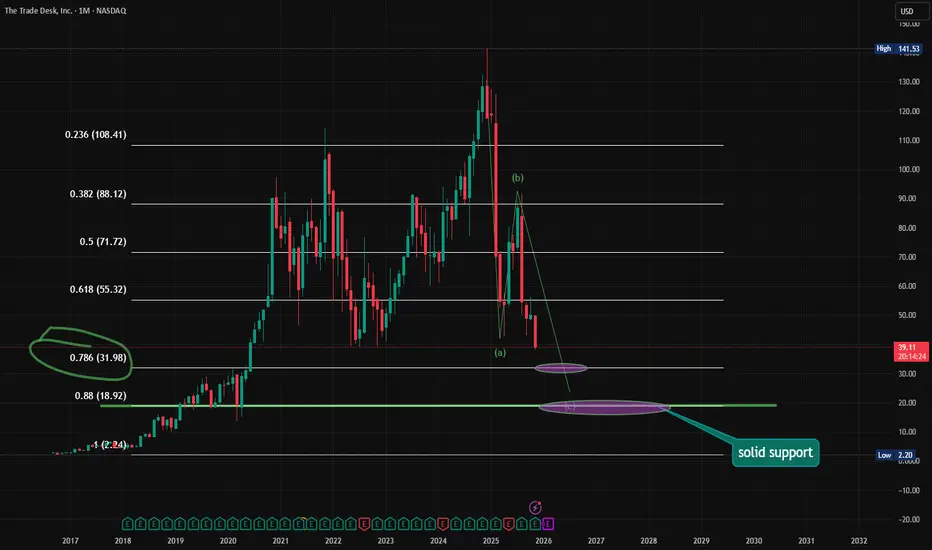
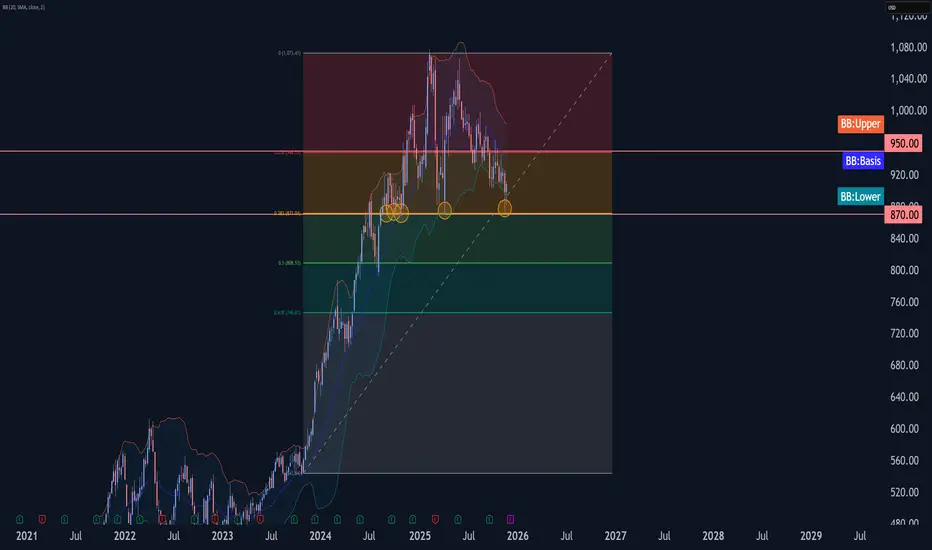
Costco Wave Analysis – 27 November 2025
- Costco reversed from support level 870.00
- Likely to rise to resistance level 950.00
Costco recently reversed from support area between the support level 870.00 (which has been reversing the price from July of 2024), lower weekly Bollinger Band and the 38.2% Fibonacci retracement of the upward impulse from 2023.
The upward reversal from this support area stopped the previous weekly impulse wave C of the long-term ABC correction (2) from May.
Given the strong multi-year uptrend, Costco can be expected to rise to the next resistance level 950.00.
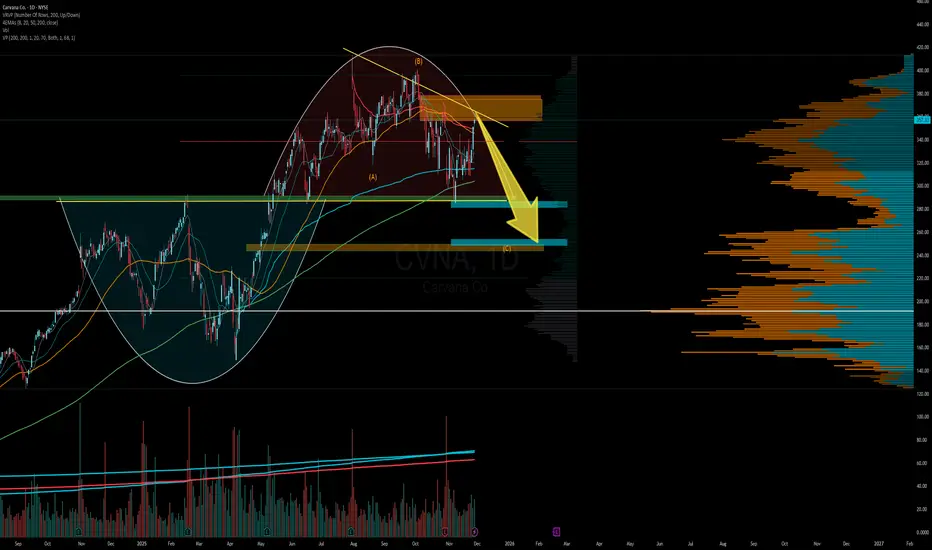
CVNA - Obvious but not so obvious because it's very obvious Every trader knows CVNA is Sh#t Co but not much success shorting it for many of us.
Probably this may work now if broader market corrects here.
Short Entry anywhere between 380-350
Target 1 - 280
Target 2 - 250
Stop loss - 385
Prefer to options spreads or credit spreads rather than puts.
Confluences -
-Below anchored VWAP
-Below 50 EMA
-Volume gap below 320 upto 250
NVDA vs. The Narrative: Why I’m Holding Through the NoiseWhile headlines scream "bubble" and Michael Burry loads up on short positions, I’m doubling down on what the charts are actually saying — not the fear-based narratives. This post is for those who trust price structure, volume psychology, and timeframe alignment over media noise. Let’s dive in.
Chart Structure Speaks Louder Than Opinions
Across all timeframes — from 4H to 6M — NVDA and the broader S&P are forming morning star dojis, a powerful reversal signal. These candles are whispering accumulation. Retail isn’t listening. Smart money already has.
Key Observations:
SPY & SPXL (S&P 500 ETFs): Forming higher lows with bullish fib retracements holding tight. No sign of weakness, despite Burry’s apocalyptic tone.
NVDA (NASDAQ):
The 6M chart shows clear magnet zones at 212 and 392.
An unfilled liquidity gap from the 390s is now acting as a gravitational pull — price will revisit it.
Every timeframe confirms this momentum is building for a breakout, not breakdown.
NVDA/USD Confluence: Mirrors the NVDA/NASDAQ structure almost 1:1. This correlation across instruments adds major conviction to the thesis.
Psychology Check: Why I Disagree with Michael Burry
Burry may be shorting because of macroeconomic risk. Or, maybe he’s playing the same game Melvin Capital did — betting retail will panic.
But I believe he’s underestimating the AI revolution, semiconductor demand, and the market’s memory of missed upside in prior decades.
The dot-com boom had hype, yes — but this has utility. AI isn’t a buzzword anymore. It’s infrastructure. And NVDA is at the core.
Liquidity will return. The market will wake up. And those who held the line will reap the rewards.
Final Words:
The media lies. Liquidity hides. But candlesticks don’t fake structure.
If NVDA fills its liquidity magnet, hits prior highs, or simply rides the S&P's tide — the upside is mathematically undeniable.
To those holding — congratulations.
To the bears — good luck.
To Burry — you might be early, but you might also be wrong.
- MoNí

GME Character LoopIn my other post I’m tracking GME’s big harmonic roadmap – here I’m zooming in on the story 'how price keeps acting along the way'.
On this chart I’ve marked the recurring “character loop”:
red double tops → red strong zigzag dumps → purple rounding tops inside demand zones → big upside legs.
You can see that script play out more than once: top out, dump hard into demand, carve a rounded base, then bang.
Right now we’ve just had another double top and sharp dump, and price is sitting in the upper green demand zone around the macro 0.618 support. I’ve marked a new potential purple rounding zone here, with a lower green box + “Rounding Top ????” as the next possible stage if this one fails.
I’m basically combining two views:
the harmonics as a possible macro roadmap
this repeating behaviour as the way GME often travels between those zones.
If buyers step in and we see that familiar rounding + push, it fits both stories. If this 0.618 cluster gives way, the script changes and the lower box comes into play.
Just mapping GME story behaviour and seeing if it stays in character.

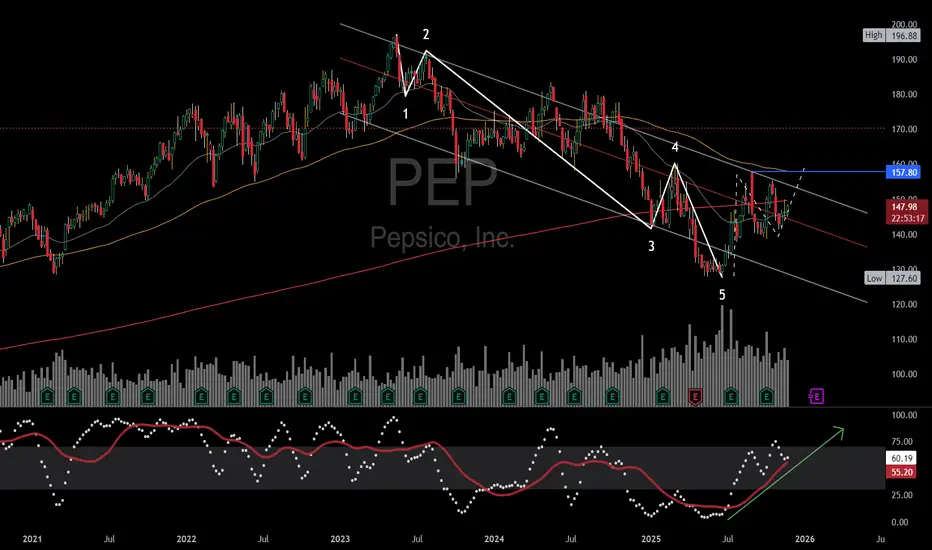
PEP Wave Analysis: The OverviewPepsiCo has been declining for the last 2 years. The impulse pattern down to a 5-year support level was influenced by higher interest rates; comparing PEP to the US10Y will show this relationship. I remember "Higher-for-longer" being the main idea behind the 3rd wave down, and we saw that pin, in the 5th wave, at a large support level with a strong reaction.
My initial thesis was $170 and I still believe that to be a large inflection point. I am looking for daily closings above the 157.8 pivot for a longer hold towards $170.
I added the Stochastic indicator to represent the divergence in price to momentum. Getting above the upper trend line (about $154) will open the door to the 120ema (sourcing the highs).
The 400sma (red line) shows the dominant trend is still upwards. Price has traded beneath this moving average for some time. It looks like a Head & Shoulders pattern is forming around this longer-term support level. A weekly close above the wave 4 pivot high can activate a thrust into the larger consolidated range.
2026 will prove to be an important year for cyclicals, in my estimation.
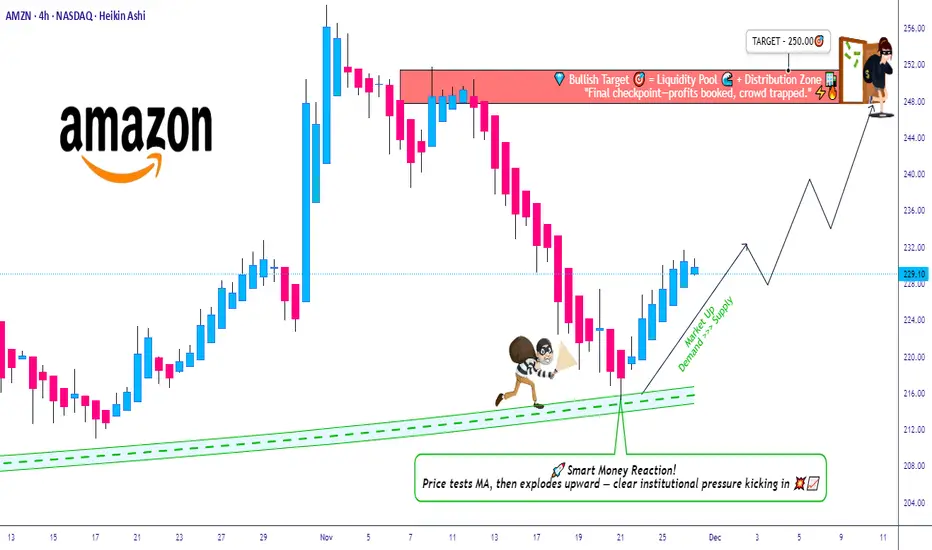
AMZN Breakout Reload? TMA Pullback Shows Buyer Strength🔥 AMZN Swing Trade Profit Playbook | Bullish Pullback + Thief Layering Strategy 🟢📦
Welcome back, Ladies & Gentlemen — the Thief OG’s 😎🕵️♂️
Here’s a polished, rule-friendly breakdown of the bullish setup developing on AMZN (Amazon.com Inc.) – NASDAQ.
📌 Market Context
AMZN is showing a clean bullish pullback into the Triangular Moving Average (TMA) zone, supported by a Heikin Ashi Doji Reversal, signaling that buyers are gaining strength and attempting to dominate momentum again. 📈🔥
🧠 Trade Plan (Swing Trade)
Plan:
A bullish pullback strategy confirmed by:
🔺 Triangular Moving Average pullback reaction
🟩 Heikin Ashi reversal-doji indicating potential trend continuation
📊 Buyers stepping in with momentum recovery
🎯 Entry Plan – Thief Style Layering (Multiple Limit Orders)
This is the famous Thief Strategy — using layered limit orders to scale into the move like a master of stealth 😎🕵️♂️💼
(TradingView-safe version: purely educational, optional, trade at your own risk.)
Layered Buy Limits:
🟢 215.00
🟢 220.00
🟢 225.00
🟢 230.00
(You may increase or adjust layers based on your own style and risk tolerance.)
🛑 Stop-Loss (Thief Style Educational Version)
SL Zone (Optional):
❌ 210.00
⚠️ Note: Dear Ladies & Gentlemen (Thief OG’s), this level is NOT a recommendation — it’s just part of the thief-style educational breakdown.
Choose your own risk plan, trade your own analysis.
🎯 Target Zone
The “Police Force” 🚓 — aka strong resistance, potential overbought zone, and liquidity trap area — sits around:
🟡 Target @ 250.00
⚠️ Note: Dear Ladies & Gentlemen (Thief OG’s), this is NOT a fixed TP recommendation.
Manage your profits as per your own risk appetite and strategy.
📡 Related Pairs to Watch (Correlation & Market Behavior)
Watching correlated tickers helps understand broader tech-sector sentiment and liquidity rotation.
Here are the key names to keep an eye on:
📌 NASDAQ:AAPL (Apple Inc.)
Strong correlation with AMZN in tech-momentum cycles.
When AAPL shows bullish continuation, AMZN often follows with similar pressure.
📌 NASDAQ:META (Meta Platforms Inc.)
Tracks consumer-tech spending sentiment.
Strong META moves can hint at acceleration across NASDAQ growth stocks.
📌 NASDAQ:MSFT (Microsoft Corp.)
A heavyweight pillar in NASDAQ.
MSFT strength boosts overall tech-index bullish bias.
📌 NASDAQ:QQQ (Invesco NASDAQ-100 ETF)
The main sentiment gauge.
If QQQ remains above its trend structure, AMZN's bullish continuation gets stronger confirmation.
📌 NASDAQ:TSLA (Tesla Inc.)
Not directly correlated, but impacts NASDAQ volatility dynamics.
High volatility in TSLA often ripples into liquidity behavior across the index.
💬 Final Thoughts
This AMZN setup blends structure, momentum, and multi-layer entries, crafted in a fun Thief-style teaching format while keeping everything compliant and research-focused 📚✨
Trade smart, manage risk, escape with profits when the “police” show up 🚓😆📈
✨ “If you find value in my analysis, a 👍 and 🚀 boost is much appreciated — it helps me share more setups with the community!”
⚠️ Disclaimer
This is a Thief-style trading strategy presented just for fun & educational purposes only.
Not financial advice. Do your own analysis and manage risk responsibly.
#AMZN #Amazon #SwingTrade #NASDAQ #BullishSetup #PullbackStrategy #HeikinAshi #TriangularMovingAverage #ThiefStrategy #LayeringEntries #TradingEducation #StockMarket #MarketAnalysis #TradingViewCommunity #EditorPickReady 🚀
ALL-IN NOVO!!!We have reached a significant demand zone from which we shall accumulate some buy orders. Expecting this stock to turn around from this zone and break into new all-time-highs.

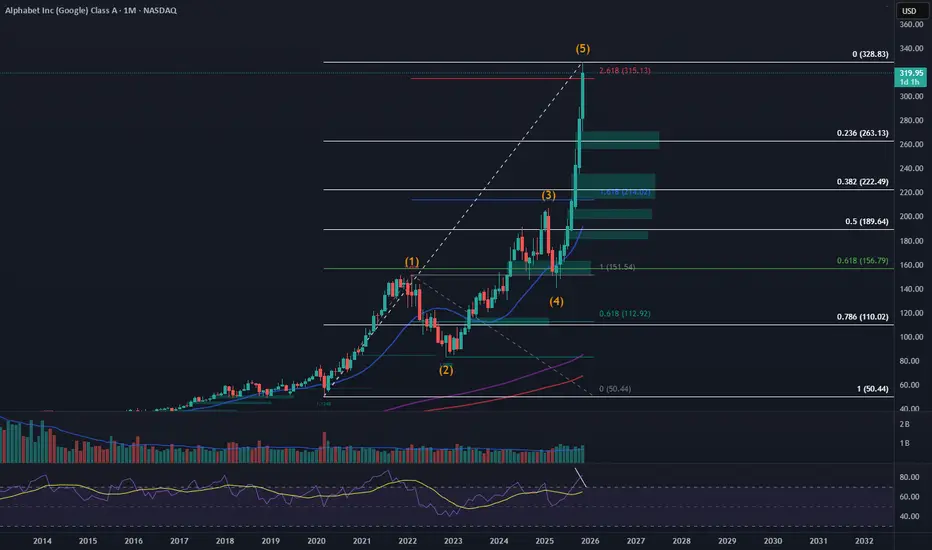
Alphabet (GOOGL) – Completing a Major Elliott Wave Cycle at 2.61Alphabet has reached the 2.618 Fibonacci extension of the entire macro impulsive structure, marking a potential completion of Wave (5) on the monthly timeframe. Price extended aggressively from the Wave (4) low and is now interacting with a historically significant Fibonacci exhaustion zone.
RSI also shows signs of potential macro divergence in daiy timeframe.
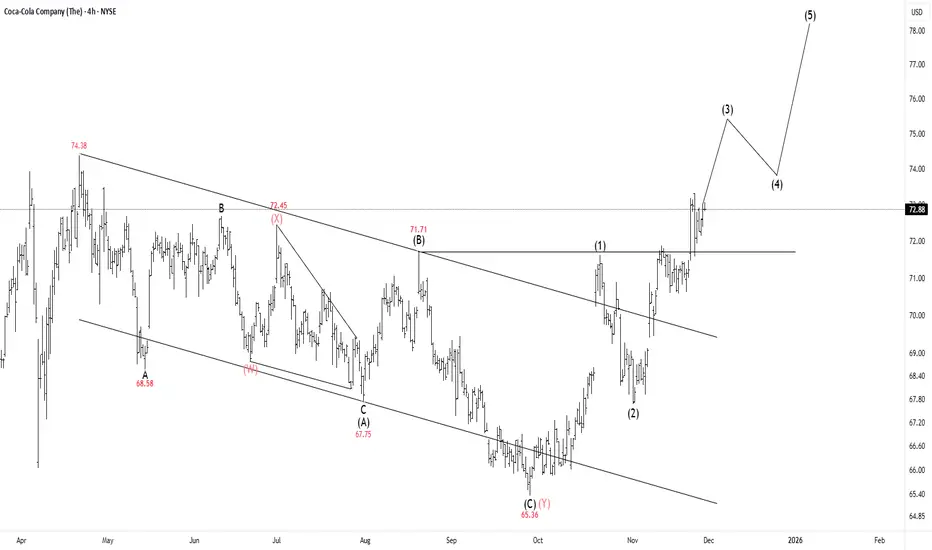
Coca Cola - $78 Target for New Highs Imminent 🥤The Coca-Cola Company (KO) suggests the stock has definitively finished a long period of price correction and is now ready for a significant upward trend. This pullback, which had been complex, officially concluded when the price hit its low at $65.36. Critically, the strong bounce that followed has broken the stock out of its long-term downward trading range, confirming that the selling phase is fully over.
Following this successful breakout, the chart indicates that a major new five-wave rally is starting, with the stock currently engaging the powerful middle part of this upswing (Wave 3). The analysis projects that after completing this rally, the price will ultimately reach a target around $78.00. This suggests that the stock is now in a strong phase of growth, making it a key focus for traders looking for the next major increase in value.
Stay Tuned!
@Money_Dictators
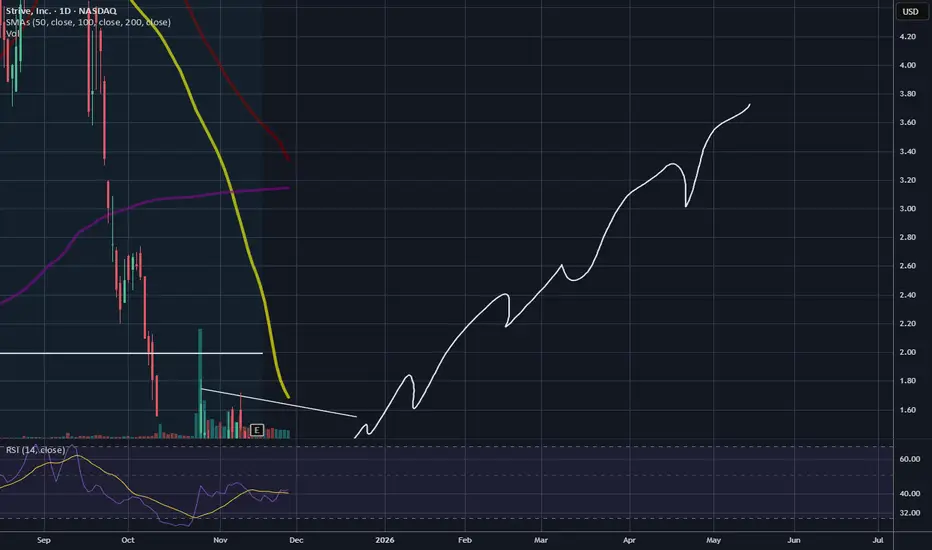
ASST (Strive) - A novel idea with explosive growth potential******DYOR - if Bitcoin price collapses, so will this stock play!******
1. The Bitcoin "War Chest" (The Numbers)
Strive has already accumulated a significant Bitcoin treasury. As of their most recent disclosures (November 2025), the numbers are substantial:
Total Holdings: Approximately 7,525 BTC. (Merger with Semler Scientific will add another 5,000
BTC when finalized).
Valuation: At current market prices (~$90.5k/BTC), this treasury is worth over $681 million.
The Strategy: They explicitly state their goal is to maximize "Bitcoin per share"—the exact metric MicroStrategy (MSTR) uses to judge its success. They view Bitcoin not just as an asset, but as the "hurdle rate" for all their capital allocation decisions.
2. The "Tax-Free" Twist (The Section 351 Exchange)
This is the unique financial engineering that likely attracted Jane Street. Strive is attempting something MicroStrategy has not done: a tax-free Bitcoin-for-Equity swap.
How it works: Under Section 351 of the U.S. tax code, investors sitting on massive unrealized gains in Bitcoin can "swap" their BTC for shares of Strive (ASST) without triggering an immediate capital gains tax event.
Why it matters: There are billions of dollars in "stranded" Bitcoin held by early adopters who don't want to sell because of the tax hit. Strive offers them a way to diversify into a public equity structure without the tax penalty.
The Arbitrage: For a firm like Jane Street, this unique structure creates complex arbitrage opportunities between the stock price, the Bitcoin price, and the tax value of these swaps.
3. Vivek Ramaswamy’s Role
Vivek Ramaswamy is the co-founder and largest individual figurehead, but his official role has shifted due to his political ambitions.
Official Status: He is not currently the Chairman or CEO (that role belongs to Matt Cole, a former portfolio manager at CalPERS). Vivek resigned his chairmanship in 2023 to run for U.S. President.
"Insider" Confidence: Despite not being on the board, he remains deeply financially committed. He recently disclosed a personal purchase of $1.25 million in preferred stock, signaling to the market that he is betting his own money on this pivot.
****Side Note: Prominent investor Mike Alfred has also increased his shares of ASST to 1.9 million, adding another 50k at $1.06 on 11/26/2025. Follow him at x.com/mikealfred - he posts all his buys and sells ******
Political Context: Vivek is widely expected to run for Governor of Ohio in 2026. His involvement in a "Bitcoin Treasury" company aligns with the broader "pro-crypto" political stance emerging in the U.S., making ASST partly a bet on his political rise and the regulatory tailwinds that might follow.
4. The "Baby MicroStrategy" Playbook
Strive is replicating the MicroStrategy leverage model but with a faster start:
The PIPE Deal: They recently secured $750 million in private financing (PIPE) to buy more Bitcoin.
Warrants: The deal includes warrants that could bring in another $750 million if exercised. This is likely where Jane Street's interest lies—warrants offer massive upside leverage if the stock price spikes.
Aggressive Issuance: They plan to issue debt and equity aggressively to buy more Bitcoin, creating a feedback loop: Buy Bitcoin -> Stock goes up -> Issue stock at premium -> Buy more Bitcoin -> Repeat.
Summary of the Trade
Jane Street likely sees ASST as a high-velocity volatility engine. With Vivek’s political profile, a massive Bitcoin treasury, and a unique tax loophole for crypto whales, the stock is designed to move violently. Jane Street’s 9.9% stake ensures they capture the upside of that movement while staying liquid enough to exit if the premium collapses.
This is a very speculative play. Proceed with caution.

LLY Hits Major Resistance: Breakout to $1300 or Pullback Ahead?LLY is moving inside a strong long-term ascending channel, and the price has now reached the upper resistance boundary of the purple channel.
This is a major decision zone:
Either a breakout occurs and momentum continues strongly upward,
or the price gets rejected and pulls back inside the channel.
Bullish Scenario (Breakout)
A confirmed breakout above the upper channel line can start a strong rally.
Bullish Targets:
• $1150
• $1220
• $1300 (only if the breakout is solid)
Bearish Scenario (More likely on first touch)
LLY reached the top after a very sharp rally, so a pullback is logical.
Bearish Targets:
• $1050
• $980 (mid-channel)
• $900 (bottom of the purple channel)
Stop Loss
• Long positions: Below $1050
• Short positions: Above $1135

MU long-term TAMicron is one of the strongest among semis, there's no need to wonder why it's holding up so good, it has plenty of heavy bullish volumes on weekly time frame which have started to correct recently yes, to be more precise since last week the mid-term has initiated the distribution, so now MU needs some time to balance everything. Watch the blue lines for the support to hold.
