EOSE SwingReasoning:
Strong Industry/Sector
50MA Pullback
Long-Term Investors (3-12 Month Holds)
Entry: Full position on breakout
Profit Taking: Sell 1/4 to 1/5 at Goal 1
Exit Signal: Close below 20-day EMA (your trend guide) or 50EMA
Why: Strong moves are hard to time at the top, but the 20EMA acts as a reliable trend filter
Note:
Remember: Every long-term investment alert can also be played as a swing trade.

Trevi Therapeutics, Inc. (TRVI) Aims To Calm Severe ItchTrevi Therapeutics, Inc. (TRVI) is a clinical-stage biotech built around Haduvio, an oral drug for stubborn chronic cough in idiopathic pulmonary fibrosis and the intense itch of prurigo nodularis. It targets the nerve pathways that keep cough and itch stuck in overdrive, so people can finally sleep, function, and feel normal again. Growth potential leans on late-stage trial data, regulator decisions, and doctors hungry for better options in these hard-to-treat conditions.
On the chart, TRVI just printed a confirmation bar with rising volume as price moved above the 0.236 Fibonacci level and into the momentum zone. From here, traders can use the Fibonacci snap tool to keep a trailing stop tucked just under that 0.236 line, giving the trend room to work while keeping a clear, rule-based exit if momentum fades.

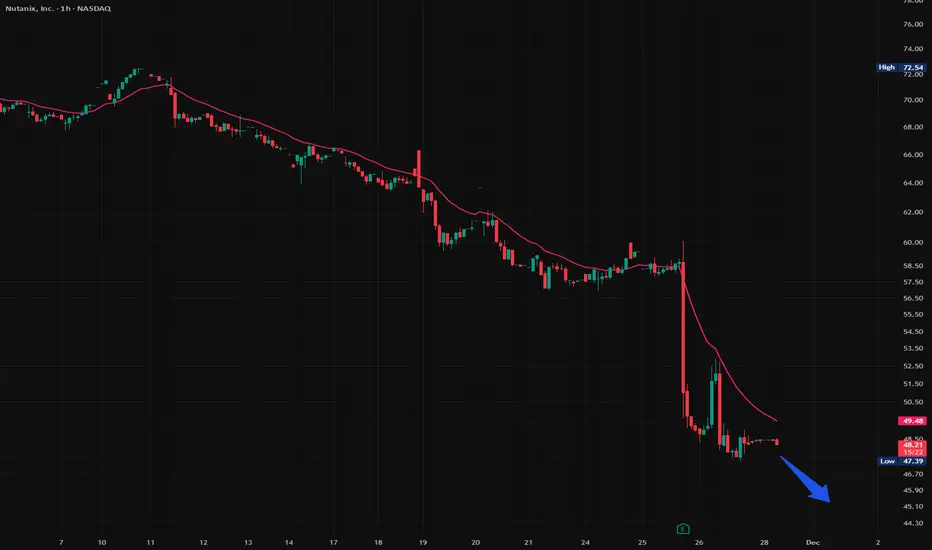
$NTNX , likely Tuesday's low is not going to hold. Nunatix Revenue delays could be structural.
$45 zone first target
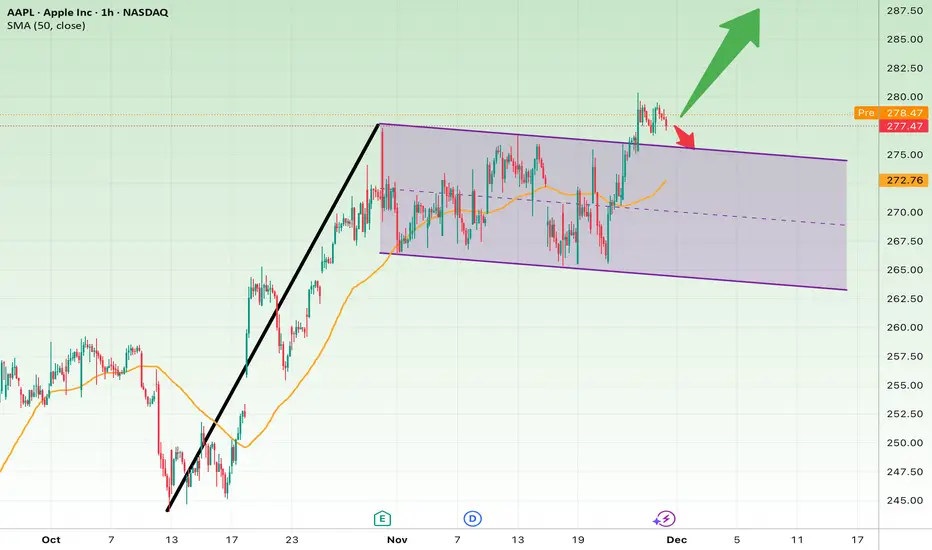
AAPL Breaks Out: Bull Flag Targets Point to $287–$295!After a strong rally (black trendline), AAPL entered a descending corrective channel, which looks like a classic bull flag pattern.
Now the price is breaking above the upper boundary of the channel, suggesting that the correction may be over.
Bullish Scenario (More likely now)
If the price holds above the channel, continuation upward is expected.
Bullish Targets:
• $282
• $287
• $295 (extended target)
Bearish Scenario (Failed breakout)
If price falls back inside the channel, the correction resumes.
Bearish Targets:
• $273
• $268
• $262 (major support)
Stop Loss
• Long: Below $274
• Short: Above $280.50
Coming soon 125 Looks bullish and can double from here. My max target is 180. Hopefully 125 by Aug 2026, may go higher but minimum 125. It must stay above 60 otherwise it can crash if it loses 60.
All the best!!

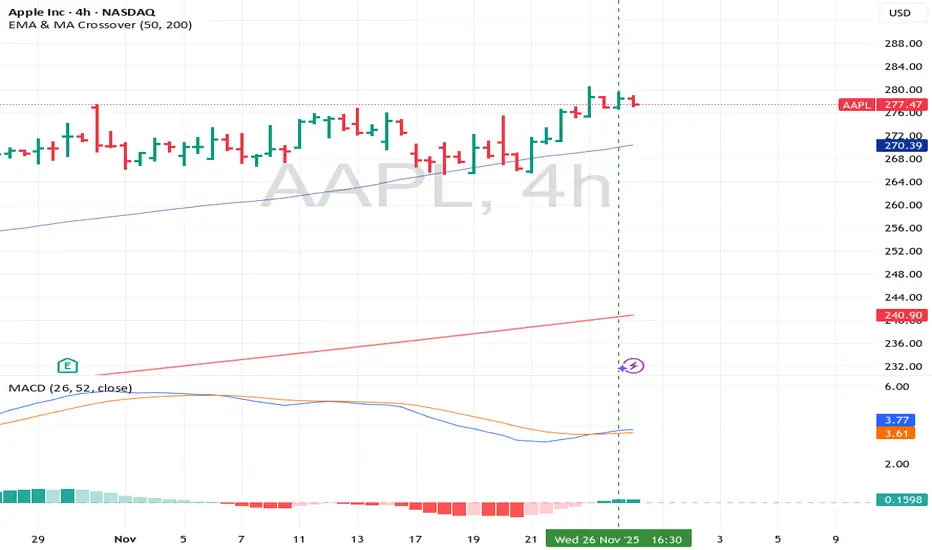
AAPL - Correction ahead?Bearish Scenario for AAPL (4H Analysis)
AAPL is currently trading at an extended level after a steep multi-week rally. The structure is forming a potential rising wedge, which typically signals trend exhaustion and an increased risk of a corrective move.
Key Breakdown Trigger
A confirmed break below 270 USD (4H close) would invalidate the current short-term uptrend and open the door for a deeper correction.
Downside Levels to Watch
260–262 USD
First major support zone. A retest here would be a normal pullback in the broader uptrend.
248–250 USD
Weekly orderblock + strong horizontal support.
If price reaches this zone, increased buying interest is likely — but if it fails, downside pressure accelerates.
237 USD
High-confluence structural level.
This is the most probable target in a more significant correction.
223–224 USD (Weekly Low)
Only relevant if the market enters a broader risk-off phase.
Bearish Confluence Factors
Sharp overextension from mid-trend support
Momentum weakening after parabolic move
Declining volume while making new highs
Rising wedge structure tightening
Summary
AAPL remains bullish on higher timeframes, but the risk of a larger corrective move is elevated. Losing 270 USD would likely trigger a multi-level retracement toward 260 → 250 → 237.

AMD: 30% Upside Potential if Today Closes Green — Bullish HammeAMD is showing a high-conviction technical setup with nearly 30% upside potential, provided it closes today in green and confirms the hammer-type reversal candle forming near the lower channel support.
🔥 Key Bullish Signals
Hammer-like candle forming at the bottom of the pullback zone — indicating buyers stepping in aggressively.
Price is bouncing from trendline support within the long-term rising channel.
A green close today will confirm bullish reversal strength.
The upside projection targets the upper channel line, approximately 30% above current levels.
🎯 Target Zone
$280–$290 (upper trendline)
≈ 30.8% upside potential
🛡️ Key Support
$200–$205 zone — where the hammer is forming.
Losing this zone may delay or negate the setup.
📌 Trading View
If AMD confirms the hammer with a strong bullish close, it could kickstart the next leg toward the upper channel — a move that aligns with broader market strength and sector rotation back into semiconductors.

LLY NOV 2025LLY extending in markup, demand absorption at 935-885 support.
Upside target 1120; downside 885 then 740 if it fails.
#LLY #globaltrade #investment #investing #stockmarket #wealth #realestate #markets #economy #finance #money #forex #trading #price #business #currency

It's a time for RKLB - 45% potential profit - 62 USDThe chart shows Rocket Lab Corporation on the daily timeframe. After a strong bullish trend, the price entered a deep correction phase, dropping into the 41–42 USD area. Currently, the decline appears to be losing momentum, and price action shows signs of stabilizing around a key support zone. This area has previously acted as a demand zone, which increases the likelihood of a short-term bounce.
The price is currently positioned below two moving averages, but it has started to approach them from underneath. This may indicate a potential short-term trend reversal if the price breaks above the first moving average and holds above it. Such behavior often signals the beginning of a corrective or reversal move to the upside.
The RSI indicator is in low territory, suggesting that the stock is near oversold conditions. Historically, this often results in a technical rebound as selling pressure weakens and buyers re-enter at discounted levels. Moreover, recent candlestick structure indicates decreasing selling pressure and early signs of demand returning to the market.
The highlighted price projection toward the 62 USD level reflects a potential corrective move back into a previous resistance zone, which also aligns with a psychological price level. From a technical perspective, this area represents a logical first upside target following such a strong downward move. If buying momentum continues and price breaks through local resistance levels, a move toward the 60–62 USD region in the near term is a realistic scenario.
Overall, the technical picture suggests that the stock may be entering an early recovery phase after a strong decline, with growing probability of a short-term upward movement. The coming sessions will be critical — a breakout accompanied by increased volume would strengthen the case for a move toward the 62 USD level.
Potential TP: 62 $
⚠️ Disclaimer
This analysis is for educational and informational purposes only and does not constitute financial or investment advice. The financial markets involve risk, and past performance is not indicative of future results. Always conduct your own research or consult with a licensed financial advisor before making any investment decisions.

Just In: Chagee Holdings Limited (CHA) Set for 160% BreakoutThe price of Chagee Holdings Limited (NASDAQ; NASDAQ:CHA ) is gearing for a 160% breakout amidst breaking out of a falling wedge.
The stock has been in an enclosed falling wedge since Early March this year. However, growing interest reveals the stock is set to go parambolic with eyes on the $30 resistant point.
Currently up 1.20% in Friday's premarket session with the RSI at 54, NASDAQ:CHA stock is poised for the 160% surge.
Financial Performance
In 2024, Chagee Holdings's revenue was 12.41 billion, an increase of 167.35% compared to the previous year's 4.64 billion. Earnings were 1.44 billion, an increase of 172.35%.
Analyst Summary
According to 5 analysts, the average rating for CHA stock is "Buy." The 12-month stock price target is $31.18, which is an increase of 120.67% from the latest price.
About CHA
Chagee Holdings Limited, through its subsidiaries, owns, operates, and franchises teahouses under the CHAGEE brand name in the People’s Republic of China and internationally. The company engages in sale of tea drinks and related raw materials, packaging, teahouse equipment and other supplies. It operates through online platforms. The company was founded in 2017 and is based in Shanghai, the People’s Republic of China.

Just In: Nebius Group N.V. (NASDAQ; $NBIS) Spike 5.61% YesterdayThe price of Nebius Group N.V. (NASDAQ; NASDAQ:NBIS ) Spike 5.61% in Thursday's market trading extending the gains to premarket session on Friday.
NASDAQ:NBIX is up 2% in Friday's premarket session amidst growing interest in the AI tech giant.
For NASDAQ:NBIX , if it manages to break the ceiling of the wedge formed- that is the $170 resistance, NASDAQ:NBIX will be set for a move to the $200 pivot.
Similarly, failure to achieve that fit might resort to a drawback to the $90 range shaking weak hands before picking liquidity up.
Nebius have received a haircut of 40-60% in recent weeks.
NBIS stands out for the highest ARR projections and a lower forward P/S ratio than Iren.
AI hosting demand is likely still underestimated by Wall Street, and further large contracts add to the investment thesis.
We believe NBIS stock could rise significantly in 2 years and still trade at a fair valuation, supported by technicals, despite execution and broader economic risks.
About NBIS
Nebius Group N.V., a technology company, engages in building full-stack infrastructure to service the global AI industry in the Netherlands, Europe, North America, and Israel. The company offers Nebius builds full-stack infrastructure for AI, including large-scale GPU clusters, cloud platforms, and tools and services for developers. It also provides Toloka, a data partner for various stages of generative AI development; TripleTen, an edtech platform for re-skilling individuals for careers in technolgy; and Avride.

PERFECT MSFT SHORTWe have a really strong timeframe alignment on NASDAQ:MSFT , presenting us with a great shorting opportunity.
Weekly
If we start top down from the weekly, MSFT had a strong and fast rally but has faced strong rejection on the upper side of its long term upward channel. Price may now look to retrace to its previous long-term swing high after this rejection. We also see volatility constriction through Bollinger Bands, indicating potential for large price moves and volume to occur soon.
Daily
On the daily chart we see a strong rejection of the daily 50 ema and resistive levels after a downside breakout.
Hourly
For the entry on the 1hr timeframe we are looking at a large head and shoulder formation, with a trend rejection and a strong rejection of the 1hr 100ema.
I am targeting the previous long-term swing high at 470 as my singular TP.
Goodluck-nfa.

A Crabby Winter? New Highs, New and Old SupportLet's keep it short and a bit elementary.
Last time Symbotic printed their ATH at closing, we saw months of "sideways" trading, forming a channel and eventually breaking through, downwards, due to a multitude of things. I mentioned this early August or so.
ibb.co
I believe with the recent surge, we're going to see the same pattern over the next few months, with our crab walk bounds between... lets say $55-80 respectively, this is wildly speculative and considers both extremes on each end.. ideally we cool off some and linger around something sustainable above $60 while the company continues to produce actual feasible A.I. solutions.
The good I see based off my readings:
-No debt as a company
-New found, highly experienced management
-Introduction of new hybrid batteries for SymBots, 10x more efficient.
www.symbotic.com
-Introduction of Next Gen Structure / Greenbox
-Continued site expansion into Mexico / Nationwide
A lot of other companies are on an A.I. run as we see the bubble grow, who will remain after it eventually pops? Companies that deliver an actual product that you can see work with your own eyes id say. There will be a "shakedown".
Not professional advice, I drew three lines.
Happy Trading.
Long , but planning to TP some after earnings, November 24th

MMC:W-X-Y Correction Complete, Leading Diagonal Initiates Wave MMC: W-X-Y Correction Complete, Leading Diagonal Initiates Wave 1 Upside (Target 220-235)
Published: 2025-11-28 Symbol: MMC (NYSE)
Following the April high of 242 USD, MMC entered a W-X-Y double zigzag correction: Wave W declined to 209 USD (5-3-5 structure), X rebounded to 231 USD, and Wave Y equalled W in length (1.0 ratio, ~57 USD drop, no overlap), bottoming at 174 USD on Nov 21. RSI bullish divergence + MACD golden cross confirm correction end, with current impulse 1-5 waves launching from the 176 zone.
Primary Count (Light Blue Labels): Wave 1 forms a Leading Diagonal (A-E 3-3-3-3-3 subwaves) converging upward, E subwave high at 183 USD now in place. Rising channel (lower rail 178, upper 186) bounds the rally, Nov 27 close at 182.70 USD hugging the midline. Wave 3 projected to accelerate in Dec to 201-206 (1.618 extension), Wave 5 parallel channel mirrors Wave 1, upper rail at 220 USD (Q1 2026).
Alternative Count (Dark Blue): If Wave 1 is brief, Wave 3 extends as a Diagonal to 235 USD (Q2), hedging Q4 earnings uncertainty (EPS est. 1.98 USD).
Support/Resistance: Short-term support 176-178 (channel lower), break evolves to Z wave (W-X-Y-Z triple zigzag), targeting 150-160 USD (61.8% Fib). Short-term resistance 185-190, break above 186 confirms Wave 3 (alert set). Volume needs >2.8M shares to expand.
Fundamentals: Q3 revenue +11%, Barclays upgrade to 206 USD supports upside, but BofA downgrade flags low-volume risk (current 2.27M shares).
Monitoring: Dec FOMC rate cut catalyst.
Disclaimer: This analysis is for educational purposes only and is not investment advice. Please do your own research (DYOR) before making any trading decisions.

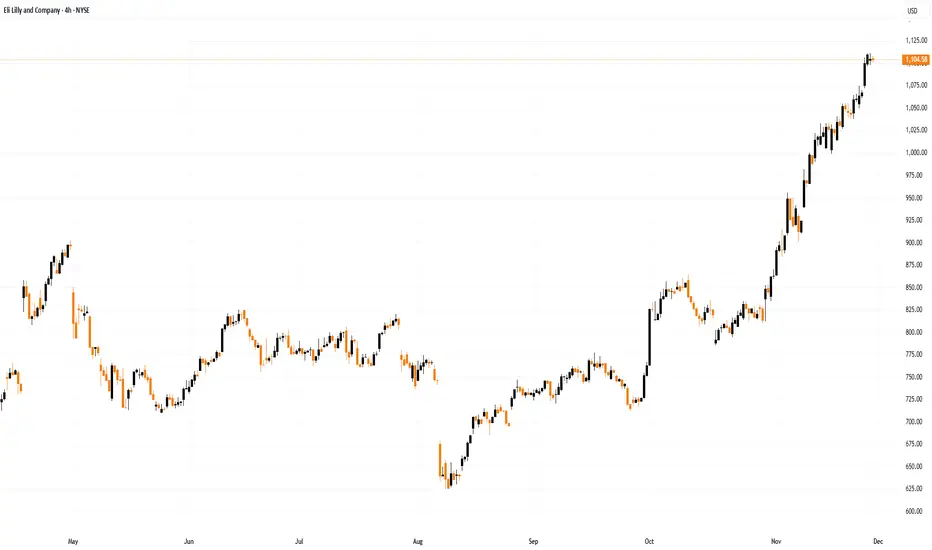
Eli Lilly (LLY) Shares Have Surged by Around 30% in NovemberEli Lilly (LLY) Shares Have Surged by Around 30% in November
The price action of Eli Lilly and Company (LLY), the world’s largest pharmaceutical firm, reflects exceptionally strong demand:
→ since the start of the month, LLY shares have risen by roughly 30%;
→ in late November, the company’s market capitalisation exceeded $1 trillion, making Eli Lilly the first pharmaceutical firm in history to reach this level.
Why are Eli Lilly (LLY) Shares Rising?
A key driver has been the strong earnings report published on 30 October.
→ Earnings per share came in far above expectations ($7.02 versus $5.69).
→ Sales of diabetes treatment Mounjaro and obesity drug Zepbound surpassed $10 billion for the quarter.
→ On the back of this success, management raised its revenue outlook, and market participants now expect an even stronger fourth quarter.
At the same time, the chart is signalling that the extraordinary rally may be running out of steam.
Technical Analysis of Eli Lilly (LLY) Shares
For more than a year, LLY’s price action followed a downward channel. If this channel is extended upward twofold after the bullish breakout (which occurred following the earnings release), we can see that the price has reached the upper boundary of the expanded channel — a level often viewed as a potential target for buyers.
Note that after breaking above the psychological $1,000 level, the rally initially slowed (1), but then accelerated sharply this week (2) — a possible sign of FOMO and the climax of the November uptrend.
Additionally → the RSI indicator is deep in overbought territory and is pointing lower.
Given these factors, it is reasonable to assume that LLY shares are vulnerable to a pullback, which could intensify if investors begin taking profits on long positions.
This article represents the opinion of the Companies operating under the FXOpen brand only. It is not to be construed as an offer, solicitation, or recommendation with respect to products and services provided by the Companies operating under the FXOpen brand, nor is it to be considered financial advice.
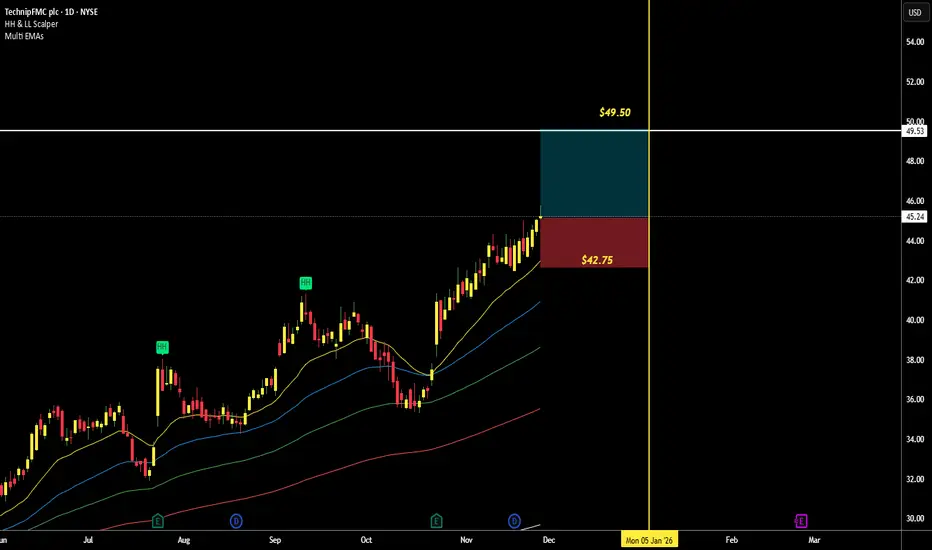
Systematic Quantitative Analysis Report: TechnipFMC (FTI) High-CIX.B. Conclusion and Recommendation
The analysis concludes with a decisive validation of TechnipFMC (FTI) as the single, high-conviction Bullish candidate. The trade thesis is fundamentally sound (PEG 0.31, Strong FCF), technically confirmed (Price > EMAs, high velocity), and event-driven (Substantial iEPCI Contract).
The execution plan strictly adheres to all quantitative risk mandates, setting a precise 2.00:1 R:R structure with an entry at $45.00$ and a tight, predetermined exit at $42.75$.
The convergence across all five required filters (Fundamentals, Momentum, Risk, Flow, and Catalyst) establishes the necessary systematic certainty for the immediate execution of this tactical long position.
Overview of Global Financial Markets1. Structure and Types of Financial Markets
Financial markets are broadly classified into capital markets, money markets, and derivatives markets.
Capital markets are designed for long-term funding and include the equity markets, where companies raise capital by issuing shares, and the bond markets, where governments and corporations raise funds through debt instruments. Equity markets, such as the New York Stock Exchange (NYSE) and the London Stock Exchange (LSE), provide platforms for investors to trade shares, influencing corporate governance and investment flows. Bond markets, by contrast, serve as a critical tool for raising long-term financing at relatively lower costs.
Money markets deal with short-term debt instruments, generally with maturities of less than one year. These include Treasury bills, commercial papers, and certificates of deposit. Money markets provide liquidity management tools for governments, financial institutions, and corporations. Their importance is particularly highlighted during periods of financial stress, where central banks often intervene to stabilize short-term interest rates.
Derivative markets involve financial instruments whose value is derived from underlying assets such as stocks, bonds, currencies, or commodities. Derivatives include futures, options, and swaps, which are extensively used for hedging risks or speculative purposes. These markets play a crucial role in risk management but also introduce complexities and systemic risks, as observed during the 2008 financial crisis.
2. Key Components and Participants
Global financial markets comprise a variety of participants, including retail investors, institutional investors, banks, insurance companies, hedge funds, and sovereign wealth funds. Institutional investors often dominate trading volumes and have significant influence over market movements due to the scale of their investments. Central banks, as regulators and participants, shape market expectations through monetary policies, liquidity management, and intervention in currency and bond markets.
Financial intermediaries, such as investment banks, brokers, and asset managers, facilitate market operations by providing liquidity, price discovery, and risk management services. Their role is critical in connecting borrowers and lenders, particularly in capital markets, ensuring efficient allocation of resources.
3. Role of Global Financial Markets
Global financial markets perform several vital economic functions:
Capital Allocation – They enable businesses, governments, and other entities to mobilize resources for productive investments. Efficient allocation ensures that capital flows to the most promising sectors, fostering innovation, economic growth, and employment generation.
Price Discovery – Through the interaction of supply and demand, financial markets determine prices for financial instruments, which reflect market expectations, risk perceptions, and macroeconomic conditions.
Liquidity Creation – Markets provide mechanisms for investors to convert assets into cash quickly, offering flexibility and reducing financial frictions.
Risk Management – Derivative markets allow participants to hedge against adverse price movements, interest rate fluctuations, or currency risks, thus mitigating potential financial losses.
Economic Indicators – Market movements serve as barometers for economic health. Equity indices, bond yields, and commodity prices provide real-time signals about investor sentiment, inflation expectations, and economic stability.
4. Globalization and Interconnectedness
In the contemporary era, financial markets are highly globalized, interconnected, and technologically driven. Events in one region can trigger ripple effects worldwide. For example, a liquidity crisis in the U.S. can influence bond yields in Europe, stock markets in Asia, and currency valuations globally. Cross-border capital flows, foreign direct investments, and multinational financial institutions have intensified this interdependence.
Globalization has brought efficiency and opportunities but also systemic risks. Financial contagion, where crises spread across countries, is a notable concern. The 2008 Global Financial Crisis demonstrated how interlinked markets, complex derivatives, and excessive leverage can transmit shocks globally, emphasizing the need for coordinated regulatory oversight.
5. Technological Advancements
Technological innovation has revolutionized financial markets. Electronic trading platforms, algorithmic trading, and high-frequency trading (HFT) have increased trading speed, liquidity, and accessibility. Retail investors can now access global markets with minimal friction, and data analytics provide insights for better investment decisions.
Blockchain technology and cryptocurrencies represent another transformative trend, introducing decentralized financial systems that operate independently of traditional banks. While these innovations present new opportunities, they also pose regulatory and risk management challenges, particularly regarding security, volatility, and legal frameworks.
6. Regulatory Framework
Financial markets operate under stringent regulations to ensure transparency, stability, and investor protection. Regulatory bodies like the U.S. Securities and Exchange Commission (SEC), European Securities and Markets Authority (ESMA), and the Securities and Exchange Board of India (SEBI) establish rules governing market conduct, disclosure norms, and financial reporting.
Global coordination among regulators is critical, especially in derivative markets and cross-border capital flows, to prevent market manipulation, systemic risk, and financial crises. International bodies such as the International Monetary Fund (IMF), Bank for International Settlements (BIS), and the Financial Stability Board (FSB) facilitate dialogue, set standards, and monitor global financial stability.
7. Current Trends and Challenges
Global financial markets face several emerging trends and challenges:
Rising Market Volatility – Geopolitical tensions, trade wars, and economic uncertainty contribute to unpredictable price swings, affecting investor confidence.
Sustainable and ESG Investing – Environmental, social, and governance (ESG) considerations are increasingly shaping investment decisions. Green bonds, ESG-focused funds, and socially responsible investing (SRI) are gaining prominence.
Monetary Policy Impact – Central banks’ policies, including interest rate changes and quantitative easing, have profound effects on asset prices, liquidity, and capital flows.
Cybersecurity and Fraud Risks – With digitization, financial markets are vulnerable to cyberattacks, hacking, and data breaches, necessitating robust cybersecurity protocols.
Climate and Environmental Risks – Climate change and environmental events can disrupt financial markets by affecting insurance, commodity prices, and investment returns.
8. Conclusion
Global financial markets are complex, dynamic, and interconnected systems that facilitate capital formation, risk management, and economic growth. Their evolution is shaped by technological innovation, regulatory frameworks, globalization, and changing investor preferences. While offering opportunities for wealth creation and efficient capital allocation, they also pose systemic risks, requiring prudent oversight, risk management, and adaptive strategies.
Understanding the interplay of market structures, participants, and external factors is crucial for investors, policymakers, and businesses navigating this intricate landscape. As the world becomes increasingly interconnected, the stability, transparency, and efficiency of global financial markets will remain vital for sustaining economic development and financial resilience worldwide.
Case Studies of High-Growth Emerging EconomiesIntroduction
Emerging economies play a pivotal role in shaping global economic dynamics. Characterized by rapid industrialization, increasing integration into global markets, and significant socio-economic transformation, these countries often exhibit higher growth rates compared to developed economies. Understanding their trajectories offers critical insights into developmental strategies, policy formulation, and investment opportunities. This case study analysis focuses on select high-growth emerging economies, examining the factors that fueled their rise, challenges they faced, and lessons that can inform other countries.
1. China: The Manufacturing Giant
Economic Transformation:
China’s growth story is one of the most studied among emerging economies. Since the late 1970s, China transitioned from a centrally planned economy to a market-oriented one. Reforms, such as the establishment of Special Economic Zones (SEZs) and liberalization of trade, catalyzed manufacturing and exports, positioning China as the “world’s factory.”
Key Growth Drivers:
Export-Led Growth: China leveraged low-cost labor and improved infrastructure to dominate global manufacturing.
Investment in Infrastructure: Massive investments in roads, ports, and energy supported industrial expansion.
Technology Adoption: China strategically invested in technology transfer, innovation, and R&D, gradually moving from low-end manufacturing to high-tech industries.
Challenges:
Environmental degradation due to rapid industrialization.
Rising labor costs leading to the relocation of manufacturing to other emerging markets.
Increasing reliance on debt-financed infrastructure projects.
Lessons Learned:
China’s model illustrates the effectiveness of phased liberalization, export-driven strategies, and strategic government intervention in catalyzing rapid growth.
2. India: Services-Led Growth
Economic Transformation:
India represents a contrasting high-growth model driven predominantly by services rather than manufacturing. Since economic liberalization in 1991, India’s GDP has grown steadily, propelled by information technology (IT), software services, and business process outsourcing (BPO).
Key Growth Drivers:
Human Capital: A large, young, and English-speaking workforce facilitated the IT and services boom.
Policy Reforms: Liberalization, privatization, and deregulation attracted foreign investments and promoted entrepreneurship.
Global Integration: India leveraged globalization to become a hub for IT exports, serving international markets.
Challenges:
Infrastructure bottlenecks, particularly in transport and energy, limit manufacturing growth.
Income inequality and regional disparities pose social and political challenges.
Dependence on global demand for IT services makes the economy vulnerable to international shocks.
Lessons Learned:
India’s case underscores the potential of services-led growth and the importance of investing in human capital and digital infrastructure.
3. Vietnam: Export-Oriented Manufacturing
Economic Transformation:
Vietnam’s growth trajectory has been remarkable, with GDP expanding rapidly over the past two decades. Economic reforms under Đổi Mới in 1986 shifted Vietnam from a centrally planned to a market-oriented economy, stimulating private enterprise, foreign investment, and export-led manufacturing.
Key Growth Drivers:
Foreign Direct Investment (FDI): Incentives and trade agreements attracted global manufacturers in electronics, textiles, and footwear.
Competitive Labor Costs: Vietnam’s young workforce and low wages made it a preferred alternative to China for global supply chains.
Trade Liberalization: Membership in the World Trade Organization (WTO) and bilateral trade deals integrated Vietnam into global markets.
Challenges:
Overreliance on FDI and exports exposes the economy to external shocks.
Environmental concerns due to industrialization and urban expansion.
Need for skilled labor and innovation to move up the value chain.
Lessons Learned:
Vietnam highlights the effectiveness of combining market reforms with targeted FDI policies to achieve rapid industrial growth.
4. Ethiopia: Agriculture and Industrial Parks
Economic Transformation:
Ethiopia’s growth story differs from East Asian models, as it relies heavily on agriculture and government-led industrialization. Over the past decade, Ethiopia has been one of Africa’s fastest-growing economies, with infrastructure projects and industrial parks driving development.
Key Growth Drivers:
Agricultural Reforms: Modernizing agriculture through irrigation, mechanization, and value-chain development.
Industrial Parks: Establishment of textile and garment industrial parks attracted foreign investment.
Infrastructure Development: Roads, energy projects, and telecom expansion improved productivity and connectivity.
Challenges:
Political instability and regional conflicts have hampered sustained growth.
Heavy reliance on donor funding and external loans poses debt sustainability risks.
Climate vulnerability affects agricultural output.
Lessons Learned:
Ethiopia demonstrates how strategic public investment in infrastructure and industrial policy can drive growth, even in low-income economies, but highlights the importance of political stability.
5. Brazil: Resource-Led Growth and Diversification
Economic Transformation:
Brazil’s growth has been fueled by abundant natural resources, agricultural exports, and a diversified industrial base. The country emerged as a key player in commodities such as soybeans, iron ore, and oil.
Key Growth Drivers:
Natural Resources: Exploitation of oil, minerals, and agricultural commodities drove export revenues.
Social Programs: Initiatives like Bolsa Família improved human development indicators, supporting domestic consumption.
Industrial Diversification: Investment in automotive, aerospace, and manufacturing sectors reduced dependency on raw materials.
Challenges:
Volatile commodity prices exposed the economy to global shocks.
Political corruption and policy inconsistency hindered long-term growth.
Structural inequality and inflationary pressures remained persistent challenges.
Lessons Learned:
Brazil’s experience underscores the importance of diversifying growth drivers and managing the resource curse through effective policies.
Comparative Analysis
Across these case studies, several common patterns emerge:
Policy Reforms Matter: Successful emerging economies implemented liberalization, trade openness, and regulatory reforms to attract investment.
Human Capital is Key: Education, skill development, and labor force quality are crucial for sustaining growth.
Infrastructure Investment: Physical and digital infrastructure accelerates industrialization and trade integration.
Global Integration: Leveraging globalization through exports and FDI is a consistent growth enabler.
Challenges Remain: Environmental sustainability, inequality, and political stability are recurring constraints that need continuous attention.
While the paths differ—China’s manufacturing-led growth, India’s service-led expansion, Vietnam’s FDI-driven industrialization, Ethiopia’s public-sector infrastructure model, and Brazil’s resource-led diversification—they all highlight that a combination of strategic policies, investments in human and physical capital, and integration into global markets drives high growth.
Conclusion
High-growth emerging economies offer valuable lessons in economic transformation. Their experiences demonstrate that while growth strategies can differ based on comparative advantages, consistent factors such as policy reforms, human capital development, infrastructure investment, and global engagement are universally critical. However, challenges such as inequality, environmental sustainability, and political stability must be addressed to ensure long-term, inclusive growth.
Understanding these cases equips policymakers, investors, and scholars with insights on how emerging economies can navigate the complexities of globalization, industrialization, and socio-economic development, while providing a roadmap for other developing nations aspiring for rapid and sustainable growth.

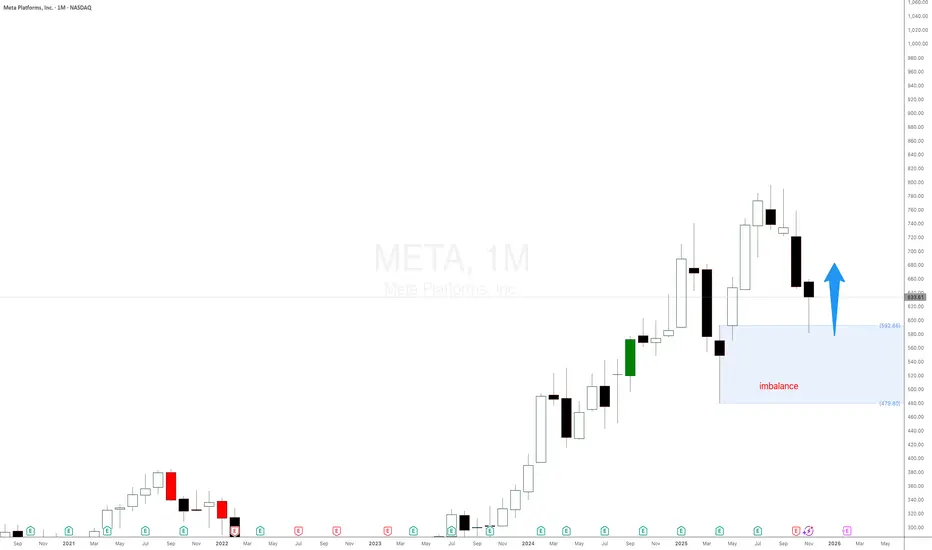
Meta Plafforms stock $META is exploding as expectedMETA Platforms NASDAQ:META is reacting nicely to the monthly demand imbalance at $592 as mentioned in the last update. Using pure supply and demand price action. META’s big drop was predictable from the monthly and weekly imbalances, and how the current reaction was part of the plan all along. Expecting a decent rally.
Google at record highs but Wave 3 cluster/RSI screams pullback!Alphabet is leading the Magnificent Seven, hitting record highs near $330, while most AI and growth stocks, including Nvidia, have stalled. Since launching Gemini 3 in mid-November and with news of a $4.9 billion Berkshire stake, Alphabet has rallied more than 135% off its April low, outperforming all Big Tech peers in 2025.
But Alphabet is at the 161.8% Fibonacci extension of its long-term move and long-to-medium-term move, which matches a textbook Elliott Wave 3 cluster completion. RSI is at an extreme 83 on the weekly, hinting a Wave 4 pullback to $288 could be next, even as the macro backdrop (Gemini 3 AI buzz, Fed rate cut hopes, and demand for Google’s AI chips from Meta) stays strong. Ultimately, a final Wave 5 could extend up to $380-$400.
Key drivers:
Gemini 3 launch positions Alphabet as an AI leader, topping major multimodal benchmarks.
$4.9B Berkshire stake signals major institutional confidence.
Meta seeks Google’s TPU chips, boosting Alphabet’s AI hardware story while pressuring Nvidia.
Fed rate cut odds above 80% further support growth stocks.
Elliott Wave/technical structure aligns with a potential $288 pullback before any push to $380.
Will Alphabet finally pause after eight explosive months, or does the rally have further to run?
Let us know your view and Elliott Wave count in the comments, and follow for more big-picture, technical-plus-macro trade ideas!
This content is not directed to residents of the EU or UK. Any opinions, news, research, analyses, prices or other information contained on this website is provided as general market commentary and does not constitute investment advice. ThinkMarkets will not accept liability for any loss or damage including, without limitation, to any loss of profit which may arise directly or indirectly from use of or reliance on such information.

BITF | WeeklyNASDAQ:BITF — Quantum Model Projection
As outlined in prior analyses, NASDAQ:BITF surged 35.7% directly from the apex of the convergent support-equivalence lines✨ — the standout rally of the week, that aligns perfectly with the upside momentum highlighted by the Q-model.
Wave | Trend Analysis
As noted earlier, the Leading Expanding Diagonal in Primary Wave ⓵, which originated in December 2022, outlines a potentially bullish early-cycle structure, signalling an emerging transition into an accumulation phase. Within my framework, such motive patterns often precede strong impulsive advances, reinforcing the broader bullish narrative as the Cycle-degree uptrend continues to unfold.
Following the deep retracement of Primary Wave ⓶, the impulsive extensions anticipated within Primary Wave ⓷ project toward Q-targets of $8.08 🎯 in the near term and $28.88 🎯 in the medium term.
🔖 In my Quantum Models methodology, Q-targets are defined as high-probability possibilities generated by the confluence of equivalence lines. Additionally, these equivalence lines serve as structural anchors, shaping the internal geometry of the model and guiding the evolution of alternative paths as the price progresses.
#StocksToWatch #MarketAnalysis #TechnicalAnalysis #ElliottWave #WaveAnalysis #TrendAnalysis #FibLevels #FinTwit #TradingView #Investing #BITF
#BitfarmsLtd #Canada #DataCenters #BitcoinMining #CryptoMining #AIStocks #HPC #AI #BTC #Bitcoin #BTCUSD CRYPTOCAP:BTC NYSE:AI

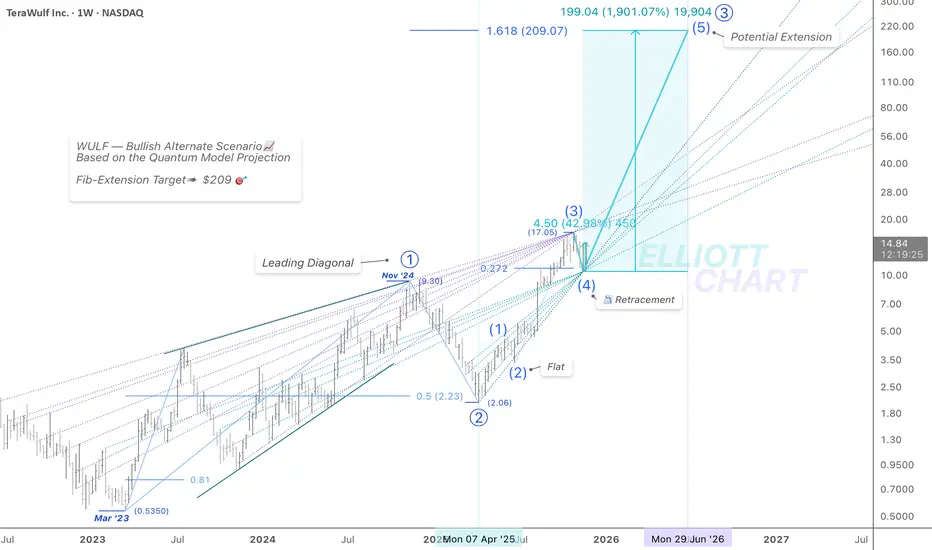
WULF | WeeklyNASDAQ:WULF — Quantum Model Projection
While BTC slid, TeraWulf has climbed 43% over two weeks, showcasing exceptional relative strength.
This resilience signals robust underlying demand across the broader crypto-mining space and reinforces the upside momentum reflected in the Q-models.
Wave | Trend Analysis
The correction in Intermediate Wave (4) reached the 0.272 Fibonacci retracement last week, culminating in a sharp pullback that paused precisely at the apex of the convergent support-equivalence lines.
As illustrated on the chart, the confluence areas where the extended equivalence lines converge may now serve as a high-probability support zone.
From this level, the model favours an extension into Intermediate Wave (5) within Primary Wave ⓷, projecting an impulsive advance toward ➤ $209 🎯 — a target that aligns with the 1.618 Fibonacci extension of the Leading Diagonal established in Primary Wave ⓵.
As noted earlier, the Leading Diagonal in Primary Wave ⓵ — originating in March 2023 — represents a potentially bullish structure, indicating an early-stage transition into a bullish accumulation phase. According to my framework, such motive patterns often precede strong impulsive advances, reinforcing the broader bullish narrative as the Cycle-degree Uptrend continues to unfold.
🔖 In my Quantum Models methodology, the equivalence lines function as structural elements, anchoring the model’s internal geometry and framing the progression of alternate paths.
#QuantumModels #EquivalenceLines #Targeting #MarketAnalysis #TechnicalAnalysis #ElliottWave #WaveAnalysis #TrendAnalysis #StocksToWatch #FibLevels #FinTwit #Investing #MiningStocks #CleanEnergy #SustainableMining #EnergyTech #TechStocks #Equities #DataCenters #BitcoinMining #CryptoMining #AIStocks #HPC #AI #BTC #Bitcoin #BTCUSD
#1 Rocket Booster Strategy: Stop the Noise. Catch the Breakouts🚀 The Rocket Booster Strategy: Stop the Noise. Catch the Breakouts. Win Big.
In the markets, real opportunities don’t come from hype.
They don’t come from fake gurus shouting “Buy Nvidia!”
They don’t come from chasing whatever stock is trending on social media.
Real opportunities come from price action, institutional sentiment, and clean structure — not noise.
And that’s exactly why I developed the Rocket Booster Strategy.
🔥 Why Breakouts Matter
When price hits new highs, above the 50 EMA, and above the 200 EMA, something powerful is happening behind the scenes:
👉 Institutions are buying.
Pension funds… hedge funds… asset managers… smart money.
They move the markets — not retail traders.
So when price stays above both major EMAs and pushes to new highs, it signals:
strong momentum
strong sentiment
strong money flow
…and usually a small intraday correction before the next jump.
That’s your opportunity window.
🚫 The Fake Guru Problem
Every day online:
❌ Someone says Nvidia is the “next big buy.”
❌ Someone screams that AI stocks will pump forever.
❌ Someone gives you a hot tip with zero framework.
Let’s be honest:
Nvidia is NOT the magical buy everyone claims.
AI hype is fading.
The cycle is shifting.
You either evolve — or get liquidated with the crowd.
🚀 Enter: The Rocket Booster Strategy
This strategy cuts out noise, hype, and emotions.
It focuses on pure market structure and sentiment accuracy.
✔ Rocket Booster Rules
For a valid Rocket Booster setup:
Price MUST be above the 50 EMA
Price MUST be above the 200 EMA
Price MUST gap up OR break out into new highs
Once these conditions align, you check the 4-hour chart for a clean breakout.
When sentiment is in the right season and the pattern confirms…
you get explosive new-high buying opportunities.
🎯 Why This Strategy Works
Because it follows the truth:
📌 Institutions buy strength.
📌 Uptrends create new highs — not sideways markets.
📌 Breakouts show where money is flowing right now.
📌 EMAs filter out all the noise and hype.
This is not about predicting the future.
This is about following strength while others chase stories.
Rocket boost this content to learn more
Disclaimer:Trading is risky please use a simulation trading account
before you trade with real money