NFLX — Bullish Structure Above 32.65 with Target at 154.29Summary:
Netflix (NFLX) maintains a broader bullish structure as long as price holds above the major key support at 32.65. Current retracement remains healthy within the Fibonacci levels, and buyers are still defending the mid-range supports.
Analysis:
Price is currently consolidating between the 0.5 Fib (85.28) and the 0.75 Fib (119.79) after a strong impulsive rally from the 32.65 base. The inability of bears to break below 32.65 confirms this zone as a long-term structural support. As long as price stays above this level, deeper bearish continuation remains unlikely.
A reclaim above 119.79 (0.75 Fib) would reopen the path toward 140.49 (0.9 Fib) and ultimately the major target at 154.29 (1.0 extension).
On the downside, a corrective pullback toward 71.48 (0.4 Fib) remains possible but does not invalidate the bullish macro trend unless 32.65 is broken.

DO NOT BUY COPART NOW!We closed well below the previous demand zone and currently sitting in a zone with minimal demand (No-mans land). we are more likely to see this stock tank down to at least $28.
Stay patient

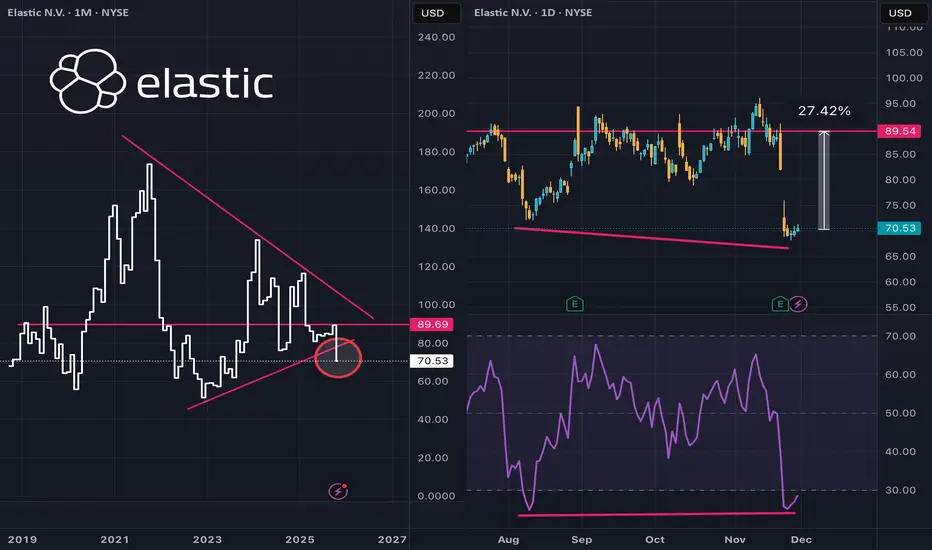
$ESTC creeping towards buy territoryEven after a couple earnings beats in a row NYSE:ESTC has slipped below the bottom edge of a large symmetrical triangle.
Drilling into a daily chart and squinting a bit, there's a mild bullish momentum divergence. Hard to say if the bottom is in just yet, but it does look like one to put on the watch list.
When NYSE:ESTC swings into an uptrend, which could be just months away, the upside potential could be substantial.
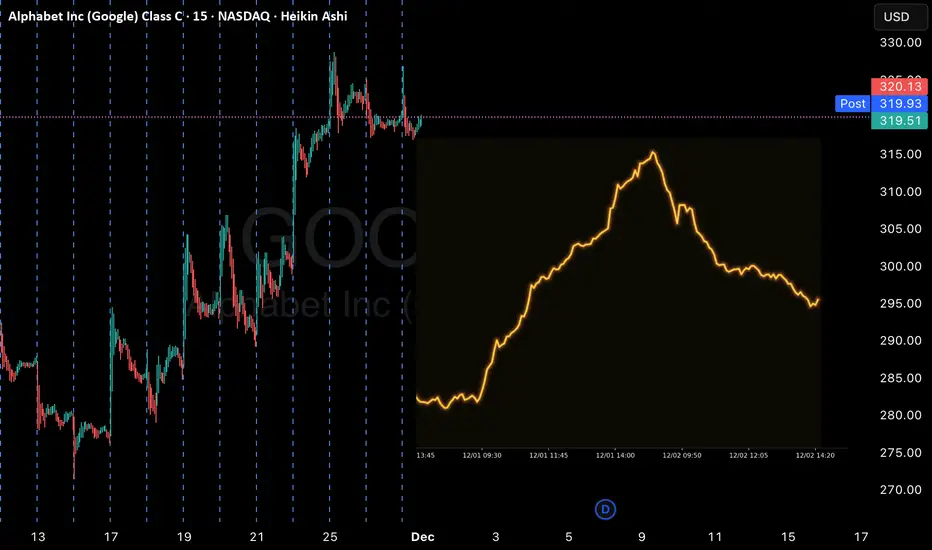
Alphabet (NASDAQ: $GOOGL) Stock: 2025 Continues BullishAlphabet’s stock continues its remarkable performance in 2025, surging nearly 70% year-to-date as strong fundamentals and aggressive AI expansion fuel investor confidence. Much of the momentum comes from Alphabet’s rapidly growing cloud division and the continued rollout of Gemini, its advanced AI model powering enterprise workloads, search upgrades, and next-generation productivity tools. This expansion has pushed Alphabet’s market valuation close to $4 trillion, establishing it as one of the fastest-growing mega-caps this year.
Another major catalyst is Google’s deepening presence in India’s digital infrastructure. The Adani Group recently announced a $5 billion co-investment with Google to build a large-scale data center aimed at supporting India’s rising cloud, AI, and storage needs. This move comes shortly after Google committed $15 billion to an AI-focused data center cluster in Andhra Pradesh. Together, these investments reinforce Alphabet’s expanding footprint across one of the world’s fastest-growing markets and strengthen long-term revenue prospects.
From a technical standpoint, GOOGL remains strongly bullish after breaking above a long-held ascending trendline that acted as multi-year resistance. The breakout triggered a sharp rally, pushing the stock to the current price around $320. Momentum indicators show extreme strength, with the MACD at record highs and RSI firmly overbought—signals that suggest the uptrend remains intact but may face volatility.
The next psychological resistance sits at $350, a level traders will watch closely. On the downside, immediate support lies at $291, followed by a stronger structural zone at $255. As long as price stays above the former trendline and these supports, the broader bullish structure remains dominant.

NVIDIA Trading plan from $100 to $1000. Is it plausible?Exactly a month ago, we called the end of the rally on NVIDIA Corporation (NVDA), essentially the end of its multi-year Bull Cycle and the beginning of an aggressive Bear Cycle correction.
** The 10 year Channel Up **
So far this is paying dividends as the stock just completed a 4-week red streak. The essence of NVIDIA's trend has been a decade long Channel Up, as you can see on this chart and that's the basis of all the buy entries and sell exits we've made over the years.
** Bull and Bear Cycles **
Since early 2025, the stock started that Channel Up, whose first Bull Cycle (as well as the next ones with the exception of one breaking) was supported by the 1W MA50 (blue trend-line). Once that Bear Cycle (in the form of the Channel's Bullish Leg) ended, the subsequent Bear Cycle (Bearish Leg) broke below both the 1W MA50 and 1W MA100 (green trend-line) and bottomed exactly on its 1W MA200 (orange trend-line), marginally above the 0.382 Fibonacci retracement level.
The following Bull Cycle as well as the Bear Cycle followed the same structure only, the bottom was this time marginally below the 0.382 Fib. Then the Bull Cycle that just ended started, with only basic difference that its early 2025 correction broke below the 1W MA50 but found Support on the 1W MA100. Every Bull Cycle had such pre-Top correction (blue ellipse). Note also that this last Bull Cycle as been the strongest Leg on +1881% rise and the one before it, the 'weakest' at +1004%.
** The RSI **
Notice also that the 1W RSI has made the same Double Top rejection pattern on the Lower Highs Zone that both previous Bull Cycle Tops did. Strong confirmation therefore of the emerging Bear Cycle.
** The next bottom **
Technically, we expect the market to bottom yet again on the 1W MA200, which by a fair projection of its current trajectory, we expect that to be around $100. That would still be considerably above the 0.382 Fib, which can only get hit if the Bear Cycle falls very aggressively. Note here that historically within this Channel Up, the most optimal buy signal was given when the 1W RSI hit 42.00. Use that in combination with the 1W MA200.
** Future Targets **
So after the Bear Cycle bottoms, what Target can we pursue? Well the 'minimum' projection based on the 2.618 Fibonacci extension of the Bull Cycle that just ended is $700. At the same time, if it rises by again the 'minimum' % of the weakest +1004% Bullish Leg of the Channel, we are looking potentially at a 4-year Target of $1100. It is also worth noting the valuable use of the Sine Waves that have so far accurately grasped the peak formations of the Bull Cycles. We can use this to time our market exits in 2029.
Realistic or not subjectively, the $100 to $1000 path is what the pure technicals and historical data support and clearly show is a very likely probability for a long-term investment.
---
** Please LIKE 👍, FOLLOW ✅, SHARE 🙌 and COMMENT ✍ if you enjoy this idea! Also share your ideas and charts in the comments section below! This is best way to keep it relevant, support us, keep the content here free and allow the idea to reach as many people as possible. **
---
💸💸💸💸💸💸
👇 👇 👇 👇 👇 👇

JPMorgan Chase (NYSE: $JPM) UK Expansion Signals Strong OutlookJPMorgan Chase (NYSE: NYSE:JPM ) is reinforcing its long-term commitment to the UK with a landmark plan to build a new three-million-square-foot headquarters in Canary Wharf. The proposed Riverside Tower, designed by Foster + Partners, will accommodate up to 12,000 employees and serve as the bank’s primary UK base. The six-year project highlights JPMorgan’s confidence in London’s role as a global financial powerhouse despite broader economic uncertainty.
The development includes sustainable infrastructure, public parkland, and improved transportation links, strengthening both workplace experience and community value. An independent study projects the new HQ could contribute £9.9 billion to the UK economy over the construction period. Additionally, an estimated 7,800 jobs are expected across construction, design, engineering, and related fields. JPMorgan’s existing operations already generate £7.5 billion annually for the local economy, reaffirming its status as one of London’s most influential financial institutions.
While construction progresses, JPMorgan will upgrade its 25 Bank Street location to maintain high workplace standards. The company will also remain active in its 60 Victoria Embankment and One Cabot Square offices, preserving stability for employees and clients.
Technical Outlook:
JPMorgan Chase maintains a broadly bullish technical structure. Price action has consistently respected a long-term ascending trendline, confirming strong institutional demand. Immediate support is marked at $258, a level where buyers may hold if price retraces lower before continuation.
A sustained hold above this zone may lead to continuation toward higher levels. The next major resistance sits at the $300 psychological barrier, a level that could trigger breakout momentum if cleared. Trendline strength and rising investor confidence support the bullish bias as the UK expansion enhances long-term fundamentals.

Palantir - A devastating -40% drop!🤬Palantir ( NASDAQ:PLTR ) will create a major correction:
🔎Analysis summary:
After a textbook bullish break and retest in mid 2024, we witnessed a parabolic rally on Palantir. During the entire rally, we only witnessed one red candle, which clearly shows some significant overextension. Therefore, Palantir will create a major correction now.
📝Levels to watch:
$200 and $100
Phil - @SwingTraderPhilTV
SwingTrading.Simplified. | Investing.Simplified. | #LONGTERMVISION

Apple - This stock will collapse!🥊Apple ( NASDAQ:AAPL ) is reversing right now:
🔎Analysis summary:
Starting back five years ago, Apple established a major rising channel pattern. Following this channel, Apple recently created a textbook +40% move higher. But with the current retest of resistance, we will certainly see another pullback of -30% in the near future.
📝Levels to watch:
$250
SwingTraderPhil
SwingTrading.Simplified. | Investing.Simplified. | #LONGTERMVISION

PRAX: good looking base formation and trend structure NASDAQ:PRAX showing constructive base formation and a stable trend structure. As long as price holds above the 147–120 mid-term support zone, the setup supports potential extension toward the 450+ resistance levels.
Chart:
Weekly view:

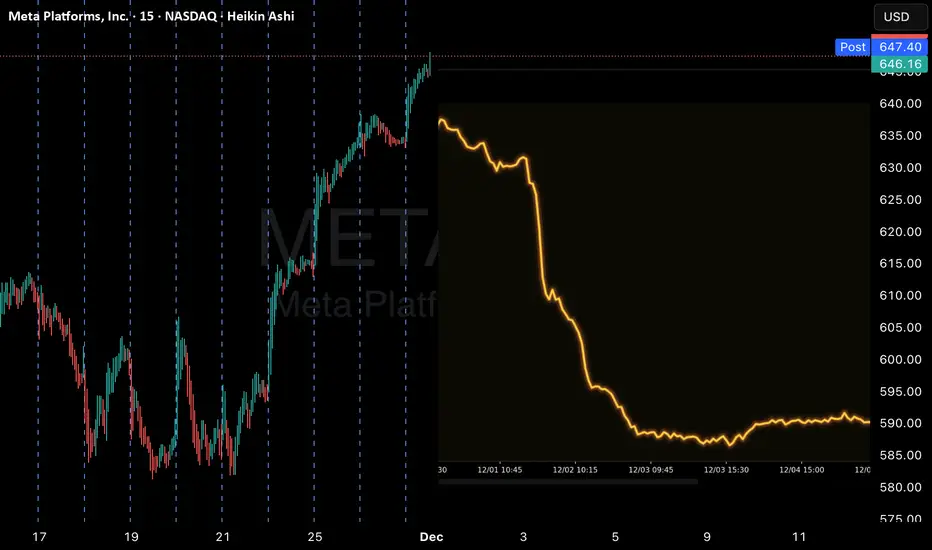
META QuantSignals V3 | Moderate Risk alretMETA Swing Signal — (2025-11-28)
Instrument: META
Direction: BUY CALLS 📈
Confidence: 60% (Medium)
Horizon / Expiry: 14 days → 2025-12-12
Strike Focus: $650.00
Entry Range: $12.50 – $13.50 (mid $13.00)
Target 1: $19.00 (+50%)
Target 2: $25.00 (+100%)
Stop Loss: $8.50 (-35%)
Position Size: 3% of portfolio
Risk Level: Moderate — sector volatility and mixed technical signals
Katy AI Signal
Bullish prediction targeting $680–$700 in 14 days
Strong AI sector momentum and technical breakout potential
Katy LLM Conflict: LLM recommended CALLS, but Katy chart shows PUTS (-8.40% predicted) — medium confidence
Technical Context
Current Price: $645.62 (near session high $646.25, above VWAP $606.50)
Support: $600–$610
Resistance: $650–$660
Momentum: Bullish after 6.93% intraday gain
Market Context: STRONG_BULLISH overall; SPY & QQQ bullish
Options Flow
Put/Call Ratio 0.73 → bullish sentiment
Some hedging at $730 put, but overall call buying interest
Neutral flow bias, supports potential upside
Trade Setup & Strategy
Why This Trade: Captures AI sector momentum in large-cap tech swing play
Timing Advantage: Enter after significant intraday gain; aligns with continuation pattern
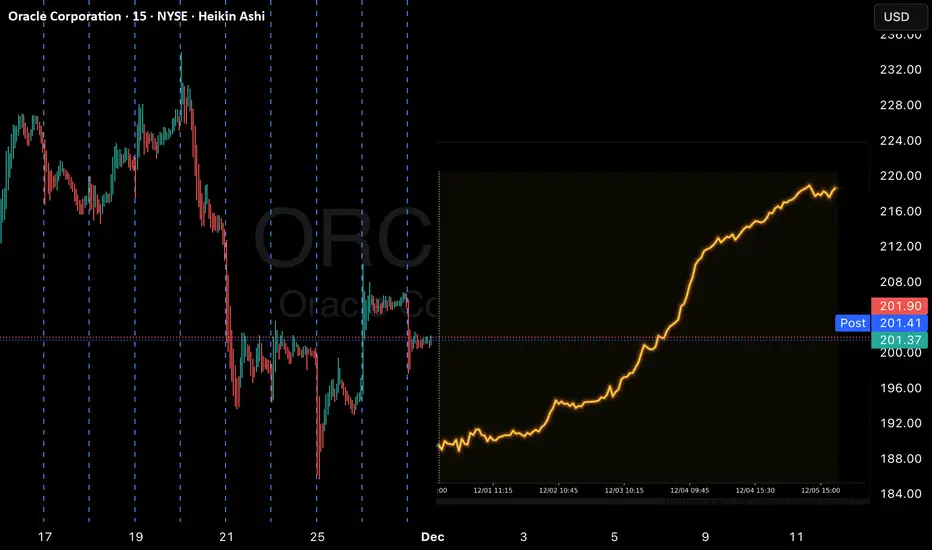
ORCL Swing Signal: Katy AI Predicts Short-Term UpsideORCL Swing Signal — (2025-11-28)
Instrument: ORCL
Direction: BUY CALLS 📈
Confidence: 58% (Medium)
Horizon / Expiry: 14 days → 2025-12-12
Strike Focus: $210.00
Entry Range: $8.50 – $9.00 (mid $8.75)
Target 1: $12.75 (+50%)
Target 2: $15.30 (+80%)
Stop Loss: $6.38 (-25%)
Position Size: 2% of portfolio
Risk Level: Moderate — recent volatility and low confidence
Katy AI Signal
Bullish bias, recovery potential after 7.96% drop
Predicted mean reversion toward $220–$230 range
40.2% swing range position favors upside
Technical Context
Current Price: $201.30 (< VWAP $206.97) → potential bounce
Key Resistance: $219.07
Support: $185.63
Trend Strength: Weak, but setup favors upside
Candlestick Patterns: None detected
Broader Market: STRONG_BULLISH; SPY & QQQ bullish
Options Flow
Neutral flow, low time decay risk
No unusual activity — potential for momentum shift
Trade Setup & Strategy
Why This Trade: Combines oversold bounce potential with broader market tailwinds
Timing Advantage: Enter after sharp single-day drop; favorable risk/reward
Risk Mitigation: Tight stop loss, small position size, scale in if needed
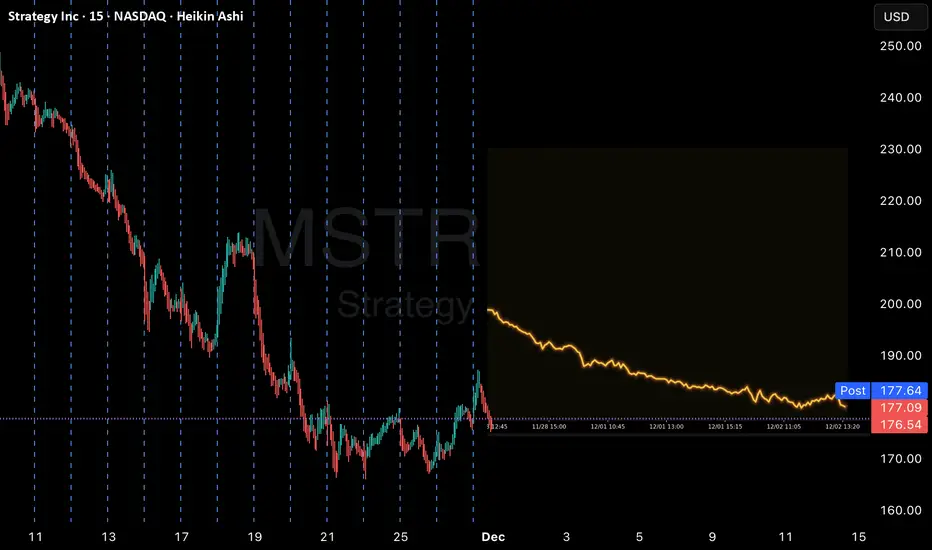
MSTR Weekly PUT Alert — Katy AI Predicts Sharp DownsideMSTR QuantSignals V3 — Weekly Signal (2025-11-28)
Expiry: 2025-12-05 (7 Days)
Instrument: MSTR
Current Price: $177.30
Direction: PUT (SHORT)
Confidence: 60% (Medium)
Risk Level: ⚠️ HIGH
📈 Signal Details
Strike Focus: $175.00 (-0.427 Delta)
Entry Range: $5.90 – $6.20 (mid $6.05)
Target 1: $9.07 (+50%)
Target 2: $10.89 (+80%)
Stop Loss: $4.84 (-20%)
Position Size: 2% of portfolio
🧠 Katy AI Analysis
Predicted Move: $177.30 → $172.61 (-2.65%) over 7 days
Trend: Bearish momentum, consistent downward trajectory
Time Series: 70% of prediction points below current price
AI Confidence: 50%
📊 Technical & Market Context
Weekly Momentum: -2.46%
RSI: 20.6 (oversold)
MACD Histogram: Bearish
VWMA: -1.78%
Resistance: $179.96 (Katy stop loss)
Support / Target: $172.61
News Sentiment: Neutral-to-negative; Bitcoin volatility influences sentiment
Options Flow: Contrarian signal — PCR 0.44 (heavy call buying)
Gamma Risk: High — Friday expiration
⚡ Trade Setup & Strategy
Why This Trade: Combines Katy AI’s high-frequency prediction with oversold RSI in trending regime → ideal for momentum continuation
Timing Advantage: Friday expiration captures weekend decay and aligns with Katy’s 7-day prediction window
Risk Mitigation:
Tight stop at $4.84
Limited 2% position size due to expiration gamma risk
Strike selection provides balanced risk/reward
GOOG Weekly CALL Alert — Early-Week Momentum Play ActivatedGOOG QuantSignals V3 — Weekly Signal (2025-11-28)
Expiry: 2025-12-05 (7 Days)
Instrument: GOOG
Current Price: $319.97
Direction: CALL (LONG)
Confidence: 60% (Medium)
Risk Level: ⚠️ MODERATE
📈 Signal Details
Strike Focus: $320.00 (ATM, 0.513 Delta)
Entry Range: $5.60 – $5.70 (mid $5.65)
Target 1: $9.04 (+60%)
Target 2: $12.43 (+120%)
Stop Loss: $2.83 (-50%)
Position Size: 2% of portfolio
🧠 Katy AI Analysis
Predicted Move: $319.97 → $333.48 (+4.22%) by Dec 1 afternoon
Trend: Bullish momentum building despite initial NEUTRAL label
Sustained Levels: Above $325 through Dec 2
Time Series: Clear gradual upward trajectory
AI Confidence: 60%
📊 Technical & Market Context
Weekly Momentum: +0.33% (Neutral)
Weekly Range Position: 90.2% high
VWAP: $321.97 (resistance)
Support: $315.17 (stop loss)
Resistance: $325 – $330 zone
MACD: Bullish confirmation
News Sentiment: Mixed tech headlines, AI bubble concerns, potential oversold bounce
Options Flow: Neutral PCR 1.00; unusual activity at $175 put is protective hedging
Gamma Risk: Low
⚡ Trade Setup & Strategy
Why This Trade: Katy AI reveals bullish momentum not captured in NEUTRAL summary
Timing Advantage: Entry near weekly high → early-week upside capture
Risk Mitigation: Tight 50% stop, balanced delta selection reduces gamma risk
CRWV Weekly Signal: Bearish Momentum Triggers PUT SetupCRWV — Weekly Options / QuantSignals Katy Analysis (2025-11-28)
Symbol: CRWV
Current Price: $73.12
Expiry: 2025-12-05 (7 days)
📈 Katy Forecast & Signal
Direction: BUY PUTS
Confidence: 65% (Medium)
Predicted Move: $73.12 → $70.46 (-3.64%)
Trend: Neutral (Katy) / Bearish Momentum
Weekly Momentum: -2.31%
Time Series Analysis: Gradual decline through Dec 2nd; lowest point $68.01
💰 Trade Setup
Strike Focus: $70.00
Entry Price: $4.90 – $5.50 (mid $5.20)
Target 1: $8.32 (+60%)
Target 2: $10.60 (+104%)
Stop Loss: $3.75 (-28%)
Position Size: 3% portfolio
Delta: 0.671
⚠️ Risk & Considerations
Moderate Risk Warning: Medium confidence → consider reducing position size
Gamma Risk: Low (weekly expiry)
Options Flow: Neutral → limited institutional activity
Volatility: VIX 17.19, normal range
Katy-LLM Conflict: LLM recommends BUY CALLS; Katy clearly signals PUTS
🔍 Technical Notes
VWAP: $72.42 → near-term resistance
Weekly Range: $66.00 – $76.60
Volume: 6.7× average → distribution
Sector Sentiment: Tech sector cautious, AI hype concerns
TradingView Chart Insights
CRWV sitting in bearish consolidation
Potential support near $70, resistance at VWAP $72.42
Bearish momentum confirmed by weekly decline and volume spikes

AMC Accumulation I believe NYSE:AMC has been in a large accumulation starting around April 24'. The most recent break below the range on decreasing volume leads me to believe we are in Phase C. In order for this to be a Spring, we need to see strong volume come into the upside to break back into the range and a test of Supply. A break above Supply would be a Sign of Strength. (SOS) While many scream fundamentals, I choose to trade the chart. With that said, a strong Q4 could flip net profit positive. (HUGE) I see deep value in AMC if they can pull off profitability in Q4. This is just my opinion and what I see on the chart. I am focused on the Wyckoff events and phases. As far as timing, I wish I could remove the dates below the chart. This is my thesis.
Originally posted on Nov. 19th. Had to remove due to educational link to external source explaining what accumulations and distributions are.

Novo Nordisk $NVO – Undercut and Reverse Setup AnalysisTrade Setup Overview
Novo Nordisk (NVO) is currently exhibiting characteristics of a classic undercut and reverse chart pattern. On November 24th, there was a distinct sign of lower price rejection, indicating that institutional buyers were active in the market. This activity was marked by a significant increase in trading volume, resulting in a pocket pivot, which is often considered a bullish signal.
Technical Developments
As of today, NVO has reclaimed its position above the 21-day exponential moving average (EMA). The stock now appears poised to break out above its established flat base. In response to these technical indicators, I have decided to take a full position in the stock, anticipating a potential breakout.
Risk Management
To manage downside risk, I have set my stop loss at a close below the low reached on November 25th. This stop placement represents approximately a 6.5% loss from my entry point. While this stop-loss is somewhat larger than my usual preference, it remains within my acceptable risk management range.
Investment Considerations
It is important for readers to conduct their own analysis and adhere to their personal trading strategies. All investments inherently involve risk, and making informed decisions is essential when allocating capital in the financial markets.

STLA - Golden crossSTLA had a Golden Cross on November 18, 2025. Now it will begin the recovery phase for this stock. The stock price is above all MA20, MA50, and MA200. Both RSI and MACD indicators support the uptrend. Hopefully, this prediction is accurate.
The price on 11.28.2025: $10.66 (Entry).
Price target: $11.43/ $13.12/ $17.81/ $25.38
Stop loss: $10.14.
IMO, amateur trader.
Good luck!

Precious metals are not dead - Long at 5.13Despite what market headlines would have me believe, I am still a strong believer in precious metals here. De-dollaring by foreign countries, or at least hedging their dollars invested here is real and ongoing. Goods inflation is starting to re-enter the chat, and the rest of the market is feeling wobbly, to say the least. While I'm no buy and holder of this or any stock, those tailwinds are good ones to have. The stock is still solidly in an uptrend, and there is nearby support as well. Also, it has pulled back 25% already and rallied 5% intraday off its low to close above near term support. I like all of that.
The correction in gold, frankly, is a normal and healthy one in my opinion. Does it continue? Maybe. But I do think it's a bit of an overreaction here. Other precious metals are simply along for that ride. This stock has made me too much money too many times to ignore this opportunity at this level. In fact, I got in yesterday (and again at the close today at 5.13). I think there's a very real chance of a double digit percentage rebound from here.
If you doubt this, I get it. But I would look at those past ideas I've posted and how those turned out before you dig your heels in too hard against this one. But, markets only function when there are opposite viewpoints about the future price of a stock, so have at it if you're a bear here. If this takes a while to resolve, I am not at all opposed to tactically adding more if the opportunity is a good one, or taking profits for the same reason.
As always - this is intended as "edutainment" and my perspective on what I am or would be doing, not a recommendation for you to buy or sell. Act accordingly and invest at your own risk. DYOR and only make investments that make good financial sense for you in your current situation.

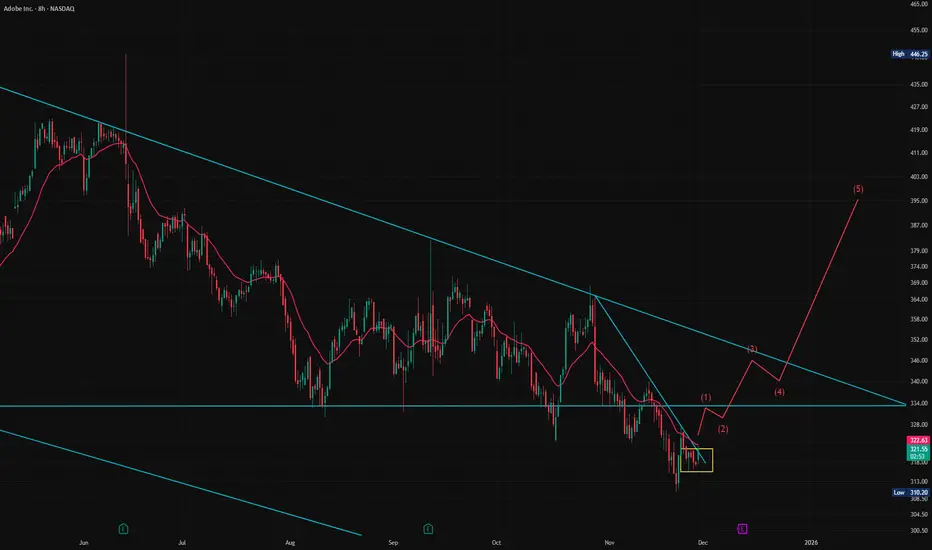
$ADBE at major supportBought NASDAQ:ADBE
Why?:
- Stretched downtrend
- At major support
- In the next years they will buy back $25 billion in shares.
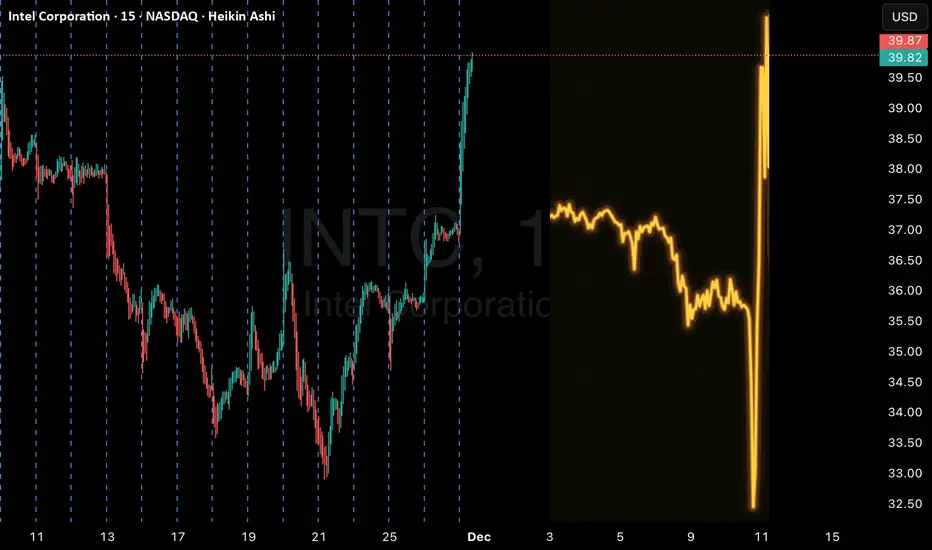
INTC Quant signals v3: Weak Movement, No Edge DetectedINTC — QuantSignals Katy 1M Trading Information (2025-11-27)
🚀 Katy AI Stock Analysis
Symbol: INTC
Current Price: $36.95
📈 Katy Forecast
Final Prediction: $36.84 (–0.29%)
30min Target: $36.93 (–0.05%)
Trend: NEUTRAL
Confidence: 40% (Low)
Volatility: 50.1% (High)
⚠️ Trade Signal Status
No trade signal generated
— Move size too small and confidence below QS threshold.
📊 Summary
From 1 analysis, Katy generated 0 actionable trading signals.
INTC remains in a low-conviction, low-movement zone with high volatility but no clear direction.
It's a time for NTSK - 40% potential profit - 25.80 USDOn the 4-hour chart, a strong prior downtrend is visible, which pushed the price into the 18–19 USD zone. In this area, the price began to react positively, suggesting the formation of a local bottom and the emergence of buying pressure near a key support zone. This level has previously attracted buyers, increasing the probability of a technical rebound.
The price is currently trading near recent lows, and the downward momentum is clearly weakening. Candlesticks are beginning to form a short-term consolidation pattern, which often represents the early stage of a trend reversal or corrective bounce. Additionally, the price is approaching short-term moving averages from below; a breakout above them could generate a bullish technical signal.
The RSI indicator is positioned near oversold levels and is attempting to turn upward, which suggests the market may be exhausted from selling pressure. Historically, such conditions frequently result in a technical recovery, especially when price holds above a strong support zone. A rising RSI combined with stabilization in price may serve as an early sign of improving market sentiment.
The projected upside target around 25.80 USD is based on previous resistance zones and the expected corrective wave following the strong sell-off. This level represents a logical technical target as it previously acted as a significant supply zone. If buying momentum continues and the price breaks above local resistance levels, a move toward the 25.80 USD area remains a realistic bullish scenario.
Overall, the technical setup suggests the stock may be entering an accumulation phase after a sharp decline. Key confirmation will come from price holding above current support and breaking moving averages to the upside. Such behavior would strengthen the probability of continuation toward the 25.80 USD resistance zone.
Potential TP: 25.80 USD
⚠️ Disclaimer
This analysis is for educational and informational purposes only and does not constitute financial or investment advice. Financial markets involve risk, and past performance is not indicative of future results. Always conduct your own research or consult with a licensed financial advisor before making any investment decisions.

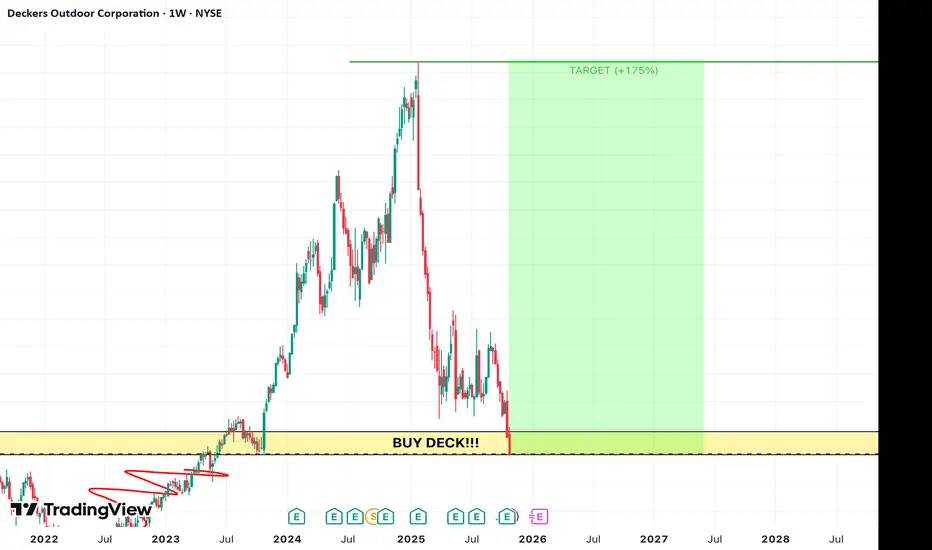
ALL-IN DECK!!!!Boys let's go ALL-IN!!!! Reversal expected from this level. Many stocks dropping giving us a chance to get them for cheap.
MSTR Weekly Alert: High-Risk Put Setup with Katy Conflict SignalMSTR QuantSignals V3 — Weekly Signal (2025-11-28)
Model: STR (V3 Weekly)
Expiry: 2025-12-05 (7 Days)
Direction: PUT (SHORT)
Confidence: 55% (Low-Moderate)
Risk Level: 🔴 HIGH
📈 Core Signal Data
Strike Focus: $175.00
Entry Range: $4.33
Target 1: $6.50
Stop Loss: $3.25
Weekly Momentum: BULLISH (+1.42% 1W)
Options Flow: Bullish (PCR 0.74)
Composite Bias: -0.17 (Neutral)
Volatility: Elevated (gamma-sensitive week)
⚠️ Note: This is a SPECULATIVE signal due to conflicting indicators and short expiration.
🎯 TRADE RECOMMENDATION
Direction: BUY PUTS
Confidence: 55%
Conviction Level: SPECULATIVE / HIGH-RISK
⚠️ KATY-LLM CONFLICT DETECTED
Type: DIRECTION Conflict
Severity: HIGH
LLM Recommendation: BUY CALLS
Katy Prediction: BUY PUTS (-4.19% projected move)
Katy Confidence: 50%
Forecast: Price decline toward $176.12 (-3.35%)
Signal Resolution:
Follow Katy’s direction — consistent bearish trajectory across 168 prediction points.
🧠 Analysis Summary
Katy AI Forecast
Neutral trend label but clear bearish price slope.
Forecast path shows persistent decline → $176.12 target.
50% confidence = neutral designation, but directionally consistent.
Technical Analysis
Bearish:
VWMA: -0.82%
Volume: 1.5× expansion → confirms selling
Bullish:
Weekly performance +1.42%
Key Levels:
Resistance: $184.97
Support: $176.12 (Katy target)
News & Macro
Neutral news environment.
MSTR remains heavily correlated to Bitcoin.
BTC holding key levels → may dampen downside or accelerate it.
Options Flow
PCR 0.74 → bullish flow bias
Highest volume at $110 calls → speculative, not strong directional commitment
Flow contradicts Katy’s bearish model
