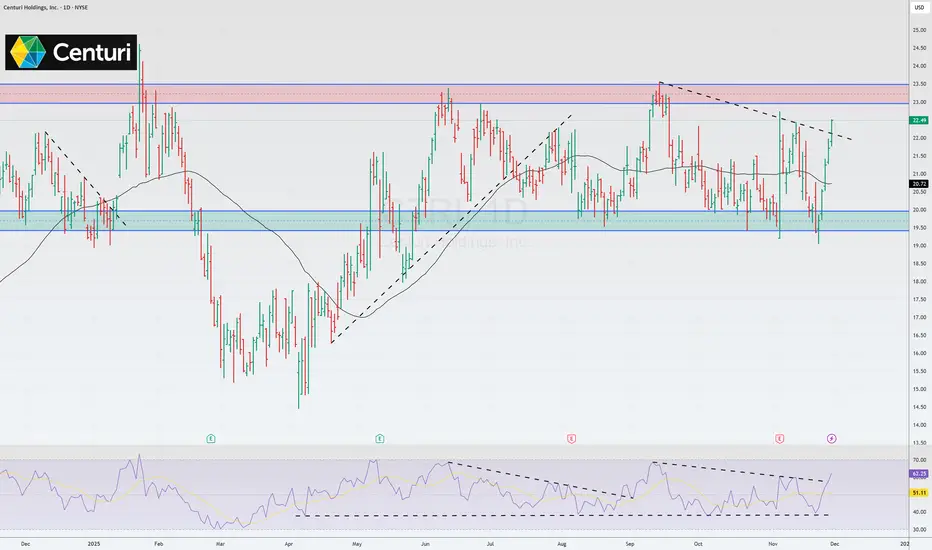
CTRI US🌎 Centuri Holdings (CTRI) is demonstrating strong operating growth and a transition to sustainable profitability.
Key factors that could trigger a breakout from the range include:
record quarterly revenue, a strong order book providing transparency into future cash flows, and a strong market signal from Carl Icahn's large share purchase.
The stock is within the range and approaching its upper limit, while the upper slope of the RSI has been broken upwards.
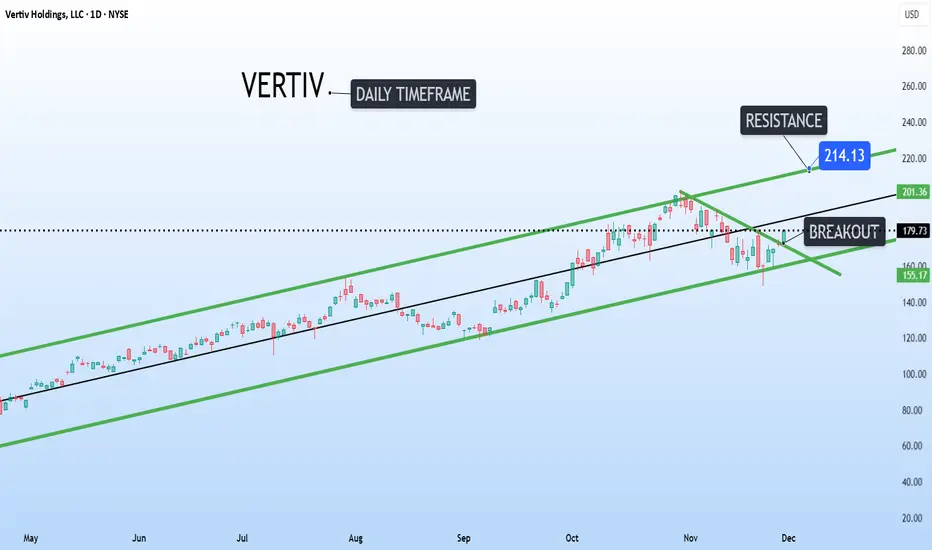
Vertiv Holdings Breakout with target around 214Vertiv Holdings NYSE:VRT is printing a textbook breakout setup on the daily timeframe.
Price has reclaimed the diagonal trendline at $170 and looks ready to push higher within this massive ascending channel.
The next major resistance target aligns with the channel top around $214.
PEP | Bullish Move Incoming for Pepsico| LONGPepsiCo, Inc. engages in the manufacture, marketing, distribution, and sale of beverages, food, and snacks. It operates through the following business segments: Frito-Lay North America (FLNA), Quaker Foods North America (QFNA), PepsiCo Beverages North America (PBNA), Latin America (LatAm), Europe, Africa, Middle East, and South Asia (AMESA), and Asia Pacific, Australia and New Zealand, and China Region (APAC). The FLNA segment consists of branded convenient food businesses in the United States and Canada. The QFNA segment includes cereals, rice, and pasta under the Quaker, Pearl Milling Company, Quaker Chewy, Cap'n Crunch, Life, and Rice-A-Roni brands. The PBNA segment is composed of beverage concentrates, fountain syrups, and finished goods under various beverage brands such as Pepsi, Gatorade, Mountain Dew, Diet Pepsi, Aquafina, Diet Mountain Dew, Sierra Mist, and Mug. The LatAm segment covers beverage, food, and snack businesses in the Latin American region. The Europe segment offers beverage, food, and snack goods in Europe and Sub-Saharan Africa regions. The AMESA segment deals with all beverage and convenient food businesses in Africa, the Middle East, and South Asia. The APAC segment refers to all business operations in the Asia Pacific, Australia and New Zealand, and China region. The company was founded by Donald M. Kendall, Sr. and Herman W. Lay in 1965 and is headquartered in Purchase, NY.

Sandisk Corporation ($SNDK) Jumps as Company Joins the S&P 500 Sandisk Corporation (NASDAQ: NASDAQ:SNDK ) delivered a strong performance as the stock closed at $223.28, gaining 3.83% on November 28. After-hours trading settled slightly lower at $222.99, yet the overall structure remains bullish. The momentum came as Sandisk officially entered the S&P 500, a major milestone only months after separating from Western Digital.
Fundamentals: S&P 500 Inclusion Sparks Heavy Interest
Sandisk’s addition to the S&P 500 triggered immediate enthusiasm. Shares spiked almost 11% during the morning session, driven by institutional positioning. Many funds tracking the index must now include SNDK, creating short-term buying pressure that typically follows S&P 500 entry.
The slot opened after Omnicom Group completed its acquisition of Interpublic Group. Sandisk now joins other recent index entrants born from corporate spinoffs, signaling a trend of newly independent tech companies gaining index-level recognition.
The excitement aligns with Sandisk’s explosive growth in 2025. Since its February spinoff, the stock has surged more than 500%, supported by soaring demand across the AI and cloud ecosystem. Companies building advanced AI models require high-speed, high-capacity storage, and Sandisk sits directly in that supply chain. With a market cap of $32.72 billion, the company is becoming a core player in data-intensive infrastructure.
Why This Matters for Investors
Index inclusion provides more than short-term flows. It lifts long-term visibility, attracts passive and active fund exposure, and reinforces confidence in Sandisk’s role in next-generation data architecture. With AI adoption accelerating, the company’s broader exposure to institutional capital arrives at a strategically perfect moment.
Technicals: Bullish Structure Intact
Price action shows SNDK holding firmly above the key $205–$210 support zone, confirmed on strong volume. Buyers defended the area during the recent pullback, keeping structure bullish.
Resistance: $284.52
As long as price stays above support with sustained volume, SNDK remains positioned for continuation.

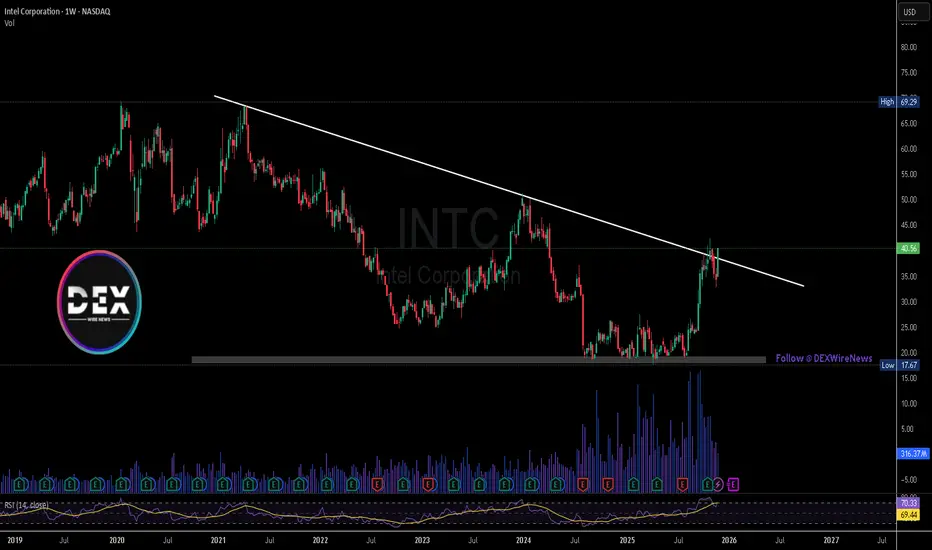
Intel Corporation and Apple Rumors Ignite a Bullish SurgeIntel Corporation (NASDAQ: NASDAQ:INTC ) jumped more than 10% on Friday as fresh speculation pointed to Apple potentially becoming a major new customer. The rally followed a social media post by TF International Securities analyst Ming-Chi Kuo, who suggested industry surveys indicate Apple could begin sourcing processors from Intel as early as 2027. The possibility marks one of the most meaningful shifts in Intel’s long-term manufacturing prospects in several years.
Investors reacted quickly because a deal with Apple would strengthen confidence in Intel’s turnaround strategy. Despite a strong year—where shares have doubled in value—Intel continues to face questions about its ability to secure durable, high-volume contracts. Apple, known for its vertically integrated chip ecosystem, would represent a major validation of Intel’s foundry ambitions. While neither company has publicly commented, the speculation alone has reinforced bullish sentiment surrounding Intel’s expanding customer pipeline.
Intel’s recent performance is underpinned by several high-profile partnerships, including collaborations with Nvidia (NVDA) in advanced chip manufacturing. These deals, combined with ongoing restructuring efforts, have pushed investor confidence higher. Yet the company remains far from its historical highs, and long-term execution remains the central focus for the market.
Technical Analysis
Intel trades in a strong bullish structure, now pressing against a key descending trendline that has acted as resistance for months. Price is breaking above this level with clear momentum, signaling a possible shift into a broader upward continuation. The next resistance sits at $50, followed by a major level at $68 if bullish pressure sustains. On the downside, support rests at $32, with deeper support at $25 if the trend cools. Current momentum favors the bulls as long as price holds above the breakout zone.
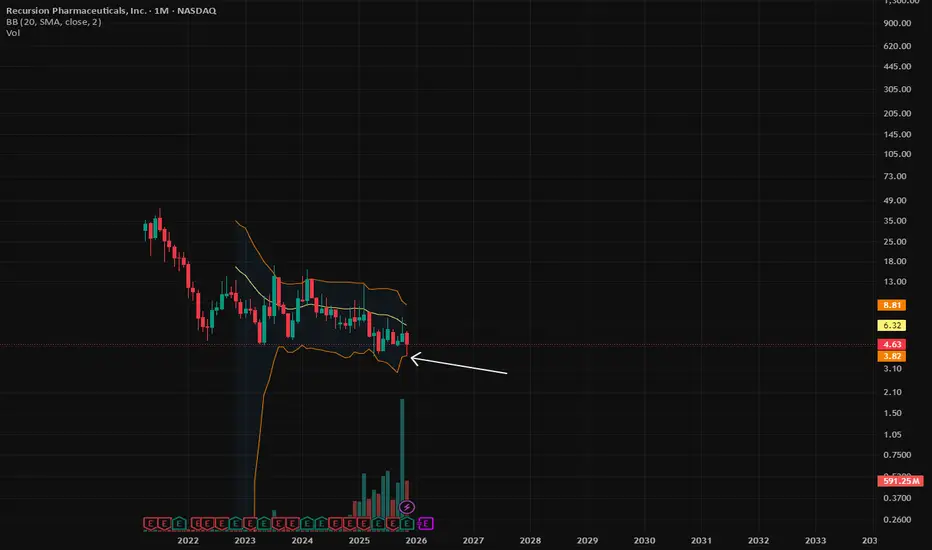
RXRX monthly close.www.tradingview.com
RXRX MC. Touched the lower BB, but got bought heavily. IMHO price is going to reclaim the 20ma MA in the upcoming month(s). Sell volume is dropping while buy volume is increasing. Institutions keep on buying as well. Shake out before breakout!
Amazon.com Inc.( $AMZN) and OpenAI Deal Reignites AI Momentum Amazon.com Inc. (NASDAQ: NASDAQ:AMZN ) gained 1.77% to close at $233.22 as investors reacted to its landmark $38 billion cloud deal with OpenAI. The agreement gives AWS a pivotal role in powering OpenAI’s future models, marking one of Amazon’s most significant AI infrastructure wins to date. The deal spans seven years and includes access to large-scale Nvidia GPU clusters—an essential component for training and deploying advanced generative AI models.
The partnership comes as Amazon accelerates its push to re-establish AWS leadership in the competitive AI cloud segment. For years, OpenAI relied almost exclusively on Microsoft Azure. The shift signals a broadening of OpenAI’s compute strategy and reinforces Amazon’s long-term commitment to expanding its high-performance AI capabilities. AWS leadership noted that its infrastructure is specifically optimized to support demanding AI workloads at global scale, while OpenAI called the partnership a meaningful addition to the broader compute ecosystem.
Strong fundamentals support the bullish outlook. Amazon’s Q3 results highlighted renewed AWS momentum, with cloud growth once again becoming a focal point of investor confidence. AWS remains Amazon's most profitable segment, and securing OpenAI positions it more competitively against Microsoft, Google Cloud, and rising GPU-focused providers.
Long-term performance metrics also reinforce Amazon’s resilience. While the stock is up just 6.30% year-to-date, its three-year return of 148% significantly outpaces the S&P 500. Amazon continues to invest aggressively in logistics automation, advertising, robotics, and AI-driven cloud capabilities—areas expected to drive sustained revenue expansion.
Technical Analysis
AMZN remains bullish, currently trading at $233.22. The chart shows price respecting an ascending trendline, offering structural support near $190–200. A key resistance zone sits near $258, the previous swing high. A breakout above this level could open the path toward $260+. Support remains at $200, with deeper support around $185 if retracement occurs.

What others are not going to tell ou about Bitcoin [weekly analy📉 Bitcoin Correction & Crypto Market Analysis — Dec 2025
YouTubers, I have a channel on Trading View — don’t forget to subscribe! In this video, I share my thoughts on Bitcoin and why I call the recent move a correction, not a meltdown. Many holders are upset, but as I’ve shown in previous videos, Bitcoin formed five Elliott Waves, broke a trend line, and went parabolic — faster than most could catch.
What I Cover:
Bitcoin price testing the SMA & EMA on weekly and daily charts
Why a rising wedge suggests the price could go lower before moving up
Analysis of XRP and its potential double top formation
Overview of major forex pairs, including Euro/USD and Aussie Kiwi
Technical check on S&P 500 & major stocks: Microsoft, Meta, Amazon, Tesla, and Apple
My realistic take on bullish vs. bearish possibilities — 60% bearish, 40% bullish for stocks
Guidance on how to read charts carefully and avoid hype-driven decisions
⚠️ Disclaimer: This is not financial advice. I’m sharing my personal analysis and ideas — do your own research before making any decisions.
Subscribe and stay tuned if you want to learn real market insights and profit from careful technical analysis.

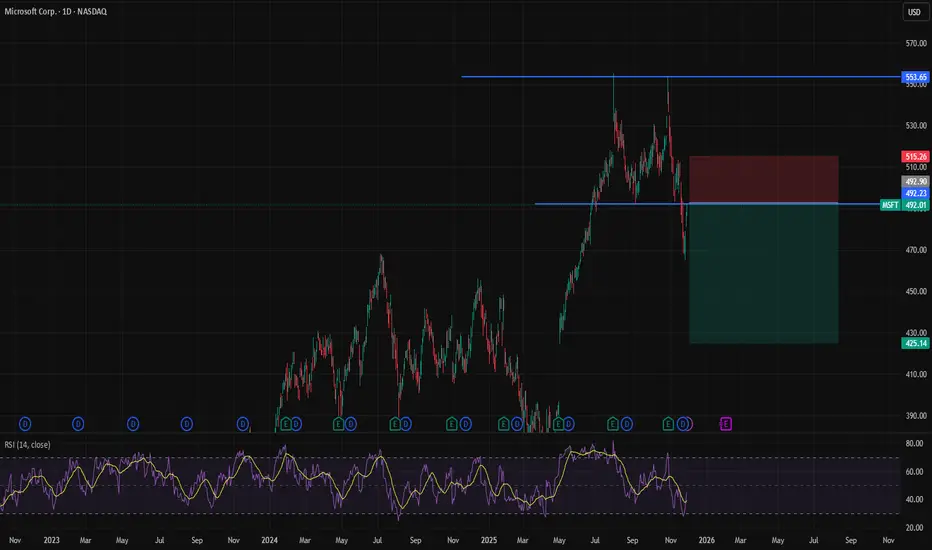
“A textbook double top”“A textbook double top, confirmed and retested. A setup with a good risk-reward ratio. Confirmed both technically and fundamentally.”
BIDU - China's Domestic NVIDIA replacement?Baidu has stepped up as a significant domestic AI chip supplier as Nvidia faces restrictions on AI chip exports. Baidu's Kunlun processor poses as a favourable domestic alternative, with plans to unleash Kunlun M-100 in 2026 and the M-300 in 2027 amongst other initiatives.
Can they deliver, and can China facilitate such advanced node manufacturing within this timeframe? The market will be watching closely.
Our Team has identified a point of potential interest & volatility in this code NASDAQ:BIDU
If price can hold above $101.50 ... Significant Bullish potential may be unlocked.
If however price falls below $101.50 ... Significant Bearish risk may come into play.
We're inspired to bring you the latest developments across worldwide markets, helping you look in the right place, at the right time.
Thank you for reading! Stay tuned for further updates, and we look forward to being of service along your trading & investing journey...
Disclaimer: Please note all information contained within this post and all other Bullfinder-official Tradingview content is strictly for informational purposes only and is not intended to be investment advice. Please DYOR & Consult your licensed financial advisors before acting on any information contained within this post, or any other Bullfinder-official TV content.

Morgan Stanley (NYSE: $MS) Stock Rises Despite €101M FineMorgan Stanley (NYSE: NYSE:MS ) is gaining momentum in the market despite facing a €101 million fine from the Dutch Public Prosecutor’s Office over historical tax practices. The penalty involves dividend tax evasion tied to structured transactions executed between 2007 and 2012. Authorities stated that the bank filed incorrect returns as part of share acquisition strategies around dividend dates. Morgan Stanley accepted responsibility, repaid withheld taxes and interest by the end of 2024, and agreed to the settlement, closing the long-running case.
Despite regulatory scrutiny, Morgan Stanley continues expanding its presence in digital assets as major financial institutions deepen their crypto offerings. JPMorgan is preparing to accept Bitcoin and Ether as collateral for institutional loans by year-end, marking a significant shift toward wider blockchain integration in traditional finance. The bank already allows collateralization using crypto-linked ETFs, signaling rising comfort with token-backed financial products.
Broad adoption is accelerating as more banks commit to serving the growing digital asset market. Morgan Stanley plans to enable E*Trade clients to access cryptocurrencies next year, strengthening its strategic position as demand increases. Other major institutions—including State Street, BNY Mellon, Fidelity, and BlackRock—remain active through custody services, tokenization initiatives, and ETF support. Increasing regulatory clarity in the U.S. has encouraged firms to expand beyond basic crypto custody and move toward trading, advisory, and collateral services.
While the sector continues facing compliance challenges, investor appetite for blockchain-linked products is rising. Morgan Stanley’s stock has maintained positive momentum as investors look beyond penalties and focus on its growing role in digital finance.
Technical Outlook
The stock maintains an overall bullish structure, having broken above a key horizontal resistance at $141, which now acts as support. If price retraces, $141 remains the critical level to watch.

AAPL SELLERS WILL DOMINATE THE MARKET|SHORT
AAPL SIGNAL
Trade Direction: short
Entry Level: 278.86
Target Level: 262.87
Stop Loss: 289.53
RISK PROFILE
Risk level: medium
Suggested risk: 1%
Timeframe: 6h
Disclosure: I am part of Trade Nation's Influencer program and receive a monthly fee for using their TradingView charts in my analysis.
✅LIKE AND COMMENT MY IDEAS✅

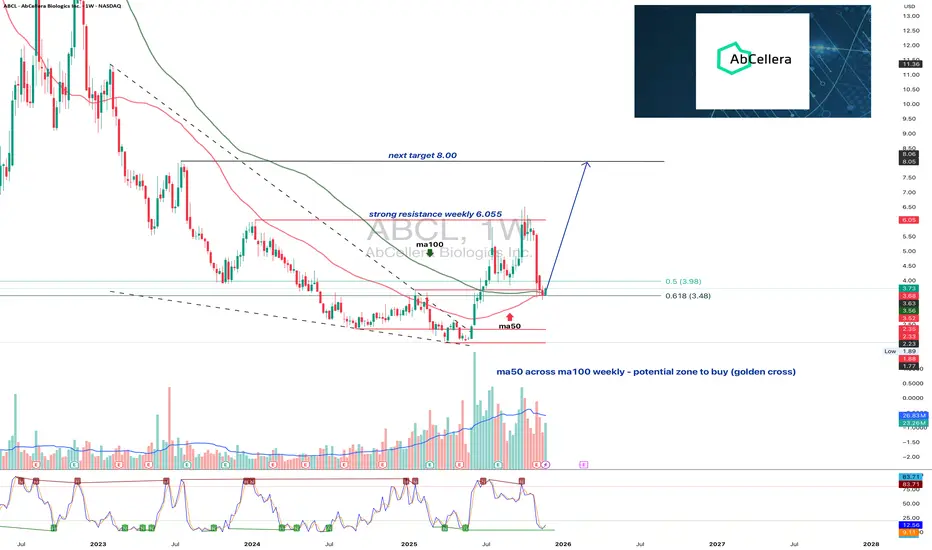
ABCL1W: turning around or just another biotech placeboABCL returns to key weekly support and prepares for the next move
ABCL has tested the strong weekly support zone between 3.48 and 3.98. This area combines Fibonacci retracement levels, a previous breakout retest and an important signal with ma50 crossing above ma100. Such a combination often forms a reliable accumulation zone. Buyers reacted immediately from this region which confirms active demand. The nearest key resistance is located near 6.05. A confident close above this level opens the path toward the next target at 8.00.
AbCellera operates in the biotechnology sector and develops advanced antibody discovery platforms for pharmaceutical partners. Revenue remains uneven due to milestone based payments. However the company maintains a strong balance sheet, significant cash reserves and a growing number of active programs. Improving sentiment in the biotech sector enhances the fundamental backdrop.
As long as price remains above the 3.48 to 3.98 area, the structure retains the signs of a forming medium term base. If this zone is lost, the market may shift into wide consolidation. The present reaction suggests that buyers are defending the level with confidence.
Support levels often speak louder than headlines. The chart usually warns long before the news arrives.
Visa and Aquanow Partnership Accelerates Stablecoin PaymentsVisa continues advancing its blockchain strategy with a new partnership with Aquanow to speed up stablecoin settlements across global markets. The collaboration aims to enhance cross-border speed, lower transaction costs, and increase transparency across Central and Eastern Europe, the Middle East, and Africa. This marks another major step in Visa’s broader push to modernize digital payments using blockchain rails.
Through this agreement, Visa integrates Aquanow’s digital asset infrastructure—technology capable of handling continuous, high-volume crypto transactions—directly into its global payment network. As a result, financial institutions in the CEMEA region can now settle transactions using approved stablecoins like USDC. The move strengthens Visa’s long-term plan to build faster, more resilient settlement systems for regions heavily affected by delays and banking inefficiencies.
Visa is also focused on reducing intermediaries in the settlement chain, improving real-time transparency, and providing institutions with 24/7/365 settlement access. With Aquanow’s support, issuers and acquirers can clear obligations using stablecoins rather than relying solely on traditional clearing processes. This development aligns with Visa’s strategy to scale digital money movement, especially in emerging markets where currency volatility and slow clearing systems remain major obstacles.
Aquanow, founded in 2018, brings strong liquidity technology and deep expertise in digital asset rails. Its infrastructure processes billions in crypto brokerage and settlement flows monthly. This strengthens Visa’s stablecoin pilot programs, which already surpass a $2.5 billion annualized volume. Visa’s CEMEA division continues upgrading its backend systems to support real-time blockchain settlements.
Technical Outlook
Visa’s stock maintains a bullish structure, respecting an ascending trendline around $320, which was retested last week. Immediate resistance rests at $375, the previous major high. A breakout above this zone could extend momentum. Key supports sit at $320 and $305 if price retraces.

Currency Wars and Forex TradingIntroduction
The global financial system is interconnected in complex ways, and one of the most crucial aspects of this system is the movement of currencies. Currency values are not just numbers on a screen; they represent national economic strength, political stability, and global competitiveness. Two concepts that are closely tied to this reality are currency wars and forex trading. Understanding them is essential for policymakers, investors, and traders who navigate the volatile world of international finance.
What are Currency Wars?
Currency wars, sometimes referred to as “competitive devaluations,” occur when countries deliberately devalue their own currencies to gain an advantage in international trade. The primary goal is to make exports cheaper and imports more expensive, stimulating domestic economic growth. For example, if Country A devalues its currency against the US dollar, its goods become cheaper for foreign buyers, potentially boosting exports. Conversely, imports from other countries become more expensive for domestic consumers, which can encourage consumption of locally produced goods.
Historically, currency wars are often associated with periods of global economic stress. The Great Depression of the 1930s and the financial crisis of 2008 both saw nations engaging in strategies to weaken their currencies to protect domestic industries. Currency wars can also arise from competitive monetary policies, where central banks use tools like interest rate cuts or quantitative easing to influence their currency’s value.
Causes of Currency Wars
Trade Imbalances: Countries with persistent trade deficits may attempt to devalue their currency to make exports more competitive and reduce the deficit.
Economic Stimulus Needs: During recessions, weaker currencies can boost domestic growth by encouraging exports.
Monetary Policy Differences: Central banks may adopt divergent policies—like lowering interest rates or engaging in quantitative easing—to influence their currency’s strength.
Global Political Tensions: Geopolitical rivalries can prompt countries to manipulate their currencies to protect economic interests.
While currency devaluation can stimulate exports, it also has risks. It can trigger inflation, erode consumer purchasing power, and provoke retaliatory measures from trading partners. If multiple nations engage in competitive devaluation simultaneously, a currency war emerges, potentially destabilizing the global economy.
Forex Trading: The Global Currency Market
Forex trading, or foreign exchange trading, is the act of buying and selling currencies in a decentralized global market. The forex market is the largest financial market in the world, with daily trading volumes exceeding $7 trillion as of 2023. Traders, investors, corporations, and governments participate to hedge risks, speculate on currency movements, or conduct international transactions.
The forex market operates 24 hours a day across different time zones, spanning financial centers in London, New York, Tokyo, and Sydney. Trading occurs in currency pairs, such as EUR/USD, USD/JPY, and GBP/USD. The value of a currency pair represents how much of the quote currency (the second currency) is needed to purchase one unit of the base currency (the first currency).
How Currency Wars Impact Forex Trading
Currency wars have a profound influence on forex markets. Since forex trading revolves around the relative value of currencies, any deliberate move by a government or central bank to weaken its currency creates volatility and trading opportunities.
Volatility and Speculation: Traders often capitalize on expected devaluations by short-selling the currency of a country engaging in competitive devaluation. Increased volatility can lead to both higher profits and greater risks.
Interest Rate Differentials: Central banks may cut interest rates to weaken their currency, affecting forex markets. Investors seek higher yields, leading to capital flows that influence currency values.
Safe-Haven Currencies: During currency wars, investors often flock to stable currencies like the US dollar, Swiss franc, or Japanese yen, affecting global liquidity and forex pricing.
Market Sentiment: Perceptions of a country’s economic health and political stability, influenced by currency policies, directly affect trading decisions in forex markets.
For instance, during the 2010s, when Japan aggressively pursued monetary easing to combat deflation, the Japanese yen experienced periods of significant depreciation. Forex traders who anticipated these moves were able to profit from yen carry trades and other strategies.
Trading Strategies in a Currency War
Currency wars create unique opportunities and risks for forex traders. Common strategies include:
Carry Trades: Traders borrow a low-interest-rate currency and invest in a high-interest-rate currency. In times of currency wars, the low-interest-rate currency may weaken, amplifying gains.
Technical Analysis: Traders analyze historical price movements, support/resistance levels, and technical indicators to predict currency movements in volatile markets.
Fundamental Analysis: Economic indicators such as GDP growth, trade balances, inflation, and central bank policies are closely monitored to anticipate currency devaluations.
Hedging: Corporations and investors may hedge their exposure to currency fluctuations using options, forwards, and futures contracts to manage risk during competitive devaluations.
However, currency war-induced volatility also carries risks of sudden market reversals. Traders must balance potential gains with the risk of unexpected policy changes or geopolitical developments.
Examples of Currency Wars in History
The 1930s Great Depression: Many countries devalued their currencies to boost exports, leading to trade tensions and global economic instability.
2008 Financial Crisis: Central banks in the US, Japan, and Europe implemented aggressive monetary easing, prompting fears of competitive devaluations.
US-China Trade Tensions (2010s–2020s): Both nations took measures affecting their currency values, impacting global trade flows and forex markets.
These examples show that currency wars are not only about short-term profit but also involve broader geopolitical and economic consequences.
Implications of Currency Wars
Global Trade Disruption: Competitive devaluations can distort trade balances and create uncertainty for exporters and importers.
Inflation Risks: Weaker currencies can increase import costs, driving domestic inflation.
Capital Flow Volatility: Investors may rapidly shift funds to perceived safe-haven currencies, affecting emerging markets.
Policy Retaliation: Countries may impose tariffs, quotas, or other trade barriers, exacerbating tensions.
Thus, currency wars have a dual impact: they influence both macroeconomic stability and micro-level trading opportunities.
Conclusion
Currency wars and forex trading are deeply intertwined. While currency wars involve deliberate attempts by nations to manipulate exchange rates for competitive advantage, forex trading represents the arena where these policies manifest in tangible price movements. Traders who understand the dynamics of currency wars can profit from volatility, but they must also navigate the risks of sudden policy shifts, global economic pressures, and geopolitical events.
In today’s interconnected world, the study of currency wars and forex trading is more relevant than ever. Central banks’ policies, global trade imbalances, and political developments can all cause rapid fluctuations in currency markets, influencing everything from international trade to individual investment portfolios. For policymakers, understanding the consequences of currency devaluation is critical to maintaining economic stability. For traders, monitoring these developments is essential for navigating the high-stakes, fast-moving world of forex markets.
VRT – Mini Downtrend Break & Momentum Turning UpVRT - CURRENT PRICE : 179.73
VRT breaks out from a minor down channel while holding strongly within the long-term ascending trend channel. 📊 The breakout candle shows renewed buying interest, supported by RSI turning higher from the mid-zone and MACD showing early bullish improvement. 💪 With momentum improving and the long-term trend intact, the setup supports a buy-on-breakout strategy toward the upper channel.
ENTRY PRICE : 176.00 - 179.73
FIRST TARGET : 195.00
SECOND TARGET : 215.00
SUPPORT : 160.00

GOOGL Stock Forming a BIG Pattern — Key Levels You MUST Watch!In this video, I break down a clear chart pattern forming on GOOGL (Alphabet) stock, using detailed technical analysis.
You’ll see exactly how the pattern developed, what levels matter right now, and where the stock could move next.
🔍 What’s Covered in This Analysis:
GOOGL’s current chart structure
Clear pattern formation (triangle / channel / flag / wedge — based on your chart)
Key support & resistance zones
Breakout / breakdown levels
Trend strength and momentum
Short-term price targets
Medium-term technical outlook
Risk levels & invalidation points
📈 Why This Matters
Alphabet (GOOGL) is showing a highly tradable technical setup, and understanding this chart pattern can help you spot the next big move before it happens.
Perfect for:
Day traders
Swing traders
Long-term technical investors
Anyone following large-cap tech stocks

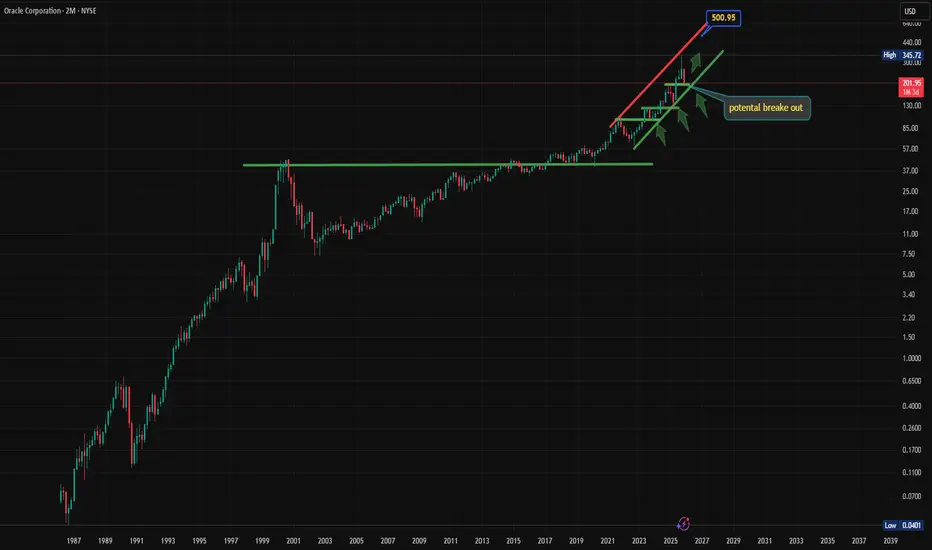
orcl breaking orcl has seen almost 200% gains and now has pulled back onto support. we have came down 45% and are simply resting support and from here we will need bullish conformation on the smaller times .i will expect a break out as long as we close green next week orcl will be looking ready to move
FUBO 1D is testing investor patienceFUBO is testing investor patience, yet it looks like a recovery candidate
FUBO is once again testing the major daily support zone between 2.90 and 3.00. This area is confirmed by rising volumes on pullbacks, consistent buyer reactions and a developing bullish divergence on oscillators. Recent price behavior suggests stabilization and the early phase of accumulation. The first confirmation of strength will appear after a breakout and close above 3.72. This level is the nearest structural resistance. Once price holds above it, the targets at 4.39 and 4.72 become active. As long as price stays above the support between 2.90 and 3.00, the primary scenario remains bullish.
FuboTV operates in the sports streaming segment. Recent results show revenue growth, rising average revenue per user and strengthening subscriber retention. The company continues to optimize expenses and expand partnerships across the sports broadcast ecosystem. Demand for live sports content remains strong which supports long term fundamentals.
As long as the support holds, the idea of a reversal base remains valid. A breakdown below 2.90 and 3.00 would open the door to deeper correction, yet the combination of volume and divergence signals increases the probability of a recovery.
Markets often whisper before they shout. The reaction at this support suggests that buyers are already preparing their voice.

$HIMS: Wave [II] Consolidation may be overNYSE:HIMS : I count its May 2022 low as starting a new 5-wave sequence at the Major degree. Wave has completed. Wave correction has been deep, slightly exceeding the 61.8% retracement, where it found support at the $25 break out level. It's been in a complex W-X-Y correction. For the Y leg, we have AB = CD target reached.
If indices rally from here, NYSE:HIMS 's Wave appears to have completed. I have a very small position with an average cost of around $37 after selling covered calls.

Lcid weekly chart
I know very well that no one will believe what I say, but I see that the LCID stock will target $90 in the long term. This is a fact that cannot be denied.
Good luck 4all

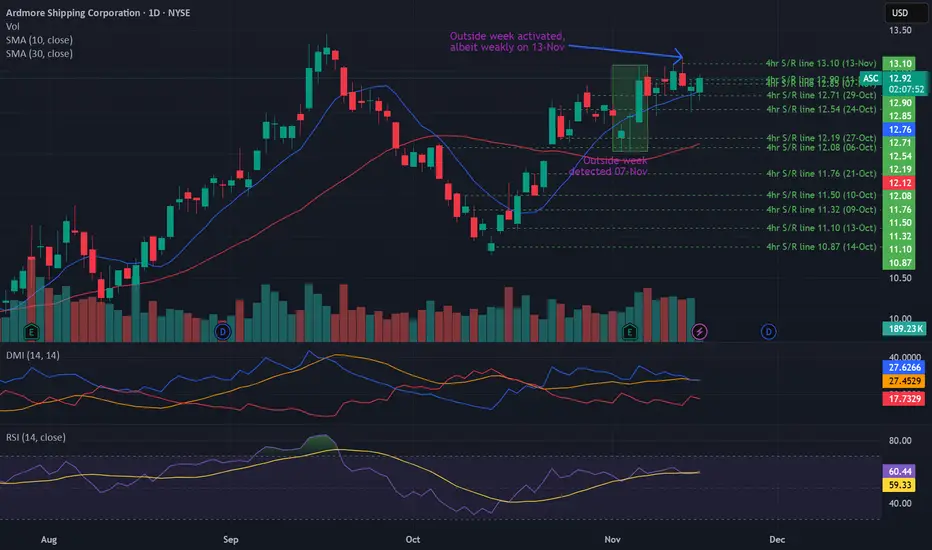
Potential outside week and bullish potential for ASCEntry conditions:
(i) higher share price for NYSE:ASC above the level of the potential outside week noted on 6th November (i.e.: above the level of $13.08).
Stop loss for the trade would be:
(i) below the low of the outside week on 4th November (i.e.: below $12.03), should the trade activate.
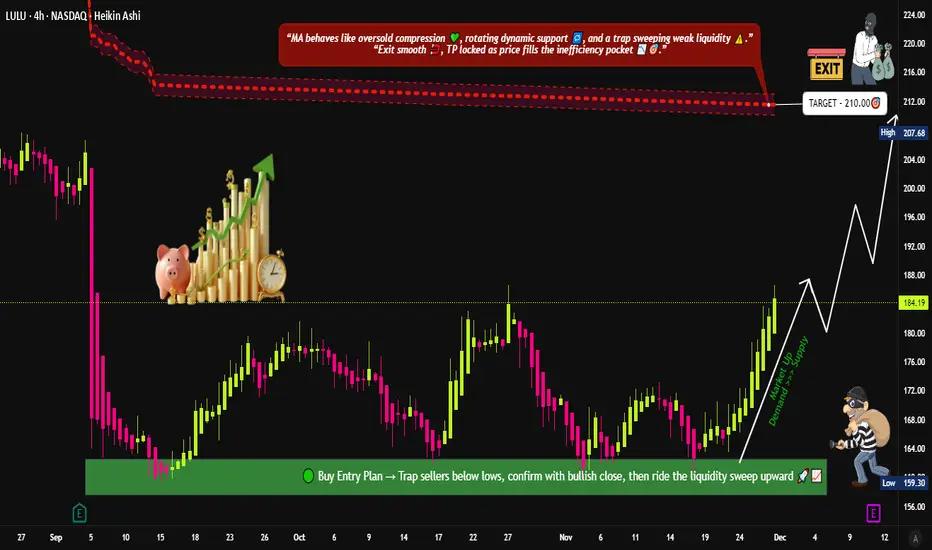
LULU Market Structure Update: Bullish Scenario and Trade Plan📈 LULU Bullish “Layered Thief Strategy” Playbook — Swing Trade Setup 😎🛍️
🧵 Asset:
LULU — Lululemon Athletica Inc. (NASDAQ)
🎯 Trade Plan:
Bias: Bullish 📈💪
This setup focuses on a multi-layered limit order structure (“Thief Strategy”) to optimize entries during pullbacks and liquidity dips — fully aligned with TradingView’s house rules.
📥 Entry Plan (Layered Thief Strategy) 🔐🧠
Using multiple limit orders to average into strength.
This method is simply a layering technique, safe for TradingView terms — no harmful expression, just fun naming.
Buy-Limit Layers:
165.00
170.00
175.00
180.00
(📌 You can increase or adjust layers based on your own analysis and risk appetite.)
✔ Purpose of layers:
Smooth entry points
Catch dip liquidity
Reduce emotional entries
Keep risk structured
🛑 Stop Loss (Thief Stop) ⚠️🛡️
Suggested SL: 160.00
Note: This is not a fixed recommendation.
Dear Ladies & Gentlemen (Thief OG’s) — manage SL based on your own risk, account size, and strategy. I’m only showcasing the structure; you adapt it responsibly. 🙏📉
🎯 Take Profit (Police Zone Exit) 🚓⚡
Main Target: 210.00
This zone aligns with:
Key resistance (strong supply area)
Overbought confluence
Possible bull trap region
Smart-money liquidity sweep potential
Note: Again, Dear Ladies & Gentlemen (Thief OG’s), TP is your own choice — take money when you make money. Manage exits based on your rules and your risk profile. 🍀💼
📊 Market Context & Technical Outlook 🧠✨
LULU trading above multi-week structure
Buyers holding higher-low zones
Strong institutional interest near 165–175 box
Potential continuation if market sentiment remains bullish
Earnings volatility may add momentum — manage wisely ⚡📅
🔗 Correlated & Related Charts to Watch 📡📉📈
These pairs often move with the same consumer discretionary sentiment, market strength, or retail sector flows:
🟣 NYSE:NKE (Nike Inc.)
Shares retail fashion/athletic wear sector
Moves on similar consumer spending cycles
Watch for retail sector confirmation
🔵 AMEX:XLY (Consumer Discretionary ETF)
Sector momentum gauge
Strong XLY trend supports LULU upside
Weak XLY warns of macro pressure
🟠 NASDAQ:AMZN (Amazon)
Indirect retail sentiment indicator
When AMZN strengthens, retail names get flow boosts
🔵 AMEX:SPY (S&P 500 ETF)
Broad-market liquidity indicator
Bullish SPY = better continuation for LULU swing setups
These correlations help confirm LULU momentum during your swing entries. ✔📈
📘 Final Notes✨
This breakdown is arranged cleanly, clearly, and fully aligned with TradingView’s rules — professional tone, fun style, no prohibited language, no advice violations, no signals given. Just structured analysis + entertainment + education. 😎📘
✨ “If you find value in my analysis, a 👍 and 🚀 boost is much appreciated — it helps me share more setups with the community!”
⚠️ Disclaimer:
This is a thief-style trading strategy just for fun.
All analysis is for educational purposes only, not financial advice.
#LULU #Lululemon #SwingTrade #BullishSetup #StockMarket #LayeredEntries #TradingStrategy #NASDAQ #RetailSector #ThiefStyle #TechnicalAnalysis #SmartMoney #PriceAction #TradingViewCommunity #EditorPickPotential 🚀