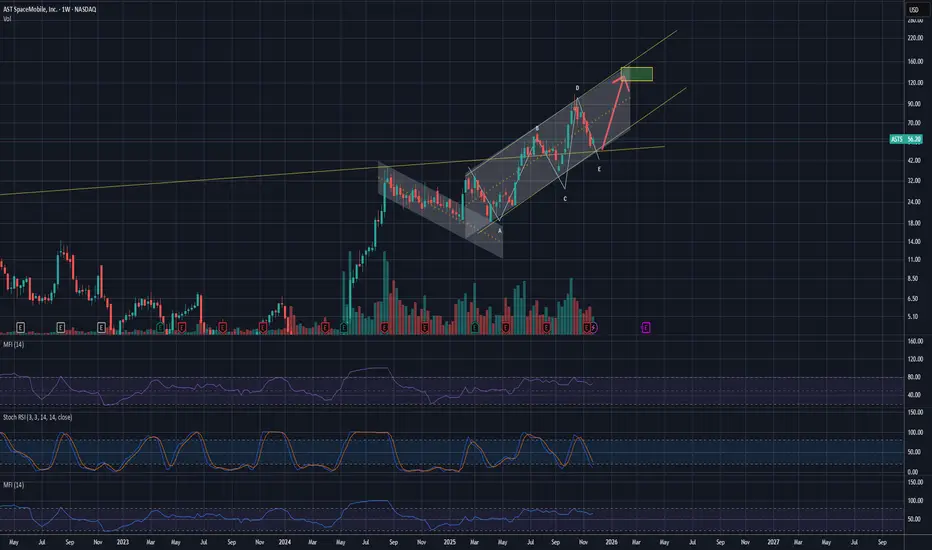
ASTS - ~ $125 possible
ABCDE inside a rising channel = bullish continuation
This usually breaks upward 80% of the time.
Why?
Because:
A = first rejection
B = bounce
C = main low
D = retest high
E = final corrective sweep
E is ALWAYS the last drop before the breakout.
E waves LOOK bearish because:
✔ they’re slow
✔ they drag down
✔ they flush weak hands
✔ they trap shorts
The current pullback is landing EXACTLY where E should land, price is pulling back to:
- Rising support line
- Mid-channel confluence
- Prior demand zone
That’s exactly where wave E belongs.
If E completes, your breakout toward $95 → $140 becomes the next target.
INVALIDATION (Hard Stop)
**If ASTS weekly closes below:
➡️ $48–$50 = Exit**
This means:
Rising channel breaks
E wave fails
Structure turns bearish
PERSONALIZED SUMMARY:
If you stick to:
- Buy the dip into the E-wave zone
- Stop under $48
- Ride the breakout to $96 → $140
- Respect the weekly structure
These observations are for educational purposes only. chart analysis — nothing here is financial advice. Please always do your own research!

ASTS - Target ~ $125
ABCDE pattern.
Upside 80% chance.
If E completes, your breakout toward $95 → $140 becomes the next target.
Invalidation = weekly close below $48–$52
Just observation. not financial advice.
Riot Platforms, Inc. (RIOT)Company Overview
Riot Platforms, Inc. stands as a vertically integrated leader within the Bitcoin ecosystem. Its core operations are strategically divided into two synergistic segments:
Bitcoin Mining: This is the company's primary revenue driver, where Riot focuses on the relentless expansion of its computational power, known as hash rate. The strategic objective here is to maximize the probability of successfully validating transactions on the Bitcoin network and earning block rewards, thereby directly leveraging Bitcoin's price and network performance.
Engineering: This segment provides a critical competitive advantage through vertical integration. Riot designs and manufactures specialized power distribution equipment and custom electrical products. This not only supports their own mining operations with enhanced efficiency and reliability but also represents a secondary revenue stream and a deep expertise in managing the immense energy demands of large-scale data centers.
Founded in 2000 and headquartered in Castle Rock, Colorado, Riot has established itself as a formidable player, further strengthened by strategic investments in companies like Verady and Coinsquare.
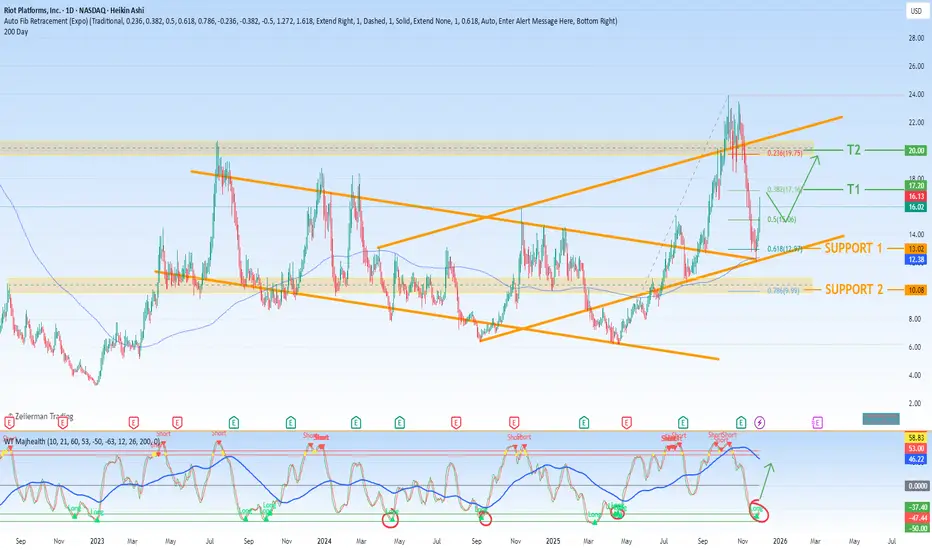
Technical Analysis & Fibonacci Framework
The current price action for RIOT can be effectively analyzed using key Fibonacci retracement levels, which identify potential levels of support (where buying interest may emerge) and resistance (where selling pressure may intensify).
Our analysis identifies two critical tiers of support and two corresponding tiers of profit-taking targets.
Primary Support Zone: The Foundation for a Reversal
The most significant demand zone, where buyer conviction is expected to be strongest, lies between the deep Fibonacci retracement levels. This zone represents a potential accumulation area for long-term investors.
Strong Support (0.786 Fib Level): $9.99
This level represents a deep retracement and is often considered a "last stand" for bulls. A successful hold here would indicate extreme selling exhaustion and could trigger a powerful reversal. It serves as a crucial line in the sand for the bullish thesis.
Significant Support (0.618 Fib Level): $12.97
Known as the "Golden Pocket," the 0.618 retracement is a classic level for trend reversions. A bounce from this area would signal that the longer-term upward trend remains structurally intact and that the current pullback is a healthy correction within a broader bull market.
Profit-Taking Targets: The Path to Recovery and Growth
Should the price find support and initiate a new upward leg, the following Fibonacci levels provide a logical roadmap for potential resistance and profit-taking opportunities.
Initial Target (0.382 Fib Level): $17.16
A rally to this level would represent a significant recovery from the support zone. This is the first major technical hurdle. A decisive break above $17.16 would signal strengthening momentum and open the path toward higher targets.
Secondary Target (0.236 Fib Level): $19.75
Achieving this price point would indicate a robust bullish reversal is fully underway, effectively negating the prior downward move. This level is a key objective for a sustained rally and would bring the stock back into a technically strong position, potentially targeting new local highs.
Strategic Outlook
In summary, RIOT is currently testing a critical juncture defined by a strong support band between $9.99 and $12.97. The reaction at these levels will be pivotal for its medium-term direction. A firm hold and reversal from this zone, particularly if supported by positive broader Bitcoin market sentiment, would validate the bullish setup and project a measured move toward initial resistance at $17.16, with a subsequent primary target at $19.75. Investors and traders should monitor price action closely within this defined Fibonacci structure.
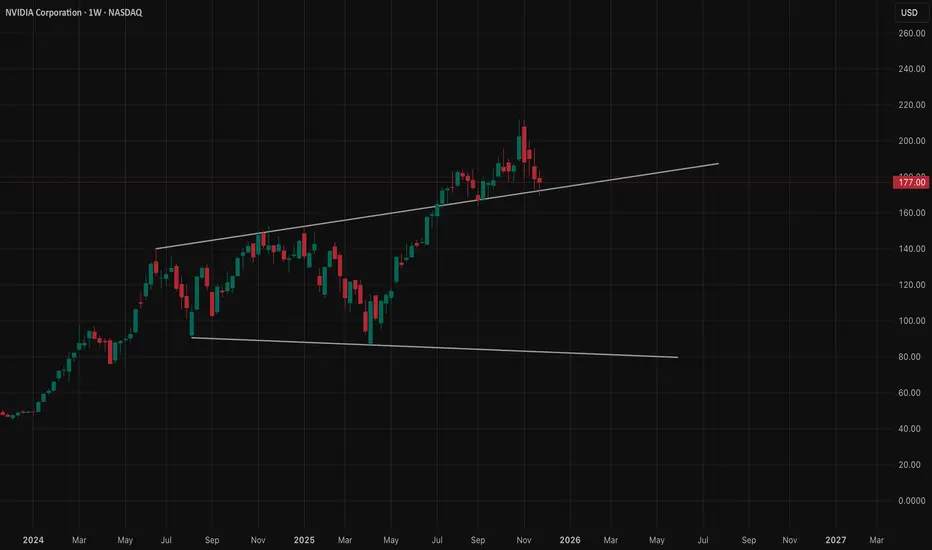
NVDA at a Decision Level – Dec 1–5 OutlookWeekly – Trend Still Up, But Losing Strength
NVDA has been riding a strong multi-month uptrend, but the last few weekly candles show the first real slowdown. A clear CHoCH formed near the recent highs, and sellers stepped in aggressively. The weekly candle closed with a long upper wick and a heavier body — signaling momentum cooling.
Important weekly zones:
* $198–200: previous weekly supply
* $176–178: weekly support where buyers stepped in
* $153–160: deeper weekly demand
* $120s: major demand if the market rolls over hard
Weekly tone → still bullish on the big structure, but fading momentum with the first signs of deeper pullback potential.
Daily – Inside a Pullback After Supply Rejection
Daily shows a sharp rejection from the supply zone near $210–215. Price broke structure downward (CHoCH), then bounced from a lower demand zone but hasn’t reclaimed the supply above.
Daily key levels:
* Resistance: $198 → $212
* Support: $177 → $172
Until price fully reclaims and holds above $198–200, NVDA stays at risk for lower continuation.
Daily tone → trapped underneath supply, struggling to regain upside momentum.
1-Hour – Sideways Grind After Breakdown
The 1H shows clean weakness:
* BOS downward
* Multiple failed retests of $182–183
* Price repeatedly rejecting the underside of the broken trendline
* Buyers only defending short-term at $176–178
The more NVDA keeps getting rejected at the same 1H resistance, the more pressure builds for a deeper dip.
Short-term 1H levels:
* Breakout: above $183 → retest $188–190
* Breakdown: below $176 → flush toward $172–170
1H tone → consolidation after rejection, leaning bearish unless buyers reclaim $183.
15-Minute – Compression Before the Next Move
The 15m chart is compressing inside a tight range after the clean BOS move earlier. This type of structure usually leads to an impulsive move.
The repeated rejection at $182–183 shows sellers defending aggressively. Buyers are only holding the short-term demand around $176–178.
15m tone → leaning bearish unless it breaks above $183 with real strength.
GEX – Options Positioning Shows the Real Pressure Points
On the NVDA GEX chart:
* Highest positive GEX: $185–187 → magnet + resistance
* 3rd CALL wall: near $190 → extension if momentum flips
* PUT walls:
* $172–175: heavy PUT support
* $160: large negative gamma zone
* $145–150: deep support if the market panics
What GEX is saying:
* Below $183, market makers lean bearish and push toward $176–172.
* A clean break above $185 can snap the chart upward into $188–190 fast due to positive gamma.
* A breakdown below $176 opens a straight path to $170–172 with momentum.
GEX aligns perfectly with the TA:
* All timeframes showing pressure from above
* GEX walls lining up with the exact levels on the 1H and 15m
* A bigger move waiting as soon as NVDA loses or reclaims the key areas
Trading Thoughts – Dec 1–5
Bullish Setup
NVDA needs a clean break + hold above $183–185.
Targets:
* Target 1: $188
* Target 2: $190 (CALL wall)
Stop zone → below $176
Call idea (only if breakout happens):
NVDA 185C / 190C, short-dated — ONLY after confirmation.
Bearish Setup
If NVDA loses $176, downside opens quickly.
Targets:
* Target 1: $172
* Target 2: $170
* Target 3: $160 (deep support on GEX)
Put idea (safer):
NVDA 172P or 170P — only valid if breakdown happens.
Overall Outlook for Dec 1–5
NVDA is sitting right at a squeeze point.
Key alignments:
* Weekly: losing momentum
* Daily: stuck under major supply
* 1H: rejecting underside of broken trendline
* 15m: compression before a direction
* GEX: clear resistance above $185 and clear support at $176 → perfect pressure map
The next move will be clean once direction confirms.
This is the type of setup where option traders shouldn’t guess — just wait for the breakout or breakdown and ride the move.
Disclaimer
This analysis is for educational purposes only, not financial advice. Always trade with proper risk management and confirmation.
TSLA at a Tipping Point – Dec 1–5 OutlookWeekly – Momentum Still Up, But Cooling
TSLA has been trending cleanly off that long-term bullish structure break from $380s. The weekly candles are still holding higher lows, but last week showed a slowdown — smaller candle body, longer top wick. That usually means buyers are still there, but not as aggressive as earlier in the run.
Important zones:
* $430–432: current reaction zone
* $474–475: next weekly supply
* $368: major weekly demand if things pull back deeper later
Overall weekly tone → still bullish, but losing steam.
Daily – Retesting the Broken Structure
Daily shows the clearest picture: TSLA rejected the supply zone above $450 and came back down to retest the broken structure around $420–425. Buyers stepped in, but it isn’t a full reversal yet. Price is still inside a broad daily supply zone.
Daily key levels:
* Resistance: $440 → $455
* Support: $422 → $412
Until price fully clears above the supply zone, TSLA has limited upside.
1-Hour – Grinding Up, But Inside a Tight Path
The 1H trend is still intact with a rising channel, but the last few candles show exhaustion near $430. Multiple touches on the upper trendline show sellers defending that area. Buyers are still pushing, but they’re losing momentum on each attempt.
The moment $426–427 breaks, downside opens quickly.
Short-term 1H levels:
* Breakout: above $432–433 → next extension $440
* Breakdown: below $426 → fast drop toward $420
15-Minute – Compression Before a Move
The 15m shows price trading sideways after a clean BOS move earlier. That compression usually leads to a quick breakout or breakdown. The fact that price keeps tapping the same resistance near $430 without clearing it shows hesitation.
The 15m favors breakout continuation IF buyers step in with volume.
Otherwise, it slips back to $426–424 easily.
GEX – Where Options Traders Force the Move
This is where TSLA becomes interesting.
On the GEX map:
* Highest positive GEX sits at $432–435 → magnet + resistance
* Second CALL wall around $450 → possible extension point
* Heavy PUT support around $410–400 → strong buyer zone
* Another deep PUT wall at $380 → major support
What GEX is telling:
* As long as TSLA stays under $432–435, market makers lean neutral-to-slightly bearish.
* If price breaks above $435 with force, gamma flow can push it into $445–450 quickly.
* If price breaks below $426, you get negative gamma momentum pushing it straight toward $415–410.
This aligns well with the TA structure — both are pointing at the same “pressure valve.”
Trading Thoughts – Dec 1–5
Bullish Setup
* Needs a clean break + hold above $432–433
* Target 1: $440
* Target 2: $450 (CALL wall)
* Stop zone: below $426
Call idea (short-dated, aggressive)
TSLA 440C or 445C — ONLY if it breaks $433 with volume.
Bearish Setup
* If price loses $426, sellers take control.
* Target 1: $420–422
* Target 2: $410 (strong GEX PUT support)
* Target 3 (bigger move): $400
Put idea (conservative)
TSLA 420P → safest
TSLA 410P → higher risk but bigger payoff
Only valid if breakdown happens, not before.
Overall Outlook for Dec 1–5
TSLA is sitting at a decision level.
Everything lines up:
* Weekly: slowing momentum
* Daily: retesting previous structure
* 1H: exhaustion underneath resistance
* 15m: compression before a move
* GEX: clear walls at $435 (cap) and $410 (floor)
The move will be clean once direction is chosen.
This setup is perfect for option traders who wait for confirmation instead of guessing.
Disclaimer
This analysis is for educational purposes only, not financial advice. Always trade with your own risk management and confirmation.

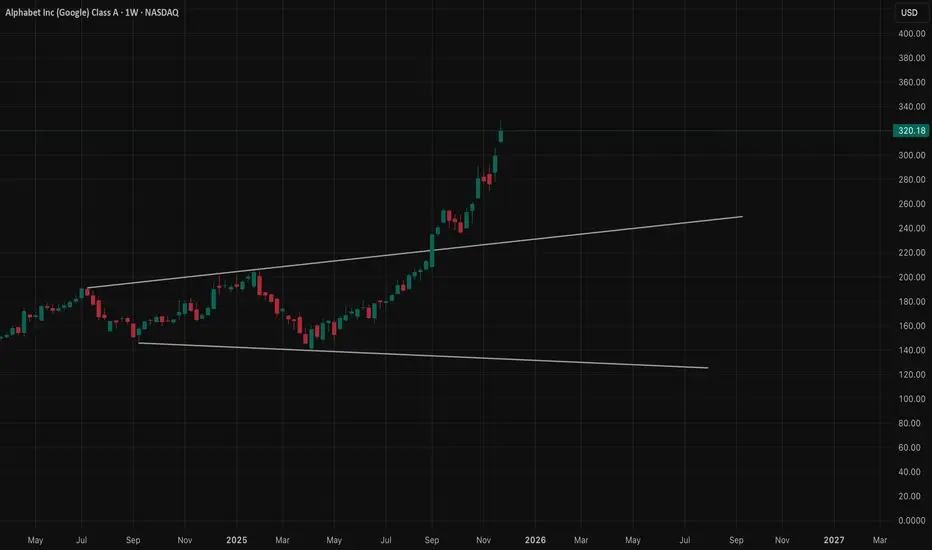
GOOGL · Dec 1–5 OutlookStretched Rally Meets Heavy Supply — Time for a Pause?
Weekly timeframe (bigger picture mood)
The weekly chart shows a monster trend. GOOGL has been riding this rising channel almost perfectly, and now price is pushing into the upper half of the channel where historically the momentum starts slowing. Candles are still green, but the bodies are getting smaller — that’s usually the market showing fatigue, not reversal.
Uptrend still intact, but the push is getting harder.
Daily timeframe (where the slowdown becomes real)
The daily chart lands right inside a clean supply zone around 323–332. Every attempt to break above that zone leaves long wicks. That’s not bearish yet — it just means sellers are active.
Volume dips here confirm one thing:
Buyers are getting tired exactly where sellers finally have the upper hand.
Whenever a strong weekly trend pushes into daily supply and stalls, that’s usually the stage before:
* a pause
* a pullback
* or a sloppy sideways grind
Not reversal… just cooling pressure.
1H timeframe (early crack in momentum)
This is where the weakness shows clearly.
Price tried to break supply, failed, and started forming lower highs directly underneath the ceiling.
That’s how uptrends slow: first the momentum dies, then structure breaks later.
There’s a small CHoCH on the 1H, meaning the market tested the bullish side and then flipped short-term control back to sellers. Trendline is still holding — but barely.
Whenever the 1H starts doing this under daily supply, the bulls usually need a “rest day.”
15m timeframe (the truth surface)
The 15m chart shows the “real” story before everyone sees it:
* Repeated rejections at the same zone
* Break of structure downward
* Retests failing
* And smaller and smaller bounces
This is the type of compression pattern that usually breaks to the downside first before anything else.
The 15m broke early.
The 1H is bending.
The daily is in supply.
The weekly is stretched.
The pieces fit.
How GEX confirms all of this
The GEX chart adds the final piece of evidence.
No need to hype — just simple cause & effect:
Major call-wall cluster: 327–335
This is thick resistance from hedging flows. Market makers get forced to hedge against upside when price enters that region, which creates downward pressure.
And guess what?
That zone lines up EXACTLY with the daily supply and the rejection levels on 1H and 15m.
Major put-magnet cluster: 312–310
Below, the heaviest put-weight sits around 312–310, which acts like a magnet if price loses 315.
So the GEX map basically says:
* “Upside is heavy and expensive near 327–335.”
* “Downside is easier if 315 breaks.”
Perfect confirmation to the TA.
Trade ideas (based on structure + GEX)
These are not signals — just how a trader would think based on the levels.
BULLISH SCENARIO (only if strength proves itself)
Trigger: Must reclaim 326 with a clean push + retest.
If that happens:
Targets:
* 330
* 332 (end of the supply zone)
* 335 (GEX wall — tough to break)
Safer call-side idea (for Dec 6 expiration):
* 325c / 330c spread
Tight risk, matches GEX resistance.
Aggressive idea:
* 330c, but only if 326 breaks with volume.
BEARISH SCENARIO (more likely unless buyers show strength)
Trigger: Break below 315
This opens the easier path where both TA and GEX want price to go.
Targets:
* 312
* 310
* 305 (if panic selling kicks in)
Put-side idea (Dec 6 expiration):
* 315p / 310p spread
Cheap, logical, and matches the GEX magnet.
Aggressive:
* 310p, aiming for the magnet flush.
NEUTRAL / SCALP IDEA (for those who don’t want directional risk)
Inside the 323–332 supply zone:
* Short calls above 332
* Short puts above 315
…because price is likely to chop until one side breaks.
This reflects the actual structure: compression between supply and short-term support.
My overall view for the week (Dec 1–5)
Everything points to a cooling week, not a runaway rally. Buyers have pushed hard for weeks, and GOOGL is finally running into an area where sellers care again.
Unless 326 breaks clean, this week favors:
* A pause
* A pullback
* Or a choppy range with bearish lean
Break of 315 = quick drop.
Break of 326 = one more push.
Disclaimer
This is not financial advice.
Educational analysis only — always manage risk according to personal trading rules.
$CDE BUll caseE after pulling back from its 52 weeks high $23.62 took support at 13.60-13.75 which has been a previous SR flip level. This zone is also Fib 0618. RSI almost hit oversold terority and bounced -back. Price made a double bottom at this support levlel and broke the neckline, moving avg 9,21 nd 50 has been reclaimed and curving upwords. RSI now aproaching 60 and MACD gave a buy signal and histogram turned positive. Volume looks decent. Multiple indicators giving buy signal ie. CE, supertrend etc. Price gapped up back to back creating daily FVG and continew to rise from there. Bulls are coming in full force. There is upside gap to be filled 19.21-20.64. Other than that there is not much resistance at all. Good buy at this price. Sector has been showing strength too.

AAPL Outlook — Dec 1 to Dec 5AAPL Outlook — Dec 1 to Dec 5
(Price Action + Multi-Timeframe Story + GEX for Options Traders)
Weekly timeframe
The weekly chart still holds its long-term uptrend, but you can tell momentum is cooling off. The candles are getting smaller as price pushes toward the upper trendline, which usually means buyers are running into an area where profit-taking becomes more attractive. Nothing bearish yet—just a sign that the push is losing steam.
Daily timeframe
The daily view fits that slowdown perfectly. Price is sitting right inside a supply zone that was created during the last big push. Ever since AAPL entered this zone, the market hasn’t shown a strong follow-through candle. Instead, it’s been chopping inside 276–280.
The first little shift in character already appeared, which tells you sellers are at least testing the waters.
The weekly hints “momentum is fading,” and the daily basically confirms, “yes, we’re stuck under some pressure.”
1-Hour timeframe
Dropping into the 1H makes the battle more obvious. Price keeps rejecting the same ceiling near 279–280 again and again. Even though the trendline from below is still supporting the move, the highs are getting slightly lower each attempt. That’s usually the first sign that buyers are defending, but they’re not dominating anymore.
So now all three timeframes are telling the same story:
Uptrend intact → momentum slowing → pressure at the top.
15-Minute timeframe
The 15m chart is where you can really see how tight things have become.
Price is compressing right underneath that ceiling. Volume is tapering off, candles are getting smaller, and every bounce looks weaker than the last.
This kind of behavior usually means the market is coiling up for a move—either a clean breakout above 280 or a release to the downside if the base around 277.50 gives out.
The smaller the timeframe, the more it reveals what the bigger timeframes were already hinting.
Where GEX Fits Into All of This (the real edge)
Now here’s where everything clicks:
All timeframes point to the same resistance near 279–280.
When you overlay the options data, the biggest call wall also sits right there. That’s the level where dealers hedge the most aggressively, which naturally creates resistance—and it just so happens to line up with the zones that the charts have already shown.
Below that, the negative gamma area starts opening up around 276–274.
This means that if price slips under that base, dealers shift into selling hedges, which increases volatility and makes pullbacks move faster.
So the charts show the structure…
GEX shows the “fuel” behind the structure.
That’s why I like combining them: the price action tells the story, and GEX tells you who’s on the other side of the trade.
Trading Bias for the Week (Options + Price Action)
Upside idea
Only valid if 280 breaks clean. If that happens, the next magnet is around 282.5 where the next batch of calls cluster.
Downside idea
If 277.50 cracks, the move usually releases toward 276, then 274.
That lines up with both the lower timeframe CHoCH and the negative gamma pocket.
Final Thoughts
Each timeframe is showing the same thing, just in different levels of detail: the trend is still healthy, but buyers are clearly struggling at the top. GEX reinforces why price behaves that way and gives option traders the roadmap for the week.
Disclaimer:
This is not financial advice. This is just my personal market observation and for educational use only.

THIS IS TESLA'S CHANCE TO RALLY! WILL IT HAPPEN NOW OR IN 2027?New evidence on Tesla stock shows that this is Tesla's final chance to rally for this market cycle of 2022-2026. We discuss whether or not this rally can happen now in the next few months
or if it will be delayed until 2027-2028.

BBAI BigBear ai Holdings Options Ahead of EarningsIf you haven`t bought BBAI before the massive rally:
Now analyzing the options chain and the chart patterns of BBAI BigBear ai Holdings prior to the earnings report this week,
I would consider purchasing the 3usd strike price Calls with
an expiration date of 2025-12-19,
for a premium of approximately $1.35.
If these options prove to be profitable prior to the earnings release, I would sell at least half of them.

QURE uniQure Options Ahead of EarningsAnalyzing the options chain and the chart patterns of QURE uniQure prior to the earnings report this week,
I would consider purchasing the 15usd strike price Calls with
an expiration date of 2026-1-16,
for a premium of approximately $2.32.
If these options prove to be profitable prior to the earnings release, I would sell at least half of them.

U Unity Potential Buyout Soon?!If you missed my previous signal on U (Unity):
Now Unity Technologies (NYSE: U) just caught fire — surging 12.5% in a single day — on a massive uptick in volume that should have every sharp trader watching closely. With $39.1M in volume against a daily average of 9.4M shares, something is clearly brewing beneath the surface.
But this isn’t just about technicals — the options market is lighting up with unusual activity, and there’s fundamental buyout potential that’s getting harder to ignore.
🔍 Options Traders Are Making Bold Bets
Yesterday: Traders loaded up on January 16 $37 strike calls — deep out-of-the-money, high-risk, high-reward plays.
Today: A massive $3.5 million bet was placed on the $30 strike calls, also expiring January 16.
These aren’t casual bets. This is smart money positioning for a potential takeover or major catalyst, and the timeline is clear: January 2025.
📈 Why a Buyout Could Be Back on the Table
Let’s rewind. On August 9, 2022, AppLovin (APP) made an unsolicited offer to acquire Unity in an all-stock deal worth $17.5B, valuing Unity shares at $58.85 — an 18% premium at the time. Unity rejected the deal.
Fast forward to today:
AppLovin's market cap has exploded — now sitting at a jaw-dropping $127B, up 3,800% since late 2022.
Unity, meanwhile, is a shadow of its former self, trading far below its ATH of $201.12 (November 2021), with ongoing struggles in monetization and competition.
But this disparity creates a prime M&A setup:
AppLovin now has the firepower and strategic incentive to revisit the acquisition — with Unity’s depressed valuation, it’s arguably a bargain.
The AI + gaming narrative is red hot. Combining Unity’s engine with AppLovin’s ad and monetization capabilities could be the synergy Wall Street loves.
🎯 The Trade Setup
Unity just broke out with conviction on high volume — this could be the first leg of a larger move.
Options flow suggests bullish sentiment into early 2025.
A renewed takeover offer could easily push the stock back toward the $50–60 zone, if not higher.
🧠 Final Thoughts
Unity is no stranger to volatility, but when volume spikes, options explode, and a cash-rich suitor like AppLovin is thriving, traders should sit up and pay attention.
We may be watching the early stages of a buyout story 2.0 unfold — and Wall Street might be starting to price it in.
📌 Watch Unity (U) closely in the coming weeks. The market may be whispering — or shouting — "Takeover incoming."

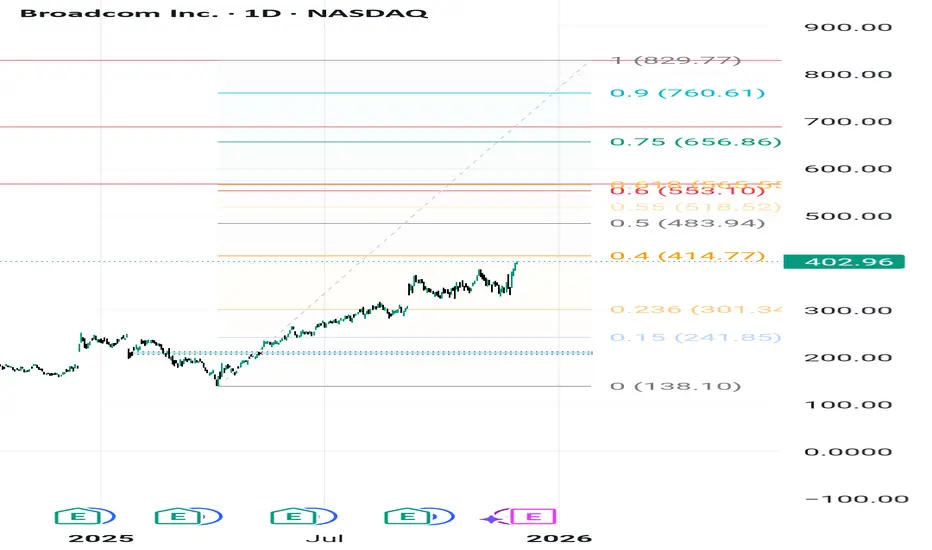
AVGO: Path to $829.77 – Navigating Critical Fibonacci Zones1. Overall Thesis and Price Structure
Broadcom Inc. (AVGO) exhibits a strong underlying bullish trend, fundamentally driven by demand for its AI chips and the successful integration of VMware. The technical objective targets a final high of $829.77. However, the path requires breaking through significant resistance levels defined by the Fibonacci structure. The current price is \mathbf{\$402.96}, maintaining the bullish momentum.
2. Crucial Resistance and Volatility Points
The analysis identifies two critical intermediate targets. The first and most significant hurdle is at $567.10, which aligns closely with the \mathbf{0.618} Fibonacci Golden Ratio. This zone is expected to trigger major volatility, profit-taking, and consolidation. The price action at $567.10 is the key test for trend continuity. Should the price break this level decisively, the next primary resistance target is $688.63, paving the way for the ultimate goal.
3. Key Support and Trend Invalidation
The long-term structural support, or the "Invalidation Point" for the bullish scenario, is the Key Zone at \mathbf{\$206.00}. As long as AVGO trades above this level, the multi-year uptrend remains valid. In the short term, the stock needs to overcome immediate resistance near $414.77 to gather momentum and continue its push towards the intermediate Fibonacci targets.
AAOI Applied Optoelectronics potential rally by EOYApplied Optoelectronics AAOI is well-positioned for a strong rally toward $24 per share by the end of 2025, supported by multiple operational and strategic catalysts. A key recent development—the warrant agreement with Amazon—adds a powerful endorsement and financial backing that enhances the bullish case.
1. Amazon’s Strategic Warrant Agreement: A Major Vote of Confidence
On March 13, 2025, AAOI issued a warrant to Amazon.com NV Investment Holdings LLC, granting Amazon the right to purchase up to approximately 7.95 million shares at an exercise price of $23.70 per share.
About 1.3 million shares vested immediately, with the remainder vesting based on Amazon’s discretionary purchases, potentially up to $4 billion in total purchases over time.
This agreement signals Amazon’s strong confidence in AAOI’s technology and its critical role as a supplier of high-speed optical transceivers for Amazon Web Services and AI data center infrastructure.
The warrant price near $24 effectively sets a floor and a valuation benchmark, supporting the thesis that AAOI’s stock could reach or exceed this level by year-end.
2. Major Data Center Wins and Hyperscale Customer Re-Engagement
AAOI recently resumed shipments to a major hyperscale customer, with volume shipments of high-speed data center transceivers expected to ramp significantly in the second half of 2025.
This re-engagement with a key customer aligns with the surging demand for AI-driven data center infrastructure, providing a strong revenue growth catalyst.
3. Robust Revenue Growth and Margin Expansion
Q1 2025 revenue doubled year-over-year to nearly $100 million, with gross margins expanding to over 30%, reflecting operational efficiencies and favorable product mix.
The company expects to sustain strong quarterly revenue ($100–$110 million) and ramp production capacity to over 100,000 units of 800G transceivers per month by year-end, with 40% manufactured in the U.S.
4. Manufacturing Expansion and Supply Chain Resilience
AAOI is scaling manufacturing in the U.S. and Taiwan, enhancing supply chain robustness and positioning itself to benefit from potential government incentives for domestic production.
Its automated, largely in-house manufacturing capabilities provide a competitive edge in meeting hyperscale and AI data center demand.
In conclusion:
Amazon’s warrant agreement at a $23.70 strike price not only provides a direct valuation anchor near $24 but also serves as a powerful strategic endorsement of AAOI’s technology and growth prospects. Combined with robust revenue growth, expanding manufacturing capacity, and key customer re-engagement, AAOI has a compelling case to reach or exceed $24 per share by the end of 2025.

Gaps gaps gapsOrcl has filled the large gap at $245 but there still remains many gaps below. RSI is oversold so a bounce should be expected. Earnings may be a catalyst for that.

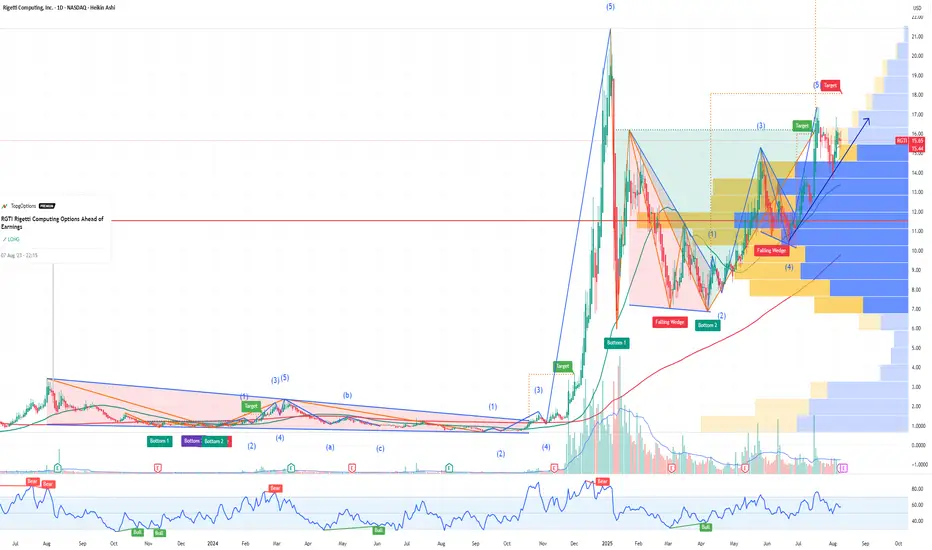
RGTI Rigetti Computing Options Ahead of EarningsIf you haven`t bought RGTI before the rally:
Now analyzing the options chain and the chart patterns of RGTI Rigetti Computing prior to the earnings report this week,
I would consider purchasing the 15usd strike price Calls with
an expiration date of 2027-1-15,
for a premium of approximately $6.20.
If these options prove to be profitable prior to the earnings release, I would sell at least half of them.
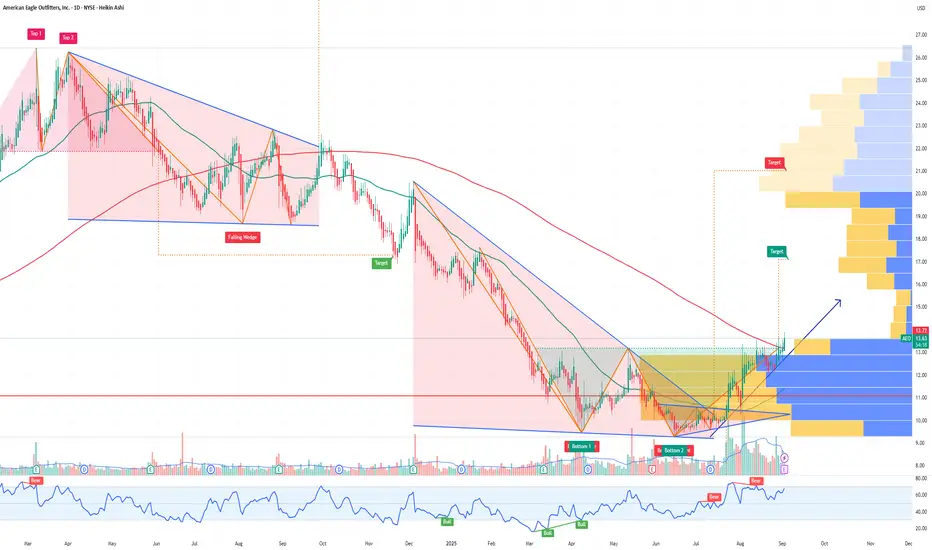
AEO American Eagle Outfitters Options Ahead of EarningsAnalyzing the options chain and the chart patterns of AEO American Eagle Outfitters prior to the earnings report this week,
I would consider purchasing the 15usd strike price Calls with
an expiration date of 2027-1-15,
for a premium of approximately $3.25.
If these options prove to be profitable prior to the earnings release, I would sell at least half of them.
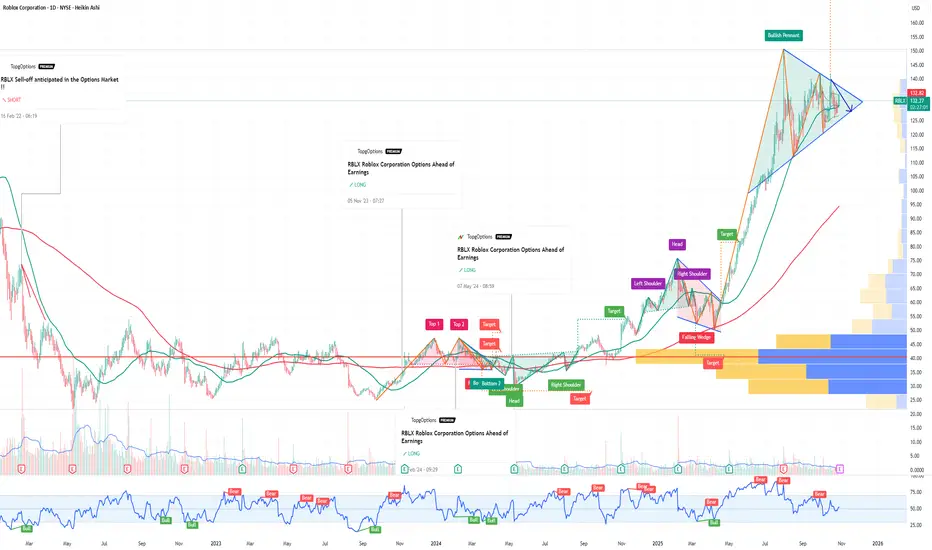
RBLX Roblox Corporation Options Ahead of EarningsIf you haven`t bought RBLX before the rally:
Now analyzing the options chain and the chart patterns of RBLX Roblox Corporation prior to the earnings report this week,
I would consider purchasing the 130usd strike price Puts with
an expiration date of 2026-1-16,
for a premium of approximately $13.80.
If these options prove to be profitable prior to the earnings release, I would sell at least half of them.
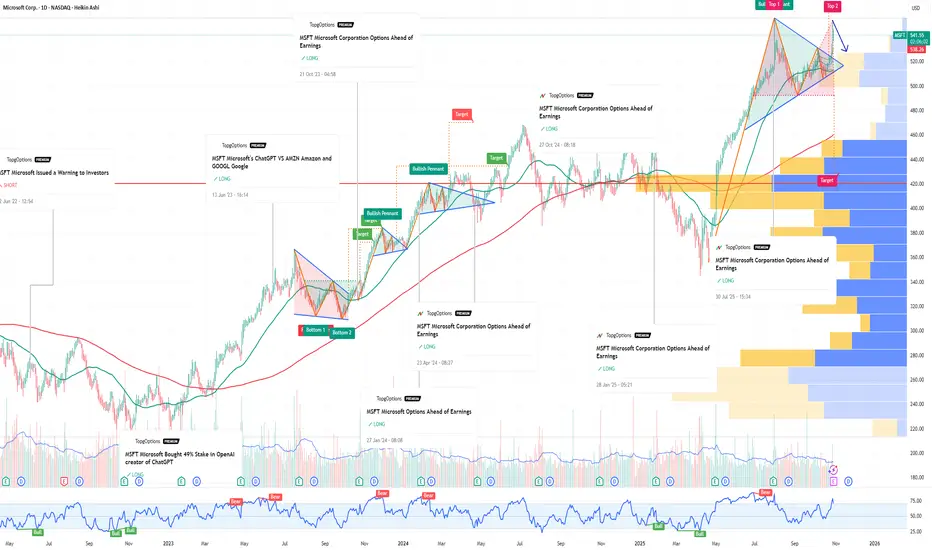
MSFT Microsoft Corporation Options Ahead of EarningsIf you haven`t bought MSFT before the rally:
Now analyzing the options chain and the chart patterns of MSFT Microsoft Corporation prior to the earnings report this week,
I would consider purchasing the 550usd strike price Puts with
an expiration date of 2025-12-19,
for a premium of approximately $26.70.
If these options prove to be profitable prior to the earnings release, I would sell at least half of them.
ONDS Ondas Holdings Options Ahead of EarningsAnalyzing the options chain and the chart patterns of ONDS Ondas Holdings prior to the earnings report this week,
I would consider purchasing the 10usd strike price Calls with
an expiration date of 2028-1-21,
for a premium of approximately $3.95.
If these options prove to be profitable prior to the earnings release, I would sell at least half of them.

NVDA to $170? AI Bubble Risk, Big Money Exits & Heavy Shorts !I f you haven`t bought NVDA before the previous earnings:
Now you need to know that NVIDIA has dominated 2023–2025, becoming the face of the global AI boom. But the higher the climb, the harder the fall. While NVDA is still seen as “untouchable,” several major signals suggest the stock could revisit levels near $170 — a healthy correction of 10–15% from here.
1. Major Investors Are Exiting — SoftBank Dumped Everything
SoftBank, one of Nvidia’s earliest and most influential institutional backers, sold its entire stake in late 2025, worth roughly $5.8 billion.
Smart-money exits near all-time highs should never be ignored.
SoftBank rarely sells unless it believes:
- the sector is overheated
- the valuation has run too far
- risk/reward becomes asymmetric
This mirrors their strategy in 2021–2022 when they unloaded overvalued tech before the correction.
SoftBank’s full exit is a red flag for anyone ignoring the possibility of an AI bubble.
2. Michael Burry Bought Massive Puts — A Direct Bet Against the AI Mania
Michael Burry — famous for predicting the 2008 crisis — has quietly increased his put positions on NVIDIA and other AI names.
Why does this matter?
Because Burry doesn’t short “normal” overvaluations.
He shorts bubbles.
His AI thesis:
- expectations are unrealistic
- revenue growth is priced as infinite
- companies are spending billions on AI with no short-term monetization
- chip demand could normalize faster than markets expect
When a contrarian with Burry’s track record bets against a trend, it’s worth paying attention.
3. NVIDIA’s Valuation Is Stretched Even for a Hyper-Growth Company
Even bulls agree: NVDA’s multiples are once again aggressively priced.
Key issues:
• Price-to-Sales historically elevated
NVDA is trading at a P/S ratio that would be insane for any company approaching a $5 trillion market cap.
• Revenue growth expectations assume perfect long-term AI adoption
If AI monetization slows or plateaus even slightly, NVDA’s valuation collapses fast.
4. Are We in an AI Bubble? Many Indicators Say Yes
Top analysts, academics, and even bullish investors admit:
AI has bubble-like behavior.
Evidence of a bubble:
- Stock prices rising faster than actual earnings growth
- Companies buying GPUs “because everyone else is doing it”
- Zero clarity on monetization for many AI firms
- AI startups valued at billions with no revenue
- Media hype similar to 1999 dot-com sentiment
Harvard Business Review, Wired, and Investopedia already discuss the “AI bubble thesis.”
If AI expectations don’t materialize fast enough, NVDA becomes the single most vulnerable stock on the market.

PLTR to $150: Overvaluation, AI Hype, Slowing Government Growth If you haven`t bought PLTR at $16:
Palantir has become one of the most crowded trades of the AI boom. While the company is strong fundamentally, the stock price has detached from reality. A move toward $150 (post-split) is not only reasonable — it is structurally likely.
1. Extreme Valuation — PLTR Trades Like a Hyper-Growth AI Leader, But Growth Is Slowing
Palantir’s current valuation assumes:
accelerating revenue growth
massive enterprise AI adoption
long-term dominance in the AI/defense space
But real numbers tell a different story:
government revenue growth has slowed
commercial AI revenue is not scaling as fast as expected
current valuation implies “perfection”
PLTR is priced like Nvidia, but grows closer to a legacy enterprise software company.
That gap must eventually close.
2. Government Contracts Are Growing Much Slower Than Expected
Historically, the Gov segment was Palantir’s growth engine. Now:
U.S. federal agencies face budget constraints
large DoD and DHS contracts are delayed or split among competitors
players like Anduril, C3.ai, and smaller defense tech shops are taking share
geopolitical spending doesn’t translate directly into PLTR revenue
Slowing government growth is a major red flag, because it removes the company’s most stable source of revenue.
3. AI Hype in the Commercial Segment Is Not Converting Into Real Revenue (Yet)
Most of the excitement around PLTR in 2024–2025 comes from:
AIP (Artificial Intelligence Platform)
enterprise copilots
generative AI tools
predictive modeling engines
But the commercial AI pipeline suffers from:
too many POCs (proof-of-concepts)
long implementation timelines (6–24 months)
high customer acquisition costs
conservative corporate spending
The hype is real.
The revenue, not so much.
4. Heavy Insider Selling — A Consistent Bearish Signal
Top insiders have repeatedly sold shares into every major rally:
Alex Karp (CEO)
Shyam Sankar (COO)
multiple VPs and directors
Notice what’s missing:
large insider buying.
Insiders consistently cash out when retail enthusiasm peaks, which historically precedes corrections.
Macro Risk: If AI Capex Slows, PLTR Gets Hit Harder Than NVDA
PLTR is far more sensitive to an AI spending slowdown than hardware leaders like Nvidia, which still enjoy massive chip demand.

ZS Zscaler Options Ahead of EarningsIf you haven`t bought ZS before the rally:
Now analyzing the options chain and the chart patterns of ZS Zscaler prior to the earnings report this week,
I would consider purchasing the 260usd strike price Puts with
an expiration date of 2026-1-16,
for a premium of approximately $11.75.
If these options prove to be profitable prior to the earnings release, I would sell at least half of them.
