$NVTS Weekend analysis - Nov 30th, 2025NASDAQ:NVTS bounced right off the upward trend line on Nov 21, and it’s been climbing ever since. The MACD is close to a bullish crossover, which could add more fuel to the move.
If the momentum keeps going, I’m watching $9.43 - $9.88 as the first short-term target - that’s the old S/R zone and it lines up with the 50D SMA (9.81).
If the price can break and close above that range, there’s a big volume gap from $10.24 to $11.98, which often acts like a “vacuum.” A quick push toward $12 wouldn’t surprise me.
On the downside, if the price falls under $7.82 (volume shelf support) and closes there, the setup is invalid for me.

Sub $100 Incoming?Textbook UTAD • LPSY Formation • Bearish Divergence on 3D QQQ Trend
📌 Overview
NVDA is showing a complete Wyckoff Distribution across all major timeframes. The Monthlys last major push has been extremely weak volume, The Weekly chart printed a clean UTAD, the Daily/3D shows a fractal UTAD, and the 3-Day QQQ trend reveals a bearish divergence by closing above its last swing, while NVDA closed below — confirming supply dominance.
This combination strongly suggests NVDA is transitioning from Phase C → Phase D, with markdown likely into the AR and below.
🟦 1. WEEKLY — Completed UTAD, Now Phase D
The Weekly structure is extremely clean and follows classic Wyckoff logic:
Phase A
PSY
Buying Climax (BC)
Automatic Reaction (AR)
Secondary Test (ST)
Phase B
Wide, choppy rotation while the Composite Operator distributes.
Phase C — UTAD
NVDA broke above Phase B highs, failed immediately, and reversed with increasing sell pressure.
This is the exact spot where smart money typically finalizes distribution.
Phase D — Current
The last two rallies have formed LPSYs, each weaker than the last:
Lower highs
Shortened thrust
Volume fading on upswings
Downside volume expanding
Interpretation:
Weekly is firmly in Phase D, preparing to test the AR (≈ $120). Followed by SOW-B ≈ $93
Failure of this zone opens Phase E (markdown).
🟪 2. 3-DAY NVDA — Fractal UTAD of the Weekly Distribution
On the 3-Day chart, NVDA produced a smaller UT and UTAD inside the larger weekly UTAD.
This is a fractal distribution, confirming:
A smaller distribution nested inside a larger one
CO selling on both timeframes
Supply overwhelming diminishing demand
This also aligns perfectly with the behavior of Phase C → D.
This is one of the strongest bearish Wyckoff signals you can get.
🟦 3. 3-Day QQQ Trend — Clear Bearish Divergence
Above the NVDA 3D chart is the QQQ 3-Day
• When NVDA closes below its last swing, while the market held above, that shows weakness.
This is momentum divergence:
Demand decelerating
When the leaders start to lag, thats something to cause concern.
Its a classic condition during UTADs in distribution tops
When a UTAD forms with divergence, Wyckoff views it as Demand is drying up.
🟧 4. MONTHLY — Macro Distribution Entering Phase D
The Monthly chart confirms the big picture:
Massive vertical run → PSY + BC
First shift in behavior → AR
Controlled retest → ST
Drift sideways → Phase B
Final push → Monthly UTAD
Rejection with increased supply → Phase C complete
Now price is failing the retest and rolling over into Phase D.
The Monthly and Weekly now align, which greatly increases the probability of sustained markdown.
🟥 5. Wyckoff Markdown Projection Path
Based on the current structure:
1️⃣ Current Zone
Weak LPSY → low-volume rally failures. I expect some chop, followed by one last UT of the chop highs, with a rejection between $185-$195. IF we reclaim and hold $195 = Invalidation, otherwise:
2️⃣ SOW (Sign of Weakness)
A decisive breakdown below the most recent structure lows.
3️⃣ First Major Target: AR Zone
$120
Every completed distribution returns to test the AR.
4️⃣ Sow Break (Phase E Begins)
Targets:
$102 (Phase A low)
$90-102 (Redistribution zone)
$76 (Final stopping area; Monthly value reset)
5️⃣ Bear Market Behavior
If the SoW breaks, NVDA enters a true Phase E markdown —
smooth, directional, and supply-driven.
🟩 6. Invalidation
To negate this bearish Wyckoff view:
➡️ NVDA must reclaim and HOLD above the UTAD high.
Given the 3D divergence and repeated LPSYs, this has low structural probability.
🟦 7. Final Thoughts
NVDA is aligning across all major timeframes in one of the clearest Wyckoff distribution sequences of the year:
Monthly UTAD
Weekly UTAD → LPSYs → SOW
Daily/3D fractal UTAD
3-Day QQQ divergence
Volume shift confirming supply
Everything here points toward Phase D → Phase E, with markdown into the AR and below. I think its important to not repeatedly try and call tops so if this idea is invalidated I will remain neutral, until I see redistribution below phase b, but I also think that the weakness in volume, and the MTF alignment is too much to ignore
If this continues to play out that would make all of 2025 a distribution. If that is the case, the markdown phase could play out throughout all of 2026 and into 2027. I know people say this every year/month/day but this is the first time, I personally, have seen this kind of alignment and supporting evidence across timeframes. Time will tell.
Good luck in 2026 everybody

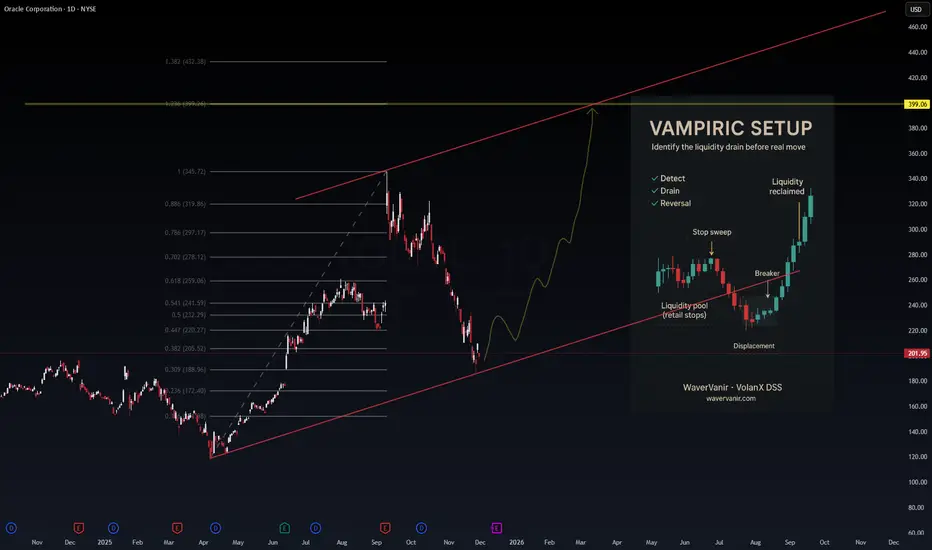
$ORCL — WaverVanir Edge (Vampiric Setup)NYSE:ORCL — WaverVanir Edge (Vampiric Setup)
(Educational Only)
Market Structure:
Price tapped the ascending trendline after a full liquidity drain from the June–Sept highs.
The selloff created a deep retracement into 0.702 → 0.786 zone, a common SMC reversal region.
ORCL is now positioned for a Vampiric Setup — the market drains retail liquidity before revealing the real directional move.
Vampiric Setup Components (From the chart):
Retail stop pools swept
Breaker structure formed
Bullish displacement confirms aggressive repricing
Liquidity reclaimed with momentum
Bias:
As long as structure respects the trendline, bias favors a multi-month rally toward:
Fib 1.0 → $345
Fib 1.382 → $399 (primary target)
Liquidity Map:
Below: liquidity vacuum already drained — limited downside unless macro breaks.
Above: large inefficiencies between 260 → 315 → 345 now become magnets.
Momentum:
A classic “drain → reclaim → expansion” pattern.
ORCL often trends in large waves due to its enterprise cloud cycles.
Key Levels:
Support: 188 / 205
Targets: 315 → 345 → 399
Invalidation: Strong daily close below trendline
Smart money always moves after the drain.
— WaverVanir International LLC
#ORCL #Stocks #VolanX #AI #Liquidity #WaverVanir
10? May be for December?It's clear its bearish. Most likely it will go down this December as well. Maybe I will buy it around 10 and DCA on it if it goes down further. I think in the next 6 months this could hit $24 based on technical analysis.
Happy trading and not a financial advice.

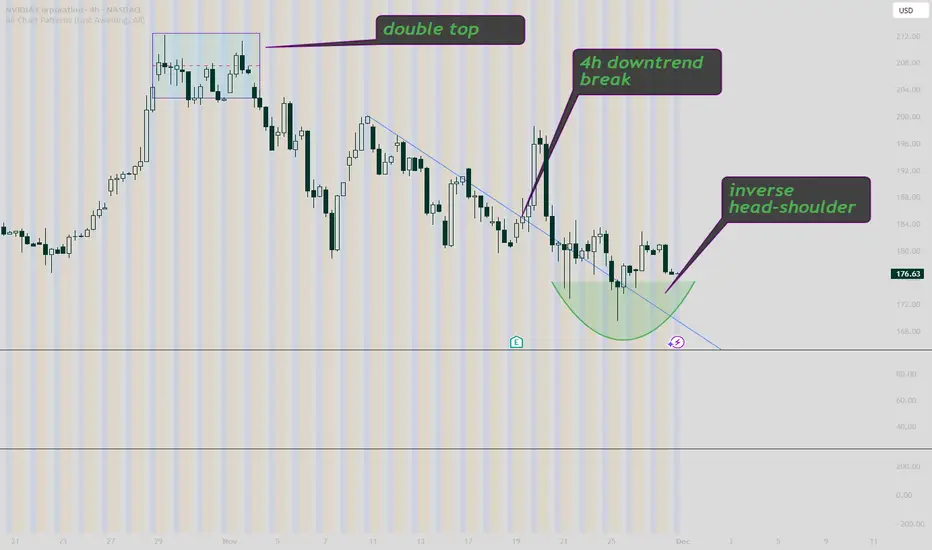
NVDA 4H TECHNICAL ANALYSIS NVDA has broken a downtrend triggered by a double top, and has now formed a inverse head and shoulders
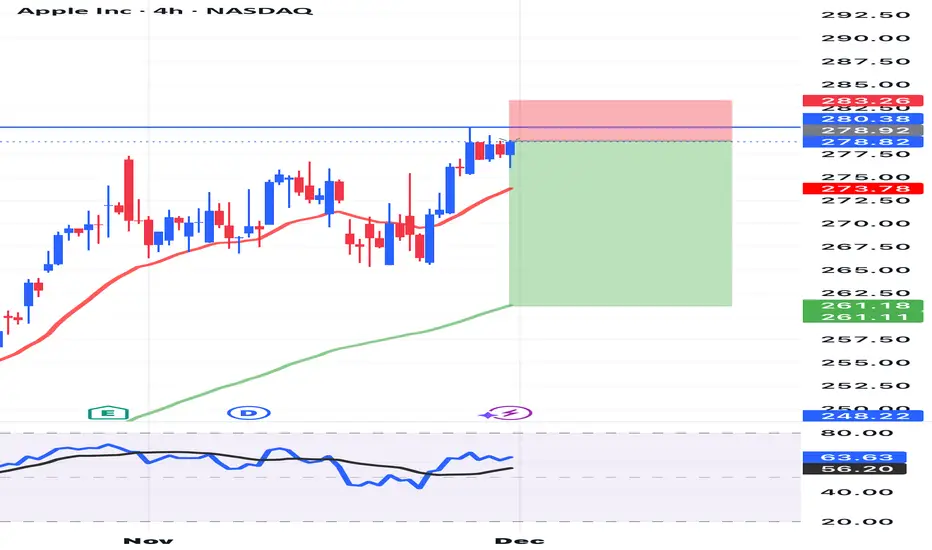
APPLE The Target Is DOWN! SELL!
My dear subscribers,
This is my opinion on the APPLE next move:
The instrument tests an important psychological level 278.82
Bias - Bearish
Technical Indicators: Supper Trend gives a precise Bearish signal, while Pivot Point HL predicts price changes and potential reversals in the market.
Target - 274.28
About Used Indicators:
On the subsequent day, trading above the pivot point is thought to indicate ongoing bullish sentiment, while trading below the pivot point indicates bearish sentiment.
Disclosure: I am part of Trade Nation's Influencer program and receive a monthly fee for using their TradingView charts in my analysis.
———————————
WISH YOU ALL LUCK

GOOGLHow to become successful in forex and stock trading: 1.Master fundamentals and technical analysis. 2,Build and follow a solid trading plan. 3.Apply strict risk management (1–2% rule). 4.Stay disciplined—control fear and greed. 5.Record and analyze every trade. 6.Focus on high-quality setups only. 7.Diversify across assets and markets. 8.Keep evolving—study, adapt, and grow daily.
AAPLHow to become successful in forex and stock trading: 1.Master fundamentals and technical analysis. 2,Build and follow a solid trading plan. 3.Apply strict risk management (1–2% rule). 4.Stay disciplined—control fear and greed. 5.Record and analyze every trade. 6.Focus on high-quality setups only. 7.Diversify across assets and markets. 8.Keep evolving—study, adapt, and grow daily.
F | Possible 3 Year Long Consolidation Over | LONGFord Motor Co. engages in the manufacture, distribution, and sale of automobiles. It operates through the following segments: Ford Blue, Ford Model E, Ford Pro, Ford Next, Ford Credit, and Corporate Other. The Ford Blue, Ford Model E, and Ford Pro segment includes the sale of Ford and Lincoln vehicles, service parts, and accessories, together with the associated costs to develop, manufacture, distribute, and service the vehicles, parts, and accessories. The Ford Next segment is involved in the expenses and investments for emerging business initiatives aimed at creating value for Ford in vehicle-adjacent market segments. The Ford Credit segment consists of the Ford Credit business on a consolidated basis, which is primarily vehicle-related financing and leasing activities. The Corporate Other segment refers to corporate governance expenses, past service pension and OPEB income and expense, interest income and gains and losses from cash, cash equivalents, and marketable securities, and foreign exchange derivatives gains, and losses associated with intercompany lending. The company was founded by Henry Ford on June 16, 1903 and is headquartered in Dearborn, MI.

NVDA🌎NVIDIA: At the Peak or the Brink?
Nvidia's record highs are accompanied by warning signs. A market cap of $4.37 trillion and a P/E ratio of 51 indicate inflated expectations.
Risks:
Speculative demand: The $23.7 billion investment looks like an artificial market pump.
Macro threats: The AI boom will face energy shortages.
Historical parallel: The scenario mirrors Cisco's pre-dot-com bubble.
Fierce competition: AMD, Intel, and cloud giants are creating their own chips.
Growth drivers:
Leadership in AI, a closed CUDA ecosystem, and 66% data center revenue growth.
Nvidia is a leader, but its shares have become a high-risk asset. Any slowdown in business performance will lead to a collapse in the stock price.
The baseline scenario is a broad sideways trend.

META — Watching for a Potential GAP Closure.Hello Everyone, Followers,
META is the second one for Today.
After disappointing financial report, It created big GAP between 742 to 680 .
The GAP is still unfilled.
Then META has shown a solid rebound after weeks of heavy selling. The chart is now structured around one key element:
🔍 Chart Highlights
- Price is now broke the 631 and closed over this level. This level is now our new Support level.
- The GAP zone around 680–700 remains open and is a magnet if momentum continues.
- The long-term yellow trend support line held beautifully — buyers stepped exactly where they should.
-A push into the GAP zone is the logical next step if META holds above 630 - 631.
🔹 Outlook
- META has room to retest the GAP area near 700–720.
- A breakout above the 50 MA strengthens this scenario. (Green Line)
- A rejection could bring the price back toward 595.
🔹 My Plan
If META closes multiple days above 631, I expect continuation into the GAP region.
If it pulls back, 595 is my key support area to watch.
If you enjoy and like clean, simple analysis — follow me for more.
This is just my thinking and it is not invesment suggestion , please do not make any decision with my anaylsis.
Have a lovelly Sunday to all and Good Start a Week.
#META #SPX500 #NASDAQ

AMZN : Mid-Term Bullish Continuation OutlookAmazon is shaping a constructive bullish sequence on the 4-hour timeframe, with recent price action reinforcing renewed upside momentum. The unfolding structure suggests buyers may remain in control as the market progresses into December, keeping the continuation scenario active while the current rhythm holds.
Disclosure: We are part of Trade Nation's Influencer program and receive a monthly fee for using their TradingView charts in our analysis.

Google (GOOGL): Bullish Reversal in Play – Eyeing $237 TargetBullish Engulfing and Fibonacci Channel Support
Last week’s green candle on the weekly chart of NASDAQ:GOOGL has engulfed the main body of the previous red candle, signaling a potential trend reversal. Moreover, the price has respected a key support level within the Fibonacci channel, further strengthening the bullish sentiment.
Key Observations:
Fibonacci Channel:
The stock is moving well within an upward Fibonacci channel, indicating a healthy uptrend.
Current support is holding at the midline, confirming buyers' interest at this level.
Bullish Candle Formation:
A clear bullish engulfing candle pattern has formed, a strong reversal signal.
Upside Potential:
Based on Fibonacci extensions and channel resistance, the next major target lies at $237, offering a ~20% upside from the current levels.
Moving Averages:
The price is trading above key moving averages (20, 50, and 200-week), reinforcing a strong bullish outlook.
What to Watch:
Volume confirmation will be crucial to validate this move.
Keep an eye on the support at $173.96 and $167.59 (short-term MAs) to manage risk effectively.
💡 Trade Idea:
A breakout above $196 could provide a clear signal to ride this uptrend. Consider trailing stops as the stock approaches $237 to lock in gains.

META — Setting Up for a Potential 50% Upside?META (Weekly Chart) is showing a strong technical setup after a healthy multi-week correction. Price has bounced exactly from the long-term rising trendline + 100-WMA zone — a region that has historically acted as a strong accumulation area.
🔍 Key Bullish Signals
Bullish candle forming near structural support, indicating buyers stepping in.
Price holding above major MAs: 100W, and 200W → long-term trend intact.
MACD flattening near zero-line, often a precursor to a fresh weekly bullish crossover.
A bounce from the current trendline opens room to the next Fibonacci cluster at
~$980–$1,000, which is approximately +50% from current levels.
🎯 Upside Projection
Current Price: ~$648
Potential Target (Fib 2.618 extension): ~$990
➡️ Estimated Upside: ~50%
If META confirms a weekly close above the current range resistance, the path toward higher Fib zones becomes technically valid.

Cat 3months charts
If ( CAT) closes above the level of 485.34 $ at the end of the December, it will continue its upward movement. However, it will be a high-risk trade. You will make profits, but make sure to take your profits step by step, as silver is currently trading above the 70 RSI level.

Nike poised for 2026 reboundWe keep coming back to the line attributed to Nike's CEO Phil Knight, “The cowards never started and the weak died along the way. That leaves us.”
Nike shares have slumped over the past 12 months, down roughly 17 to 18 percent. The weakness reflects a tough consumer stretch and pressure across global retail channels.
But beneath the surface, the business is stabilising. Fiscal 2025 revenue came in around $46 billion, down about 10 percent from the prior year. Net income held near $3.2 billion.
Gross margins were close to 42 percent and operating margin hovered near 8 percent. These are not the numbers of a brand in structural decline. They show a business absorbing shocks while keeping its core intact.
The most recent quarter delivered revenue of roughly $11.7 billion, up a touch year-on-year, with net income around $700 million. The uptick is small but important. It tells me the bleeding is slowing. Inventory has normalised, wholesale orders have improved, and margin traction is beginning to reappear.
Now look at the macro backdrop. If US rates fall next year under easing inflation pressure, the consumer should finally exhale. That shifts momentum back toward discretionary spending. Nike captures that swing better than most. Its global footprint, deep wholesale relationships and disciplined direct to consumer strategy give it leverage when demand cycles turn.
Nike has been hit, no doubt. But it remains a unique asset in global apparel. Product cadence is improving. Cost discipline is tighter. The brand still owns mindshare.
Nike has gone through the fire. Many competitors wilted. Nike endured. With the share price depressed and fundamentals firming, the setup looks compelling for a rebound.
The forecasts provided herein are intended for informational purposes only and should not be construed as guarantees of future performance. This is an example only to enhance a consumer's understanding of the strategy being described above and is not to be taken as Blueberry Markets providing personal advice.

AMZN: Bullish Outlook Post-Black Friday Surge
Title:
AMZN: Bullish Outlook Post-Black Friday Surge
Greetings, Traders!
🌟 Hello everyone,
As we analyze Amazon (AMZN) following the recent Black Friday and Thanksgiving sales, we notice a strong bullish sentiment emerging. The online sales surge of **3.1%** provides a solid foundation for potential upward movement.
NASDAQ:AMZN
Key Observations:
- A strong support level is identified at ** 161 ** and ** 167 **, though it is unlikely to be tested in the near future.
- Currently, AMZN is trading around ** 233 **, with a potential upward trajectory towards ** 250 ** in the coming days.
- The price is moving within a well-defined channel, with clear resistance and support lines, as well as internal channel trends.
Technical Analysis:
The channel analysis indicates that AMZN is likely to continue its upward move towards ** 250 **. Traders should consider setting a strict stop-loss at ** 225 ** to manage risk effectively, ensuring that potential downside is minimized.
Fundamental Factors:
The recent increase in online sales by **3.1%** during Black Friday and Thanksgiving suggests strong consumer demand, which is likely to benefit AMZN in the short and medium term. This positive momentum supports a bullish outlook for the stock.
Trading Strategies:
Traders may consider taking long positions with a target around ** 250 ** while maintaining a strict stop-loss at ** 225 **. The strong sales figures enhance the probability of achieving the target, making this a promising opportunity.
In Conclusion:
With AMZN showing strong momentum post-Black Friday, traders can expect further gains. The combination of technical patterns and positive sales data provides a compelling case for a bullish stance. Stay vigilant and manage risk appropriately for optimal results.
Engage with Us:
🟢 If you find this analysis insightful, please give it a LIKE.
🟡 Don’t forget to FOLLOW for more updates.
🔵 SHARE with fellow traders who might benefit from this information.
🔴 Feel free to COMMENT with your thoughts and insights!
Your active participation enriches our trading community, fostering knowledge exchange and collective growth. Share your feedback and ideas in the comments below or by boosting this post.
Looking forward to connecting with you in the next post.
Happy trading!

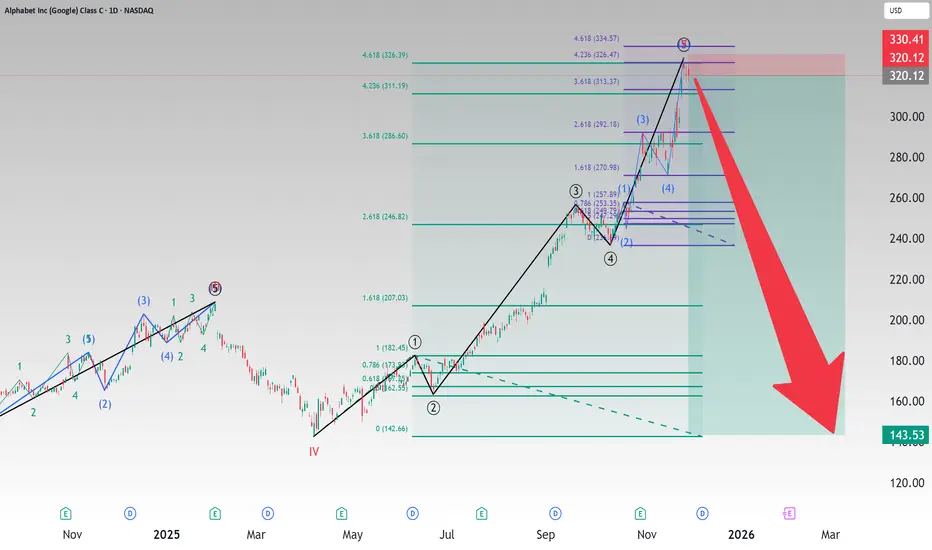
Google Short: 5-waves completion with Fibonacci ExtensionsOver here, I want to discuss the possibility that Google has peaked. I know that I am going against Berkshire Hathaway. But then, we can really confirm if the latest decision is really made by Warren Buffett given that he has also recently announced his retirement? And Charlie Munger is no longer with him.
Of course, I've always given my analysis based on Wester TA (chart patterns), Japanese TA (Candlesticks), and Elliott Waves. And over here, I present to you the potential 5-waves that might have completed on Google. And that is supported by 2 Fibonacci extensions:
1. From Primary Wave 1 across the entire wave, and
2. From Intermediate Wave 1 of 5 across entire Primary Wave 5.
But these are not certainties but probabilities and most importantly, risk-reward.
For this idea, the stop is most important: slightly above the All-time-high: $328.67. I would say that you can put the stop at $329 or $330. If Google goes beyond and makes new ATH, then this idea can be trashed.
The take profit is at the previous wave 4 of a higher degree, or the low made on 7th April 2025: $142.66.
Good luck!
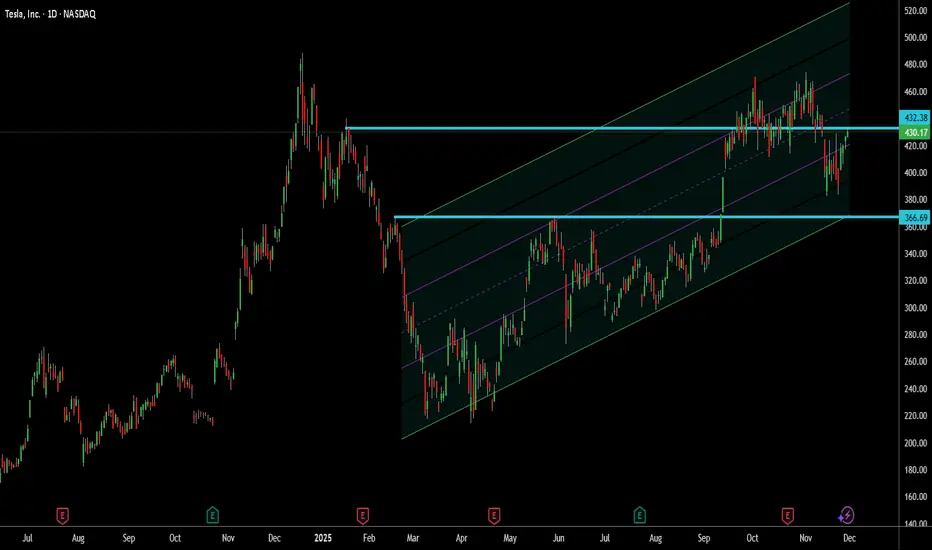
TSLA: Navigating Key Support and Resistance Levels for Future Mo
Title:
TSLA: Navigating Key Support and Resistance Levels for Future Moves
Greetings, Traders!
🌟 Hello everyone,
As we analyze Tesla (TSLA), we observe critical support and resistance levels that are shaping the current price action. Understanding these levels can help traders navigate TSLA's potential movements effectively.
NASDAQ:TSLA
Key Observations:
- TSLA has moved significantly from ** 220 ** to ** 500 **, reflecting strong bullish momentum.
- The key support and resistance levels are identified between ** 366 ** and ** 430 **, providing crucial areas for potential price reactions.
- An upward channel with four distinct slopes—inner slope for short-term and outer slope for long-term—helps in identifying optimal entry and exit points.
Technical Analysis:
The price action of TSLA respects the upward channel, indicating that the stock is moving within defined boundaries. If TSLA breaks above the ** 430 ** resistance, the next target is ** 460 **. However, a minor pullback might occur before the upward movement continues.
Fundamental Factors:
While technical levels are crucial, it's also essential to consider Tesla’s fundamental strengths, including innovation, market share, and overall industry trends. These factors contribute to the long-term bullish outlook.
Trading Strategies:
Traders may consider positioning long near the support at ** 366 ** and watching for confirmation of the breakout above ** 430 **. If the price faces bearish pressure, ** 366 ** will serve as a critical support level.
In Conclusion:
With TSLA navigating key support and resistance levels, traders should stay alert to potential breakouts and pullbacks. By leveraging the channel slopes and maintaining a disciplined approach, traders can capitalize on the opportunities ahead.
Engage with Us:
🟢 If you find this analysis insightful, please give it a LIKE.
🟡 Don’t forget to FOLLOW for more updates.
🔵 SHARE with fellow traders who might benefit from this information.
🔴 Feel free to COMMENT with your thoughts and insights!
Your active participation enriches our trading community, fostering knowledge exchange and collective growth. Share your feedback and ideas in the comments below or by boosting this post.
Looking forward to connecting with you in the next post.
Happy trading!
TESLA - Long - 528 / 611Tesla is still displaying the potential to fly higher.
As per our technical analysis we can find the stock has the potential to hit the levels of 528 and even to the levels of 611.
611 is a reversal level and hence we can expect some minor correction from that point.
Incase the stock fall from the current level of 430 , the best buying point is 348 /325.
From these levels we can expect a smooth ride towards the 528 levels.

Forex Trading Secrets1. Price Action Is the Real King (Not Indicators)
Most beginners clutter their charts with dozens of indicators hoping to find a perfect buy–sell formula. Professionals know the truth: price itself gives the most reliable information. Indicators lag because they represent past price data, not current market intent.
What professionals focus on:
Support and resistance zones
Market structure (higher highs, lower lows)
Liquidity levels (areas where stop-loss clusters exist)
Candlestick strength (rejection wicks, engulfing candles)
When a trader learns to read price action—how candles react to zones, how momentum builds or fades—they can trade profitably even with a clean chart. Indicators become secondary confirmation tools, not primary decision drivers.
2. Liquidity Is What Moves the Market
Here’s a hidden truth: forex markets move to fill liquidity, not because of random price swings. Big players like banks and institutional traders execute massive orders, and they need liquidity to fill those orders efficiently. That means:
Price hunts stop-loss clusters
Price sweeps highs and lows before reversing
Spikes occur to capture pending orders
This is why you often get stopped out right before the market moves in your favor. Understanding liquidity behavior gives traders a powerful edge.
Liquidity concepts include:
Stop hunts
Fake breakouts
Order block zones
Liquidity grabs
Smart traders expect these moves and position themselves accordingly.
3. The Trend Is Stronger Than Your Analysis
One of the biggest secrets is deceptively simple: Trading with the trend dramatically increases win probability. Many traders try to catch tops and bottoms, but institutional players rarely fight the trend—they ride it.
Characteristics of trend-following success:
Higher time-frame confirmation
Entering on pullbacks, not chasing
Using simple trend continuation patterns
Keeping trades open longer during strong trends
The trend holds more weight than any indicator or news event. Fighting the trend is one of the fastest ways to blow up an account.
4. Risk Management Is the Most Guarded Secret
Ask any long-term successful trader their biggest edge, and the answer won’t be a strategy—it will be risk management.
Key risk management secrets:
Never risk more than 1–2% per trade
Position sizing is more important than entries
A trader with moderate accuracy and strong risk rules often outperforms a trader with high accuracy but poor risk control
Understanding when not to trade is also a powerful risk strategy. Not trading low-quality setups protects your capital and mental energy.
5. Trading Psychology Outweighs Strategy
This is the hardest secret for beginners to accept: Your mindset determines your results more than your system.
The psychological traits professionals share:
Patience to wait for ideal setups
Discipline to follow rules consistently
Neutrality—no emotional attachment to wins or losses
Resilience after a losing streak
Confidence built on data, not hope
A trader can have the world’s best strategy, but fear, greed, revenge trading, and impulsiveness will destroy the account. This is why psychology books are more valuable than indicator tutorials.
6. Higher Time Frames Reduce Noise and Increase Accuracy
A hidden secret among consistently profitable traders is that they rely heavily on higher time frames like the daily or 4-hour.
Why higher time frames work:
Clearer market structure
Stronger trend visibility
Fewer false signals
Trades require less screen monitoring
Better risk-to-reward setups
Scalping looks attractive, but it magnifies emotions and often leads to over-trading. Higher time-frame trading reduces mental stress and increases consistency.
7. Fundamental Catalysts Drive Major Moves
Forex is deeply influenced by macroeconomic factors. Professionals use fundamentals to understand why the market is trending and where major volatility will occur.
Major catalysts include:
Central bank interest rate decisions
Inflation data (CPI, PCE)
Employment data (NFP, unemployment rates)
GDP figures
Geopolitical events
Fiscal policies
Ignoring fundamentals means ignoring the very forces that create trends.
But the secret is: You don’t need to be an economist—just know when news is happening and how it affects risk.
8. Smart Money Concept (SMC) Edge
Institutional-style concepts, once hidden from retail traders, are now increasingly discussed. These include:
Order blocks
Fair value gaps (FVG)
Market structure shifts (MSS)
Imbalance zones
Buy-side and sell-side liquidity
These concepts explain how institutions accumulate and distribute positions. Traders who master SMC often experience a major breakthrough in accuracy.
9. Consistency Beats Intensity
This secret is rarely acknowledged.
Successful traders:
Follow a structured routine
Practice the same strategy repeatedly
Keep a trading journal
Backtest regularly
Set trading sessions and stick to them
Failure in forex often comes from randomness—random indicators, random entries, random time frames. Success comes from consistency, not constant experimentation.
10. Forex Is a Business, Not Gambling
Treating forex like a business means:
Maintaining a trading plan
Logging trades
Tracking performance metrics
Identifying weak areas
Improving process instead of chasing profits
Traders who approach forex like gambling lose money. Traders who approach it like a business grow gradually and sustainably.
Conclusion: The “Secrets” Are Not Hidden—They Are Underrated
The real secrets of forex trading are not magic formulas or mysterious tools. They are principles that professionals use every day but beginners often overlook in search of shortcuts.
To summarize:
Price action matters most
Liquidity drives the market
Trend-following improves probability
Risk management is the true edge
Psychology determines consistency
Higher time frames simplify trading
Fundamentals guide long-term trends
SMC offers an advanced structural view
Consistency builds mastery
Treating trading as a business ensures longevity
Mastering these secrets takes time, discipline, and patience. But once internalized, they form the foundation of sustainable forex success.
Venture Capital’s Global Impact1. Driving Global Innovation
At its core, venture capital exists to fund innovation. VC firms invest in early-stage businesses that have high growth potential but also high risk—companies that traditional banks or lenders would rarely touch.
This willingness to fund experimentation has brought to life some of the world’s most transformative technologies:
The internet and search engines
Smartphones and mobile applications
Artificial intelligence and machine learning
Electric vehicles and clean energy
Biotechnology and precision medicine
E-commerce and fintech platforms
Without venture capital, many of the revolutionary companies we know today—Google, Facebook, Tesla, Uber, Alibaba, Shopify, and countless others—might never have scaled globally. VC acts as the financial fuel behind groundbreaking ideas, enabling startups to test, iterate, and expand at lightning speed.
2. Boosting Economic Growth and Job Creation
One of the most measurable global impacts of venture capital is economic expansion. VC-backed companies consistently outperform traditional businesses in terms of job creation, revenue growth, and market expansion.
Key economic contributions include:
2.1 Employment Generation
Startups supported by venture capital create millions of high-skill jobs across software development, research, engineering, marketing, and operations. These companies often become large-scale employers once they scale, contributing significantly to national employment figures.
2.2 Creation of New Industries
Entire industries—like ride-sharing, cloud computing, online education, and fintech—were built on VC funding. These sectors not only generate direct jobs but also create large support ecosystems.
2.3 Attracting Global Investments
Countries with strong VC ecosystems attract foreign investors, multinational corporations, and global funds. This strengthens the balance of payments and increases capital inflows.
3. Increasing Global Competitiveness
Venture capital plays a crucial role in helping nations remain competitive in the global innovation race. Countries with robust VC networks—such as the U.S., China, India, Israel, the U.K., and Singapore—are also leaders in cutting-edge technology.
3.1 Encouraging Entrepreneurship
VC fosters a culture where innovation is rewarded, raising the confidence of entrepreneurs to take risks and build new enterprises.
3.2 Commercialization of Research
Universities and research centers often commercialize their technology through venture funding. This bridges the gap between academic research and real-world application, making scientific discoveries accessible to industries.
3.3 Regional Development
In many countries, venture capital helps geographically underdeveloped regions grow by funding startups, incubators, and innovation clusters. Examples include:
Bangalore, India
Shenzhen, China
Tel Aviv, Israel
Berlin, Germany
São Paulo, Brazil
These cities became global tech hubs primarily because venture capital supported entrepreneurs and attracted international talent.
4. Supporting Technological Advancement and Transformation
Technology evolves at a rapid pace, and venture capital ensures that the world keeps moving forward. VC firms not only provide money—they bring mentorship, strategic planning, and global networks that help startups commercialize their innovations.
4.1 Accelerating Disruptive Technologies
VC funding pushes forward technologies such as:
Artificial intelligence
Blockchain and Web3
Robotics and automation
Green energy and sustainability
Space technology
Biotech and genomics
By taking early risks, VC funds encourage breakthroughs that later become everyday tools.
4.2 Redefining Traditional Industries
Venture-backed startups are transforming traditional sectors:
Fintech is reshaping banking.
Edtech is revolutionizing education.
Healthtech is changing medical diagnostics and treatment.
Agri-tech is improving farming efficiency.
Clean-tech is transforming energy and climate solutions.
This disruption leads to greater efficiency, lower costs, and improved services worldwide.
5. Strengthening Global Entrepreneurship Ecosystems
Venture capital has a multiplier effect on entrepreneurship. As startups succeed, founders often reinvest capital and experience into newer ventures, creating a self-sustaining cycle.
5.1 Success Stories Inspire Future Innovators
Global VC successes have encouraged millions to start businesses of their own.
Examples:
Silicon Valley unicorns influenced entrepreneurship in Europe and Asia.
India’s startup boom accelerated after Flipkart and Paytm gained global recognition.
China’s tech giants like Tencent and Alibaba inspired an entire generation of Chinese entrepreneurs.
5.2 Growth of Startup Support Networks
VC involvement leads to the development of:
Incubators
Accelerators
Angel networks
Innovation labs
Entrepreneurial universities
This infrastructure builds long-lasting entrepreneurial ecosystems.
6. Encouraging Globalization and Cross-Border Economies
Venture-capital-backed startups often expand internationally faster than traditional companies. This creates a more connected global marketplace.
6.1 Cross-Border Investments
VC firms frequently invest across borders. U.S. VC firms invest in India, China, and Europe; Asian firms invest in Africa and Latin America. This makes capital global and accessible.
6.2 International Market Expansion
Startups scale globally using VC networks, entering multiple continents in just a few years. This globalization drives economic integration, technology exchange, and cultural connectivity.
6.3 Knowledge Transfer
VC-backed companies bring global expertise—operational strategies, product design, marketing models, and technological know-how—to developing markets.
7. Supporting Social and Environmental Change
In recent years, venture capital has expanded beyond purely profit-driven investments. Many funds now prioritize impact investing, focusing on startups that solve global challenges such as:
Climate change
Renewable energy
Clean mobility
Healthcare access
Food security
Education for all
Impact-driven venture capital is driving innovation in sectors essential for sustainable global development.
8. Creating Wealth and Financial Growth
Venture capital has created massive wealth for founders, investors, and employees. This wealth, in turn, fuels new businesses and supports economic development.
8.1 Building Billion-Dollar Companies
Unicorn startups—those valued at over $1 billion—have become common worldwide. They drive national GDP growth and attract new investments.
8.2 Stock Market Growth
Many venture-backed companies go public through IPOs, contributing to stock market expansion and providing investment opportunities for the broader population.
Conclusion
Venture capital’s global impact extends far beyond funding startups. It is a powerful driver of innovation, economic growth, job creation, global competitiveness, and societal transformation. Through risk-taking and visionary investment, VC has shaped modern technology, transformed industries, and accelerated global development. As the world continues to evolve, venture capital will remain at the forefront of unlocking new opportunities and pushing the boundaries of what is possible.

Why We Loaded $MSTR at $169 (5:1 Risk/Reward to $355)Have you ever watched a stock pull back 65% and wondered if it was opportunity or disaster?
Have you ever missed a major setup because fear told you to stay away?
This analysis breaks down why NASDAQ:MSTR at $169 presented a textbook geometric retracement opportunity with exceptional risk/reward asymmetry.
Hello ✌️
Spend 3 minutes ⏰ reading this educational breakdown of structure-based position entry.
🎯 Analytical Insight on MSTR
MicroStrategy pulled back from $543 to $169 a 65% retracement that brought price directly into a major accumulation zone. This wasn't random. It aligned perfectly with:
Fibonacci retracement from 2020 lows to 2024 highs
A long-term ascending trendline dating back to 2020
The monthly $112 support zone that held as a floor
Our position entry: $169
Our invalidation level: $131.80 (below structure)
Our first target: $360 (previous resistance zone)
Risk: $37.20 per share
Reward: $191 per share
Ratio: 5.13:1
This setup didn't require predicting the future. It required identifying where risk was defined and reward was probable based on historical price structure.
📚 Educational Section: Why Geometric Retracements Work
The Psychology of Pullbacks
When price drops 65%, most traders experience:
Fear that it will continue falling forever
Doubt about whether the trend is still valid
Paralysis from watching others panic sell
Professional traders see the same chart differently:
Defined risk at structural support
Historical patterns of mean reversion
Favorable asymmetry when risk is small relative to potential reward
The majority fears what professionals buy.
📉 Understanding Market Structure
Markets don't move in straight lines. They:
Trend in one direction (impulse)
Retrace to gather liquidity (correction)
Resume the primary direction (continuation)
The 0.618 to 0.786 retracement zone historically shows the highest probability of reversal in trending assets. Why?
Early sellers have exhausted
Value buyers recognize the discount
Risk can be defined tightly below support
At $169, MSTR offered:
Clear invalidation below $131.80
Multiple timeframe confluence
Structural support from prior consolidation
🎯 Why This Entry Made Sense
Risk Was Defined
Below $169, the next logical support was $131.80. If price broke below that level, the bullish structure would be invalidated. This gave us a clear exit point before entering.
Reward Was Probable
The previous resistance zone at $360 represented a 113% gain from entry. Even a conservative 50% retracement would target $220+, still offering excellent reward.
Structure Aligned
Monthly support held
Trendline from 2020 intact
Retracement zone tested multiple times
Volume showed exhaustion, not acceleration
📊 Tools Used for This Analysis
Fibonacci Retracement
Identified the 0.786 level as a deep pullback zone where buyers historically step in.
Trendline Analysis
The ascending line from 2020 provided dynamic support that price respected.
Volume Profile
Showed accumulation at lower levels with decreasing selling pressure.
Horizontal Support Zones
The $105-110 monthly level acted as a psychological floor, preventing further collapse.
Risk/Reward Calculator
Entry: $169
Stop: $131.80
Target: $360
Result: 5.13:1 asymmetry
🛡️ Risk Management Framework
Stop Loss Below Structure
Our stop at $131.80 was placed below the invalidation point. If price reached that level, our thesis would be wrong and we'd exit with controlled loss of $37.20 per share.
Position Sizing Based on Risk
With $37.20 risk per share, position size was calculated to risk only 1-2% of total capital. This meant even if wrong, the account remained intact.
Target Based on Structure, Not Hope
$360 wasn't arbitrary. It represented previous resistance where sellers had historically appeared. We planned to reduce exposure at that level.
🧠 Trader Psychology: Why Most Miss These Setups
Fear of Catching a Falling Knife
After a 65% drop, the brain assumes it will continue. But without defined support, there's no knife just falling into the void. At $169, support was visible and the stop at $131.80 was clear.
Recency Bias
The most recent price action (the drop) feels like it will continue forever. Historical structure suggests otherwise, but emotions overpower data.
Herd Mentality
When everyone is bearish, contrarian positions feel uncomfortable. But the best risk/reward setups rarely have crowd consensus.
Waiting for Confirmation
Many traders wait for price to "prove" itself by moving higher first. By then, risk has expanded and reward has diminished. Entry at $169 with $37.20 risk is superior to entry at $250 with $118.20 risk to the same stop level.
📌 Proper Entry Execution
We didn't enter the entire position at once:
First third at $169 (initial position)
Second third at $155 if support retested (average down if structure held)
Final third reserved if $140 tested (closer to stop but maximum opportunity)
This scaling approach:
Reduced emotional pressure
Improved average entry if structure tested
Maintained discipline through volatility
🏆 What Professionals Do Differently
They Don't Chase Momentum
Entry at $543 (the top) felt safe because price was rising. Entry at $169 felt dangerous because price was falling. Professionals understand that perceived safety is often maximum risk.
They Define Risk First
Before asking "how much can I make," they ask "how much can I lose." The $131.80 level answered that question clearly.
They Accept Being Wrong
If MSTR broke $131.80, the position would be exited without hesitation. No hoping, no averaging down into a broken structure. Wrong is wrong.
They Journal Every Decision
Entry logic, risk parameters, and target zones were documented before entry. This removes emotion from exit decisions later.
🎯 Key Takeaways
✅ Risk/reward asymmetry matters more than being right: A 5:1 setup allows you to be wrong multiple times and still profit overall if position sizing is consistent.
✅ Structure defines opportunity: Random entries have random outcomes. Entries at defined support with clear invalidation have statistical edges.
✅ Emotions are the enemy: When $169 felt scary, that was the signal. When $543 felt safe, that was the warning.
✅ Patience beats prediction: We didn't predict $169 was the bottom. We identified it as a zone where risk was small ($37.20) and reward was large ($191). That's enough.
⚠️ Important Disclaimers
This analysis is educational and reflects a specific position entry based on technical structure. It is not financial advice or a recommendation to buy or sell MSTR or any security.
Position entries, stop losses, and targets are shared for educational purposes to demonstrate risk management principles. Your risk tolerance, timeframe, and capital allocation should differ based on your individual circumstances.
Past price structure does not guarantee future performance. MSTR could have broken $131.80 and invalidated this setup entirely, resulting in a controlled loss. Not all setups work, which is why risk management exists.
Always conduct your own analysis, consider your risk tolerance, and consult with a financial professional before making investment decisions. All trading and investing involves risk of loss.
✨ Support This Content
If this breakdown helped you understand structure-based entries and risk management, leave a comment with your thoughts or questions. Your engagement helps us create more educational content like this.
📜 Do your own research. Manage your risk. Trade with discipline.
