$WYFIFundamental Analysis: Explosive Growth Tempered by Widening Losses
WhiteFiber is positioning itself decisively within the high-demand AI and HPC infrastructure arena. The company's operational momentum is underscored by several key catalysts:
Transformative Revenue Run Rate: The upcoming full-quarter operation of its Montreal data center, projected to generate a $1 million monthly revenue run rate, represents a pivotal step toward scaling and financial inflection.
Forward-Looking Expansion: The development of its NC-1 data center in North Carolina, slated for Q1 2026, demonstrates a clear growth roadmap. Notably, the reported strong interest from potential counterparties suggests robust underlying demand for its planned capacity.
Strong Underlying Metrics: The Q3 revenue of $20 million (up ~65% YoY) paired with a healthy gross margin of 63% confirms the company's core business model is viable and operating in a high-value segment.
However, this growth narrative is currently shadowed by mounting operational expenses. The widening operating loss of $14.5 million, driven by booming general and administrative costs, highlights the "cash burn" phase typical of rapidly scaling infrastructure companies. This creates a binary investment profile: success depends on revenue scaling fast enough to overtake these expenditures before capital constraints arise.
Wall Street's sentiment leans strongly toward the growth story. With 8 out of 10 analysts rating WYFI a Buy (including two new Outperform ratings in the past month) and a consensus pointing to an average upside potential of 108%, the institutional outlook is decidedly optimistic, albeit acknowledging the inherent risk.
Technical Analysis: A Structured Roadmap with Key Levels
The stock's price action provides a clear technical map to navigate this fundamental volatility.
Critical Support Hierarchy:
Support 1: $15.00 – This is the primary defensive level for the bullish thesis. A sustained hold above this zone is crucial for maintaining near-term upward momentum.
Support 2: $10.00 – A breach of $15.00 would likely trigger a move toward this more substantial secondary support. This level represents a major psychological and technical floor where long-term buyers may re-enter.
Support 3: $8.00 – This is the ultimate support and a critical "line in the sand." A breakdown below this level would severely damage the technical structure and likely force a fundamental reassessment.
Bullish Trigger and Target:
The immediate resistance and momentum trigger sits at $25.00. A decisive break and sustained close above this $25.00 threshold is the technical confirmation needed to initiate the next major leg higher.
Upon a confirmed breakout above $25.00, the primary upside price target is projected at $30.00. This objective is derived from measuring the potential of the current consolidation pattern and aligns with the initial phases of the substantial upside implied by analyst projections.
Synthesis and Strategic Outlook
WhiteFiber embodies a classic growth-stage investment: tremendous potential fueled by crucial industry tailwinds, but a path fraught with execution risk and current profitability challenges. The convergence of a clear expansion narrative (Montreal, NC-1) and a strong bullish analyst consensus creates a compelling fundamental backdrop.
This backdrop is framed by a technical structure offering precise navigation points. The trade thesis is essentially this: maintain a bullish bias so long as price holds above the key $15.00 / $10.00 support zone. Investors should watch for a break above $25.00 as the signal for a likely acceleration toward the initial $30.00 target, which would serve as the first significant validation of both the growth story and the technical pattern. A failure to hold critical support, however, would signal a prolonged period of consolidation or correction is needed.

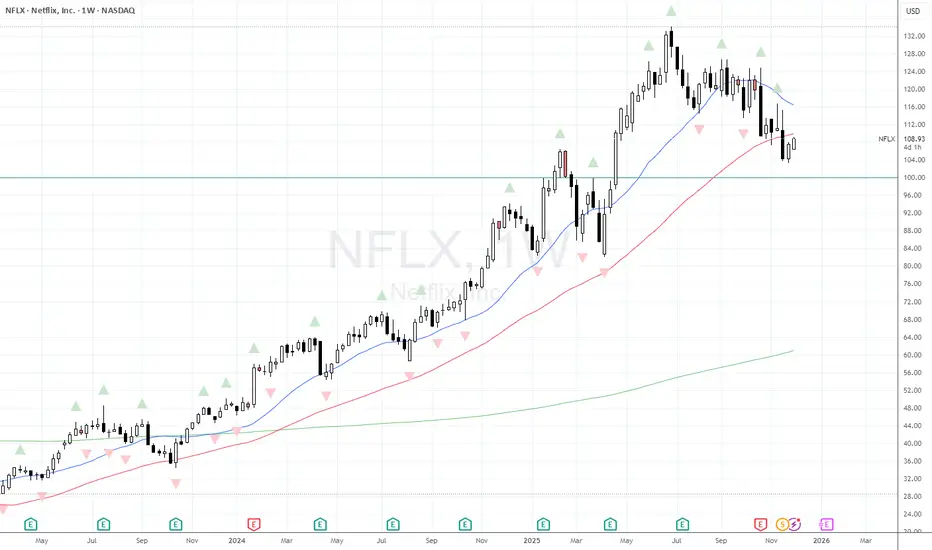
Next move for $NFLX down to $100?#NFLX had a great run until the summer of 2025 but has struggled since then. I'm sure there's many reasons for that - the concerns about the Warner Bros acquisition will undoubtedly be one of them. However from a technical standpoint the price has continued to make lower lows as it retreated from $132.
We know find ourself closing last week beneath the Weekly 50MA, which it hasn't done for approx 2 years. Is this an area for a bounce? There's been lots of positive news about the release of the final series of Stranger Things (I haven't watched it - but then I don't need to as I have a 14 year old niece who loves it, and insists on giving the family a complete run down of the show!)
Personally I would want to see price rally back into the area of the 20 & 50 Weekly MA's before rolling over and then moving lower to $100 - which could be a stronger level of support, and a real inflection point where price looks to make a decision.
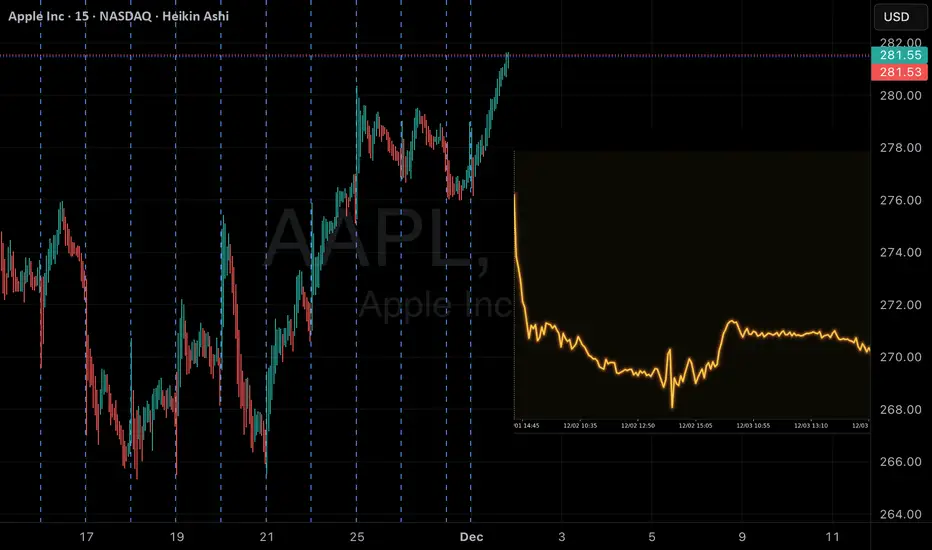
AAPL Weekly Put Play – High-Probability Reversal Setup AAPL Weekly Signal | 2025-12-01
Instrument: AAPL
Signal Type: Weekly Swing
Direction: BUY PUTS (SHORT)
Confidence: 58%
Conviction Level: Speculative
Expiry: 2025-12-05 (4 days)
Recommended Strike: $280.00
Entry Price: $1.24 (midpoint)
Profit Target 1: $2.48 (100% gain)
Profit Target 2: $3.72 (200% gain)
Stop Loss: $0.62 (50% loss)
Position Size: 2% of portfolio (speculative due to low conviction)
Weekly Momentum: NEUTRAL (+0.82%)
Options Flow: Bearish (High Put/Call Ratio, 1.78)
Risk Level: HIGH – low confidence, short expiry, high theta decay, overbought RSI
Analysis Summary:
Katy AI Prediction: Downward trend from $281.12 → $278.32 (-1.05%), with 78% of predictions below current price. Average target $277.71 (-1.21%).
Technical: Extremely overbought (RSI 83.8), VWAP support $277.96, near weekly high (96% range).
News/Market Context: Neutral to slightly negative; Silver squeeze and rising yields create pressure.
Options Flow: Institutional puts heavily bought; maximum volume at $228 put.
Key Notes:
Weekly directional guidance suggested BUY CALLS, but Katy AI shows strong bearish trajectory.
Extreme caution due to low AI confidence (50%) and short expiry.
Consider partial profits at Target 1 to mitigate theta decay.
Stop loss at 50% to limit downside.
$IREN: A Period of Consolidation with Defined Risk ParametersNot much change on $IREN. The price action for NASDAQ:IREN currently reflects a period of lateral consolidation and equilibrium, with neither bulls nor bears establishing clear dominance in the near term. This pause follows previous volatility and represents a critical juncture where the asset is building energy for its next significant directional move. While there have been no major fundamental catalysts to alter the overarching narrative recently, the technical framework provides clear levels to monitor for the next phase.
Key Technical Levels and Scenarios
The market structure is defined by two primary support zones, which will act as the battlefield for control.
Immediate Bull Line (Support 1): This is the first and most crucial level of defense for the bullish thesis. A sustained hold above this zone suggests that underlying demand remains intact and that the consolidation is merely a pause within a larger positive trend. It represents the line where buyers have historically stepped in.
Secondary Support (Support 2): This lower level represents a more significant technical and psychological area. A breakdown below Support 1 would shift market sentiment negatively, increasing the likelihood of a test at Support 2. A successful hold here would indicate a deeper, but still valid, correction. However, a failure at this second tier would signal a more profound deterioration of the bullish structure and could open the door to further declines.
Strategic Outlook and Profit-Taking Horizon
Despite the current quietude, the broader strategic outlook maintains a bullish bias contingent on holding key supports. The consolidation is viewed not as a reversal of trend, but as a necessary period of digestion.
The primary upside objective remains a take-profit target in the vicinity of $60. This level is derived from a combination of technical measurements, including previous chart structure, Fibonacci extensions, and the implied momentum of the prior trend. A successful rally from either Support 1 or a robust rebound from Support 2 would project price action toward this target zone.
Conclusion
In essence, NASDAQ:IREN is in a holding pattern. "Not much change" signifies a buildup of potential energy. Traders and investors should now watch for a decisive break from this equilibrium, with a close watch maintained on Support 1 as the immediate bellwether. A hold there keeps the path to the $60 target clear, while a break lower would pivot focus to the durability of Support 2 and necessitate a recalibration of the near-term timeline for upward movement.

Hewlett Packard Enterprise Expands AI With NVIDIA-Powered LabHewlett Packard Enterprise (NYSE: HPE) has strengthened its position in the global AI infrastructure race with a major announcement: the launch of an AI Factory Lab in Grenoble, France, built in partnership with NVIDIA. The facility is designed to let enterprises test sovereign AI systems inside the European Union—an increasingly important requirement as governments tighten rules around data security, residency, and compliance.
The lab will run on a full stack of NVIDIA AI Enterprise software, HPE servers, NVIDIA accelerated computing, and Spectrum-X Ethernet networking. With demand for sovereign AI rising across Europe, the new lab gives enterprises a secure environment to validate workloads before deployment. The site is slated to open in Q2 2026, positioning HPE as a leader in regulatory-aligned AI infrastructure.
HPE’s news extended beyond the lab launch. The company upgraded its Private Cloud AI platform, adding support for NVIDIA RTX PRO 6000 Blackwell Server Edition GPUs and integrating STIG-hardened and FIPS-enabled configurations for air-gapped environments. Fractional GPU support through NVIDIA Multi-Instance GPU (MIG) technology brings cost-efficient scaling to private AI clusters.
Another key reveal was the HPE Alletra Storage MP X10000 Data Intelligence Nodes, powered by NVIDIA acceleration to analyze and process data inline. These nodes will be available for order in January 2026. HPE also rolled out the NVIDIA GB200 NVL4 system, offering up to 136 GPUs per rack and now available to order.
New partnerships with CrowdStrike, Fortanix, and Carbon3.ai add security and confidential computing layers, with HPE supporting a new Private AI Lab in London. The company emphasized that sovereign AI solutions are available today with country-specific compliance frameworks.
Technical View
HPE remains in a bullish structure despite retracing from its recent $26 high. Price is pulling back toward $18, a likely support area. Holding above this zone keeps the broader uptrend intact.

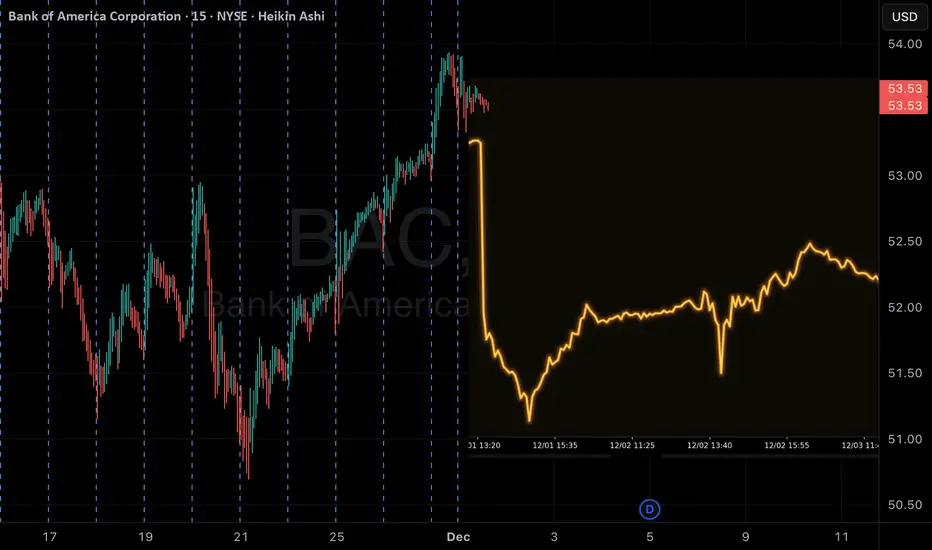
BAC Weekly Alert — Katy AI Signals Potential Pullback📊 BAC QuantSignals V3 Weekly — Trading Information (2025-12-01)
🔹 Weekly Direction (LLM): BUY CALLS
Confidence: 58%
Risk: HIGH (low conviction + uncertainty)
🔹 Katy AI Direction: BUY PUTS
Predicted Move: -1.59%
Katy Confidence: 50%
⚠️ Directional Conflict: MEDIUM Severity
📈 Trade Levels
Expiry: 2025-12-05 (4 days)
Recommended Strike: $53.50P
Entry: $0.48
Target 1: $0.72
Stop Loss: $0.29
🧠 Analysis Snapshot
Katy AI (Bearish)
Target: $52.88 (-1.3% from $53.56)
Full series shows steady decline toward $51.29 (-4.25%), then mild rebound but still below current price.
Technical Levels
Resistance: $53.94
Support: $51.40
VWAP: $52.66 (below price → downside pressure)
Week Range: 65% (room to fall)
News Sentiment
No major BAC-specific catalysts
Overall neutral environment
Options Flow
No unusual activity
Flow bias: Neutral
Close of the ENDLast price of MSTR could be between
$100-$80.
It will take more benefics and star a change of tendence.

MPWR - Long Setup: 20%+ Upside Potential📈 Ticker: MPWR (Monolithic Power Systems)
Recommendation: LONG
Instrument: NASDAQ:MPWR
Timeframe: Daily + Weekly
Strategy: Position Trade with Swing Entry
🎯 Trade Parameters
Entry Price: $930.36
Stop Loss: $850.41
Take Profit: $1,121.71
Risk/Reward: 1:2.4
Position Size: Medium
Holding Period: 4-12 weeks
📊 Technical Analysis
Multi-Timeframe Convergence:
Weekly Chart (Bullish Structure):
Uptrend intact since 2020
Higher highs & higher lows
Trading above 50-week MA ($~880)
Volume profile shows accumulation
Daily Chart (Entry Setup):
Consolidation in bull flag pattern
RSI(14): 48.39 (neutral, room for upside)
MACD: Histogram turning positive
Price holding above key support at $910
Bollinger Bands: Middle band at $932 (coiling)
4-Hour Chart (Momentum Building):
Higher lows forming
RSI(14): 50.95 (bullish momentum)
MACD crossing above signal line
Volume increasing on up moves
🏆 Key Levels & Pattern
Support Zones:
$910-915 (recent consolidation)
$880-890 (50-week MA + psychological)
$850.41 (Stop Loss - pattern invalidation)
Resistance Zones:
$960-970 (recent highs)
$1,000 (round number + measured move)
$1,050 (extension target)
$1,121.71 (Primary TP - ATR projection)
Pattern Recognition:
Bull Flag formation on daily
Target: $1,120-1,130 (flag pole projection)
Measured move aligns with TP
💼 Fundamental Backdrop
Strengths:
Revenue Growth: +21.2% YoY
Net Income: +318% YoY (explosive)
Debt-Free Balance Sheet
Strong margin expansion
Semiconductor sector tailwinds
Valuation:
P/E: 23.8x (reasonable for growth)
P/S: 16.7x (high but justified by margins)
ROE: >30% (exceptional)
🎮 Trade Management
Entry Strategies:
Aggressive: Market order at current levels
Conservative: Limit at $925-930 zone
Patient: Wait for break above $935 with volume >500k
Exit Strategy:
TP1: $1,050 (take 30-50% profit)
TP2: $1,121.71 (remaining position)
Trailing Stop: Move to breakeven at $1,000
Time Stop: Exit if no progress in 4 weeks
⚡ Catalysts & Triggers
Immediate Catalysts:
Break above $935 with volume
Semiconductor sector rotation
Market risk-on sentiment
Upcoming Events:
Next earnings: February 2026 (est.)
Sector news (SMH, SOXX movement)
Fed policy decisions
📉 Risk Assessment
Primary Risks:
Market correction affecting growth stocks
Semiconductor sector weakness
Valuation compression in tech
Break below $850 support
Risk Mitigation:
Strict stop loss at $850.41
Monitor SOXX ETF for sector health
Regular technical checkups
Consider hedging with options
🔍 Confirmation Signals Needed
Bullish Confirmation:
Daily close above $935
RSI(14) > 55 on daily
Volume > 400k on breakout
SOXX above $520
Warning Signs:
Daily close below $910
RSI(14) < 40 on daily
Volume drying up
Semiconductor sector breakdown
📱 Monitoring Plan
Daily:
Price action relative to $910 support
RSI momentum
Volume patterns
Sector correlation
Weekly:
Overall trend structure
Major support/resistance tests
Fundamental developments
🏁 Trade Thesis Summary
Bull Case (70% Probability):
Bull flag breakout to $1,120+
Strong fundamentals support higher valuation
Sector tailwinds continue
Technical alignment across timeframes
Bear Case (30% Probability):
Failed breakout, range continuation
Sector rotation out of semis
Market correction hits growth stocks
Expected Move: +$191.35 per share (+20.6%)
Max Risk: -$79.95 per share (-8.6%)
🎨 Chart Setup Instructions:
Draw Support/Resistance:
Horizontal line at $910 (support)
Horizontal line at $960 (resistance)
Horizontal line at $1,121 (target)
Add Indicators:
RSI(14) - watch for >55 breakout
MACD(12,26,9) - crossover confirmation
Volume profile
Pattern Recognition:
Highlight bull flag from $1,050 to $910
Project measured move to $1,120-1,130
#TradingView #MPWR #NASDAQ #Semiconductors #PositionTrading #BullFlag #GrowthStocks #TechnicalAnalysis #RiskManagement
Disclaimer: This is educational content, not financial advice. Trade at your own risk. Past performance doesn't guarantee future results. Always conduct your own analysis and consider your risk tolerance.
Liked this idea? 👍 Follow for more technical setups!
Questions? Drop them in comments below! ⬇️

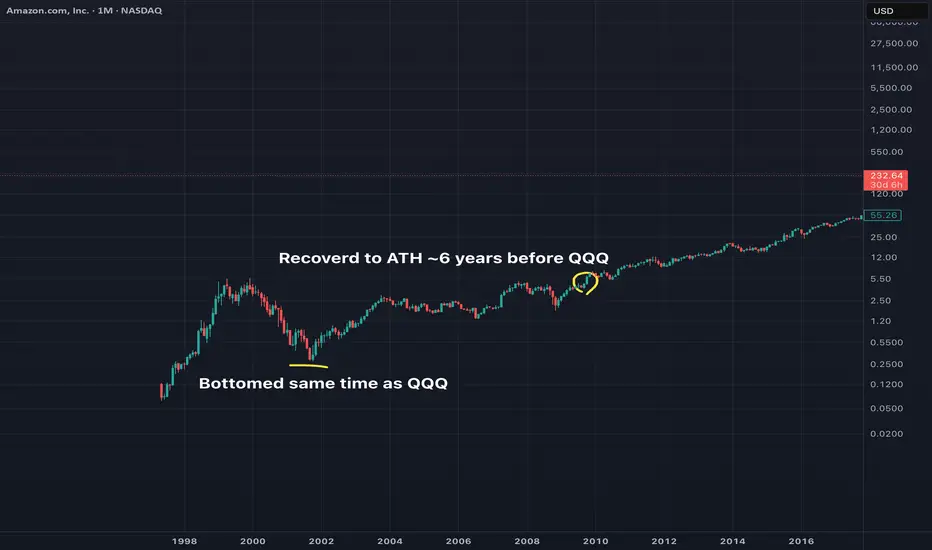
Amazon in the dotcomsHere's a chart of amazon during the dotcom crash. I think it's a useful case study especially now for the DeFi Crash
LDOS risk/reward favoring the downside.LDOS Rejecting at highs on large time frames as expected after uptrend violation on the monthly and return to highs.

WMT eyes on $95.68 above 93.38 below: Double Golden fibs are KEYWMT has been orbitting this Double Golden zone.
$95.68 is a Golden Genesis, $83.38 a Golden Covid.
This is the "highest gravity" cluster any asset can have.
This is a very important landmark in this stock's lifetime.
==================================================
.

$IREN, double top, short round 2?This yellow box is not likely to hold since we are this late in trend.
First target $30 zone.

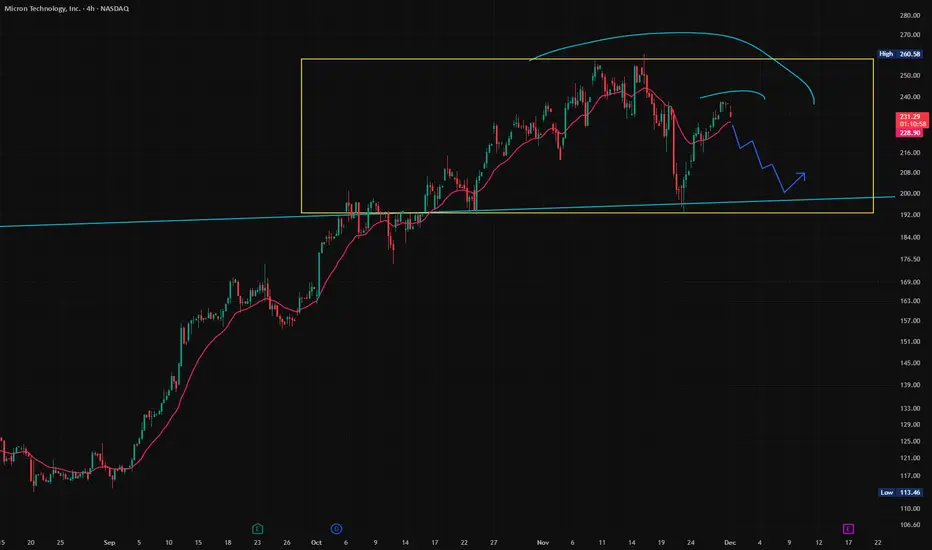
$MU short — back to $200 again?Trend is stretched. The more extended a move gets, the higher the odds we transition into a range.
$200 round number is the magnet zone.
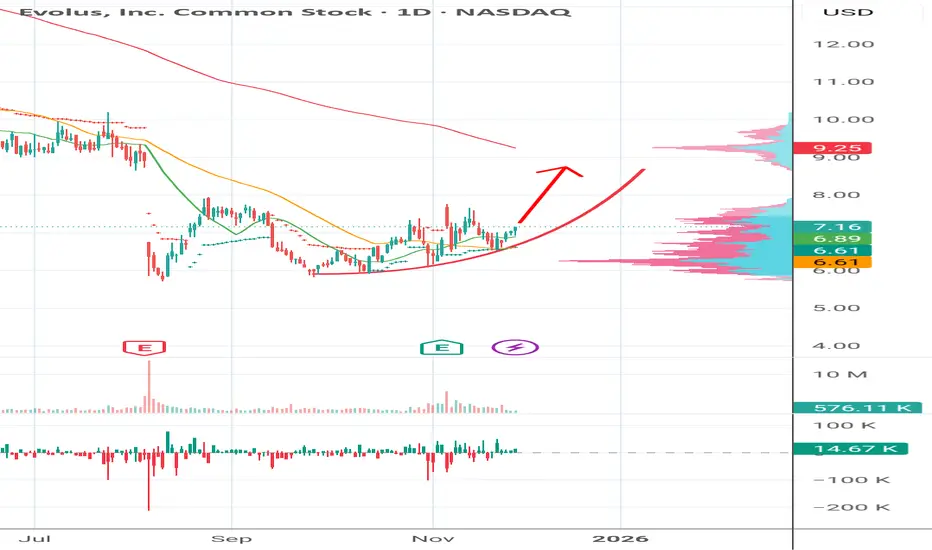
Eols. Closing the gap.The company recently exceeded revenue estimates for the quarter. Despite market turbulence, the price is holding up well. Short float is 22%. Temporary undervaluation. The current price is far from its 52-week high, which means there is room for recovery.
Analyst consensus and targets. Some recent reviews give a target in the $18 range,
which is significantly higher than the current ~$7. This creates a "vacuum" in price expectations, which provides an opportunity for growth. The company usually shows growth from November to March.
Walmart Stays Strong, Ready for the Next LeapWalmart is proving once again why it remains one of the strongest companies in the world. Even as many retailers struggle, Walmart continues to grow, innovate, and win the confidence of investors.
Its stock is already up 22% this year, beating the S&P 500, and many signs show that the company could stay strong in 2026 as well.
◉ Why Walmart Is Winning
Walmart has become a perfect mix of traditional retail and modern technology.
Strong results:
● Revenue up 5.8% year over year
● Operating income up 8%
● EPS rising from $0.58 to $0.62
Market share growth:
Walmart gained more customers in grocery and general merchandise. Even higher-income shoppers have been spending more at Walmart.
E-commerce strength:
Online sales grew 27% as Walmart expands its online offerings and reaches customers beyond its stores.
Growing advertising business:
Walmart’s ad sales increased 53% in the latest quarter, turning it into a serious player in retail advertising.
◉ Technology Is Shaping Walmart’s Future
Walmart is investing heavily in technology to stay ahead:
● Partnering with OpenAI to let customers use ChatGPT for shopping and checkout
● Training developers to code faster with AI
● Automating supply chains and warehouses
● Buying Vizio to strengthen its advertising ecosystem
These changes are helping Walmart protect its low-price model while moving closer to becoming a tech-driven retailer.
◉ Leadership and Listing Changes
Two important updates were recently announced:
● CEO Doug McMillon is stepping down after ten years
● John Furner, head of Walmart U.S., will become the new CEO
Walmart also announced that it will move its stock listing from the New York Stock Exchange to the Nasdaq. This connects Walmart more closely with tech-focused indexes and funds.
◉ Dividend Stability
Walmart is a Dividend King, raising its dividend every year for more than 50 years. This adds strong stability for long-term investors.
◉ Technical Outlook
● From a technical point of view, the stock recently broke out of an ascending triangle pattern and touched a new all-time high.
● If this momentum continues, Walmart could see another strong rally in 2026.
◉ Final Thoughts
Walmart is winning today and building an even stronger position for the future. With solid financials, strong e-commerce growth, expanding advertising revenue, and steady leadership changes, the company is well-placed for 2026 and beyond.

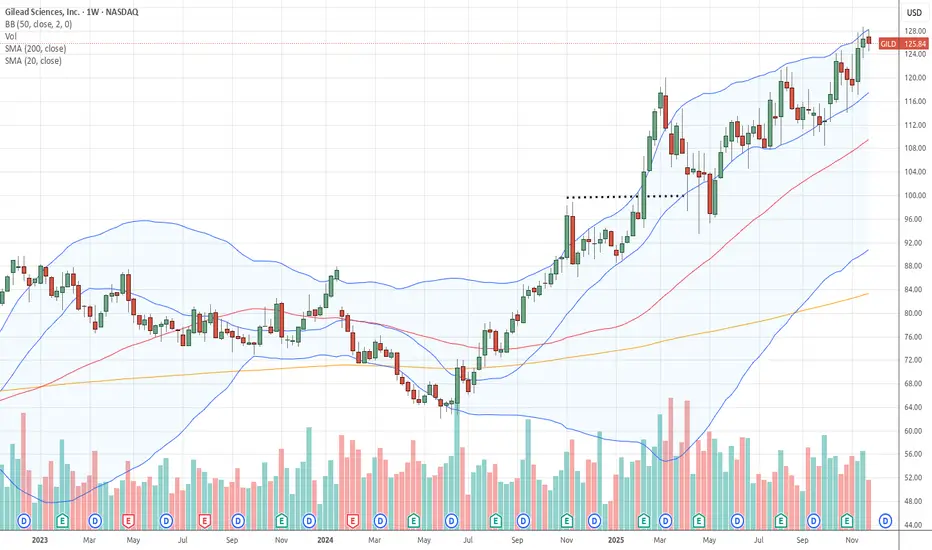
$GILD Tradespoon – Neutral Entry $127.51Tradespoon model shows a neutral signal for $ NASDAQ:GILD . Predicted range: $125.13–$128.02. Trend: –0.37%. NASDAQ:GILD
QXO - The Path to SuccessQXO is turning into a well-known and hot commodity these days - with Brad Jacobs at the helm and a ton of cash at his disposal for future acquisitions.
We have seen a nice move in recent weeks off of the mitigation of HTF demand. We are now sitting at what I call a "Flip Zone" (grey box) - this is an area of liquidity that has intentionally been created in order for the controlling party to utilize it for future breakouts.
This flip zone, which has been in the making since June of this year, was rejected as recently as November.
Below, I highlight the 3-step process price needs to make in order to break out of our lower time frame liquidity building teal/blue and continue the uptrend toward new higher time frame highs.
Step 1: Break through the flip zone and subsequently our red stronger selling algorithm to test (and likely reject) off of our HTF supply zone - turning it into a flip zone.
Step 2: Retest our current flip zone, turning it into support and demand for future use.
Step 3: Break out of our HTF Supply/New Flip Zone and prove the sell-side of our teal/blue tapered algorithm.
Once we prove teal on the sell-side, as we did on the buy-side, we will have the opportunity to take an extremely confident long trade on the retest of one of our flip zones.
Although the momentum is building and we may be in extremely undervalued territory at the moment, do not forget that the market needs to go through the liquidity process in order to ensure an efficient and healthy HTF breakout. This takes time - but as long as you're following along with the story of the chart, you won't be eager for it to happen - you will accept the nature of the market and take advantage of opportunities that the story gives you.
Happy Trading :)

LULU momentum setup favors bullish continuation this week
Current Price: $184.18
Direction: LONG
Confidence Level: 62% (Limited snippet depth but leaning bullish from stronger social sentiment and price positioning near support)
Targets:
- T1 = $188.00
- T2 = $192.00
Stop Levels:
- S1 = $182.00
- S2 = $179.50
**Wisdom of Professional Traders:**
This outlook combines what multiple professional traders and market experts are highlighting about the current environment, even though direct LULU coverage on technical specifics was minimal in the snippets. The collective trader consensus leans towards finding opportunity in irrational market moves when macro factors (like Fed rate cuts) push equities higher. Several traders note that this kind of backdrop favors quality retail and apparel names positioned near technical supports, which frames the bullish case for LULU over the next few sessions.
**Key Insights:**
Here's what's driving this: the snippets touched on how major macro events, such as anticipated rate cuts amid financial stress, can fuel rallies in equities despite negative headlines. In fashion/athleisure, LULU tends to benefit when Wall Street gets aggressive with risk-on positioning. While direct price levels weren't cited by traders in the available data, the broader observation was that such “crazy market” phases often lift premium brands as consumer demand stabilizes.
What caught my attention in the sentiment was the strength of bullish bias on X — all trading-relevant posts showed optimism. This shorter-term enthusiasm usually manifests as bounces off nearby support zones, suggesting a positive setup for this week.
**Recent Performance:**
Last week, LULU's price consolidated around the $182–$184 area after a small pullback from mid-November highs. This area's stability hints at support holding before a potential leg higher. We saw intraday attempts to push above $185 fail late in the sessions, but those rejections were light and lacked follow-through selling, which supports the case for upside attempts now.
**Expert Analysis:**
Several professional traders I track emphasized that in uncertain macro conditions, strong brands with loyal customer bases can outperform in short bursts. They noted that anticipated institutional rotation into retail leaders ahead of holiday season might be a driver. With current price hugging support and broader social sentiment bullish, the risk-reward for a long position looks attractive, especially with tight nearby stops.
The wider market's potential upside from Fed policy speculation could give LULU the push needed to test key near-term resistance around the high $180s and low $190s.
**News Impact:**
No significant negative headlines have emerged for LULU in the past week. Macro commentary on rate cuts and consumer resilience is helping set a constructive tone for discretionary stocks. Seasonal momentum into December and holiday shopping trends should add fundamental support to technical setups.
**Trading Recommendation:**
Here's my take: I'd initiate a long position near the current price of $184.18, aiming for a breakout above $188 in the coming days and potentially reaching $192 if momentum builds. Stops make sense just below recent support levels at $182 and $179.50 to protect against any swift reversal. Given my confidence is in the low 60s due to limited depth in professional trader snippet data, I would size positions modestly, watching price action closely for confirmation.

$MCD to 320 One can clearly observe an ascending triangular chart pattern, my opinion is bullish, might be -3% before the run, possible entry on thursday

AVGO at a Critical Breakout: AI Boom or Pullback Ahead?Bullish Scenario (Breakout Above Channel)
Entry:
• Valid breakout above $405–410
• Preferably a daily close above the channel top
Targets:
1. Target 1: $430
2. Target 2: $455–460 (main target)
Stop Loss:
• $395
(If price falls back below the broken resistance)
Bearish Scenario (Rejection From Channel Top)
Entry:
• Bearish rejection at the upper channel
• Confirmation through reversal candles
Targets:
1. Target 1: $380 (midline)
2. Target 2: $350–355 (bottom of channel)
Stop Loss:
• $408–412
(Above the channel top and wick of rejection)

TSLA: Hold or SellHello Traders,
Regarding the technical point of view!
Telsa have been previously overbought. there are two resistances on its way! 1st the dynamic and 2nd the static one!
A triangle shape has been formed!
If you have it right now, I'm more with keeping it!
But you may find more profitable stocks to buy!

Walmart (WMT) surged on expectations of robust consumer spending
The US indices have maintained their uptrend, supported by evidence of strong US consumer spending during Black Friday, which confirmed sustained consumer strength.
Adobe (ADBE) reported that consumers spent 11.9 bln USD online during Black Friday, marking a record high and a 9.1% increase YoY. The NRF survey results also indicated a record-high 186.9 mln people planned to shop from Thanksgiving through Cyber Monday.
Walmart (WMT) stock price surged, reflecting its 3Q earnings surprise and growing anticipation for increased year-end consumption. CFO Rainy commented that the early demand for the holiday season is very strong, with robust spending particularly notable among high-income customers.
WMT breached above the ascending channel's upper bound and broke to a new high. Diverging bullish EMAs indicate a potential uptrend extension.
If WMT closes above the channel's upper bound, the price could advance toward the new high and psychological resistance at 111.50.
Conversely, if WMT breaks below the channel's upper bound and the support at 109.00, the price may retreat to the subsequent support at 106.00.

Amphenol has been a Momentum Powerhouse with a Strong UptrendAmphenol Corporation designs and builds high-performance connectors, cables, and interconnect systems for everything from communications and aerospace to automotive and industrial applications. Its products enable reliable, high-speed connectivity in demanding environments, and the company continues to expand through R&D and acquisitions that strengthen its global footprint.
Amphenol has been a standout momentum performer, up around 100% over the past year and 57% in the last six months. The trend is clean and sustained, with price holding well above both the 50-day and 100-day EMAs. RSI around 59 suggests mild consolidation after a strong run, and volume has eased slightly, hinting at a short-term pause rather than weakness. Backed by 53% revenue growth and a large-cap foundation and with a recent pullback to the 50-day SMA followed by a resumption of trend, this remains a quality trend stock worth watching for continuation setups after minor pullbacks.
Might be worth a look.
