Risks and Opportunities in the Global MarketOpportunities in the Global Market
Market Expansion and Revenue Growth
One of the primary opportunities in the global market is access to a much larger customer base. Companies can transcend domestic limitations and tap into emerging markets where consumer demand is growing rapidly. For example, markets in Asia, Africa, and Latin America offer a burgeoning middle class eager for goods, services, and technology, presenting massive revenue potential for multinational corporations. By diversifying geographically, businesses can reduce dependence on a single economy and enhance growth prospects.
Diversification of Investments
Global markets allow investors to diversify their portfolios across countries, sectors, and asset classes. Diversification reduces exposure to localized economic shocks and political instability. For instance, investing in equities, bonds, or commodities in different regions can balance risks arising from currency fluctuations, interest rate changes, or domestic policy shifts. This strategic allocation of resources can improve the risk-return profile of investments significantly.
Access to Innovation and Technology
Global integration fosters technological exchange and innovation. Companies can leverage global research and development networks, access advanced manufacturing technologies, and adopt best practices from international competitors. For emerging economies, collaboration with global firms can accelerate industrialization, improve efficiency, and enhance product quality. Likewise, global partnerships in sectors like artificial intelligence, renewable energy, and biotechnology create opportunities for breakthrough innovations that can reshape entire industries.
Economies of Scale and Cost Efficiency
Operating in the global market enables companies to achieve economies of scale. Large-scale production and sourcing from multiple countries often reduce costs, improve margins, and increase competitiveness. For instance, technology firms may design products in one country, source components from another, and sell worldwide, optimizing both production costs and logistics. Additionally, access to cheaper labor and raw materials in developing economies can further enhance profitability.
Financial and Capital Access
Global financial markets provide businesses and governments with access to diverse funding sources. Companies can raise capital through international stock exchanges, global bonds, or foreign direct investment. Governments can finance infrastructure and development projects through international loans or aid. This access to global capital allows for ambitious projects and long-term strategic investments that would otherwise be unattainable.
Strategic Partnerships and Alliances
The global market encourages cross-border collaborations. Strategic alliances, joint ventures, and mergers allow companies to enter new markets more efficiently and share risks. Partnerships with local firms also help navigate regulatory environments, cultural differences, and logistical challenges. Collaborative ventures often drive innovation, improve market penetration, and enhance brand credibility in foreign markets.
Risks in the Global Market
Economic Volatility and Financial Crises
Global markets are highly interconnected, making them susceptible to economic volatility. A crisis in one major economy can ripple across borders, affecting trade, investment, and employment worldwide. The 2008 financial crisis and the COVID-19 pandemic demonstrated how quickly global shocks can destabilize markets. Currency devaluations, stock market crashes, and sudden shifts in capital flows are persistent risks for investors and multinational companies.
Political and Geopolitical Risks
Political instability, trade disputes, and geopolitical tensions pose significant risks. Conflicts, sanctions, or changes in government policies can disrupt supply chains, inflate costs, and limit market access. For instance, trade wars between major economies may lead to tariffs, export restrictions, and reduced demand for goods. Political risk is particularly relevant for companies investing in emerging markets, where governance structures may be less predictable.
Regulatory and Compliance Challenges
Global operations require navigating a complex web of regulations, including taxation, labor laws, environmental standards, and data protection. Non-compliance can result in legal penalties, reputational damage, or operational shutdowns. Differences in regulations across countries also make standardization difficult, increasing operational costs and complexity. Companies must continuously monitor regulatory developments to mitigate compliance risks effectively.
Currency and Exchange Rate Risks
Engaging in international trade and investment exposes companies and investors to currency risk. Exchange rate fluctuations can impact profit margins, investment valuations, and competitiveness. For example, a strengthening domestic currency can make exports more expensive, reducing sales abroad. Conversely, a weakening currency may inflate the cost of imported raw materials. Hedging strategies, while useful, do not eliminate currency risk entirely.
Supply Chain Disruptions
Global supply chains are vulnerable to natural disasters, pandemics, labor strikes, and geopolitical tensions. Disruptions can delay production, increase costs, and reduce customer satisfaction. For example, the COVID-19 pandemic revealed the fragility of just-in-time supply chains, prompting companies to reconsider sourcing strategies and inventory management. Dependence on specific regions for critical components increases operational risks.
Technological and Cybersecurity Risks
While global markets offer access to technology, they also expose businesses to cybersecurity threats. Data breaches, intellectual property theft, and cyberattacks can lead to financial loss, reputational damage, and legal liabilities. Rapid technological changes also create the risk of obsolescence; companies that fail to innovate may lose competitive advantage. Protecting digital infrastructure and continuously adapting to technological trends is critical for global operations.
Cultural and Market Risks
Entering new markets involves understanding local consumer behavior, culture, and preferences. Misreading these factors can result in product failures, marketing missteps, and brand damage. Companies must adapt strategies to local contexts while balancing global standardization. Failure to address cultural sensitivities can hinder market acceptance and growth.
Balancing Risks and Opportunities
Navigating the global market requires a careful balance between seizing opportunities and mitigating risks. Strategies for achieving this balance include:
Diversification: Spread investments across multiple countries, sectors, and currencies.
Risk Management: Implement financial hedging, insurance, and contingency planning.
Strategic Alliances: Collaborate with local partners to reduce market entry risks.
Technology and Innovation: Invest in digital infrastructure, cybersecurity, and R&D.
Compliance and Governance: Maintain robust regulatory compliance and ethical standards.
Agility and Adaptation: Be flexible in responding to geopolitical, economic, and market changes.
Conclusion
The global market is a dynamic landscape characterized by immense opportunities and significant risks. Companies and investors that can navigate these complexities stand to gain from expanded markets, innovation, cost efficiencies, and diversified revenue streams. However, economic volatility, political uncertainties, regulatory complexities, and technological risks demand careful planning, proactive risk management, and strategic foresight. The key to success lies in balancing the pursuit of growth with robust safeguards, leveraging both global connectivity and local insight. In an increasingly interconnected world, the ability to adapt and innovate while managing risk will define the long-term winners in the global market.
The Impact of a Global Market Crash1. Economic Impact
The immediate economic consequences of a global market crash are often severe. Equity markets, commodity markets, and bond markets typically experience significant declines, undermining investor wealth and reducing consumer confidence. As stock prices plummet, households and businesses see a decline in their net worth, which can lead to reduced spending and investment. Since consumption and capital investment are core drivers of economic growth, the contraction in these areas can trigger a broader economic slowdown or even a recession.
A crash can also cause a tightening of credit conditions. Banks and financial institutions, facing losses on their investments and worried about counterparty risk, often become more risk-averse, reducing lending to businesses and consumers. This credit contraction further slows economic activity, as companies find it difficult to finance operations or expansion, and households struggle to secure loans for major purchases like homes and vehicles.
2. Impact on Financial Institutions
Financial institutions are directly impacted by a market crash, as the value of their holdings in equities, bonds, derivatives, and other financial instruments decline. Banks, hedge funds, insurance companies, and investment firms may incur massive losses, potentially leading to insolvency or bankruptcy. The interconnected nature of global finance means that the failure of one major institution can have a domino effect, threatening the stability of other financial entities. The 2008 global financial crisis exemplifies this, where the collapse of Lehman Brothers triggered panic across the banking sector and required coordinated government interventions.
Moreover, liquidity crises often accompany market crashes. When investors rush to sell assets, the markets may not have enough buyers, causing asset prices to fall even further. Financial institutions that rely on short-term funding or that have leveraged positions may find themselves unable to meet obligations, further exacerbating systemic risks.
3. Impact on Businesses
The effect of a global market crash extends beyond the financial sector into real-world business operations. Companies face declining stock prices, reduced access to capital, and a contraction in consumer demand. Many firms may be forced to delay expansion plans, cut costs, or lay off employees to preserve cash flow. Industries heavily reliant on discretionary spending, such as travel, luxury goods, and automobiles, are particularly vulnerable.
Global supply chains may also be disrupted. Firms may reduce production in response to decreased demand, which can create ripple effects across suppliers and manufacturers worldwide. Additionally, companies engaged in international trade may face currency volatility and reduced foreign investment, compounding the financial strain.
4. Impact on Governments and Fiscal Policy
Governments are not immune to the effects of a global market crash. Falling asset prices reduce tax revenues from capital gains, corporate profits, and wealth taxes. Lower revenues combined with increased public spending to stimulate the economy can strain government budgets and increase fiscal deficits. Governments may be forced to implement stimulus measures, such as interest rate cuts, quantitative easing, or direct fiscal support, to stabilize markets and prevent a deeper recession.
Central banks often play a critical role during a market crash, using monetary policy tools to provide liquidity, stabilize financial institutions, and encourage lending. However, prolonged crises may limit the effectiveness of these measures, especially if investor and consumer confidence remains low. Additionally, countries with high debt levels or weak economic fundamentals may face challenges in implementing effective countermeasures.
5. Impact on Investors and Households
Individual investors often experience significant financial losses during a global market crash. Retirement savings, investment portfolios, and other forms of personal wealth can erode rapidly, affecting long-term financial security. Panic selling is common, leading to further declines in asset prices. Investors with leveraged positions or exposure to high-risk assets may face margin calls or forced liquidation, amplifying losses.
Households may also experience indirect effects, such as rising unemployment, reduced wages, and limited access to credit. Economic uncertainty can lead to changes in consumption patterns, with families prioritizing essential spending and reducing discretionary expenditures. This reduction in consumption can feed back into the broader economic slowdown, creating a cycle of declining demand and increasing financial stress.
6. Global Trade and Investment
A market crash in one region can quickly spread to others due to globalization and financial interconnectedness. Capital flows may reverse, with foreign investors withdrawing from emerging markets to seek safety in developed economies, causing currency depreciation and financial instability in affected countries. International trade can decline as businesses postpone investment, and demand for imported goods falls. Cross-border investments and mergers may be canceled or delayed, reducing economic growth opportunities and increasing geopolitical tensions.
7. Psychological and Social Impact
Beyond tangible financial consequences, a global market crash can have significant psychological and social effects. Investor confidence and public sentiment often deteriorate, leading to fear-driven behavior in both markets and daily life. Anxiety about job security, savings, and retirement can influence consumer behavior, affecting spending and investment decisions. In severe cases, prolonged economic hardship can exacerbate social inequalities, trigger political unrest, and challenge social cohesion.
8. Long-Term Consequences and Recovery
The recovery from a global market crash can take months or even years, depending on the underlying causes and policy responses. Market crashes often prompt regulatory reforms aimed at strengthening financial systems and reducing systemic risks. For example, the 2008 financial crisis led to significant changes in banking regulation, risk management practices, and global oversight mechanisms.
However, repeated or prolonged market crashes can erode trust in financial institutions, government policy, and market mechanisms. Investors may become more risk-averse, reducing the flow of capital to businesses and slowing economic innovation. Long-term structural unemployment, reduced income growth, and increased debt burdens can persist well beyond the initial crash period.
9. Mitigation Strategies
While the effects of a global market crash are profound, there are strategies to mitigate risks and cushion the impact. Diversification of investment portfolios across asset classes, sectors, and geographies can reduce exposure to systemic shocks. Governments and central banks can implement preemptive regulatory and monetary measures to ensure liquidity and maintain financial stability. For businesses, maintaining strong balance sheets, prudent debt levels, and flexible operational strategies can enhance resilience.
Education and awareness are equally important. Investors who understand market cycles and maintain long-term investment perspectives are less likely to engage in panic selling, preserving wealth and contributing to overall market stability.
Conclusion
A global market crash is more than just a financial phenomenon—it is an economic, social, and psychological event with far-reaching consequences. From financial institutions to households, from governments to multinational corporations, the impact is pervasive, highlighting the interconnectedness of modern economies. While market crashes are inevitable over time due to economic cycles and external shocks, their severity and duration can be influenced by effective policy responses, prudent financial management, and a resilient global economic system. Understanding these impacts is crucial for investors, policymakers, and businesses alike, helping to navigate crises, protect wealth, and foster sustainable recovery.

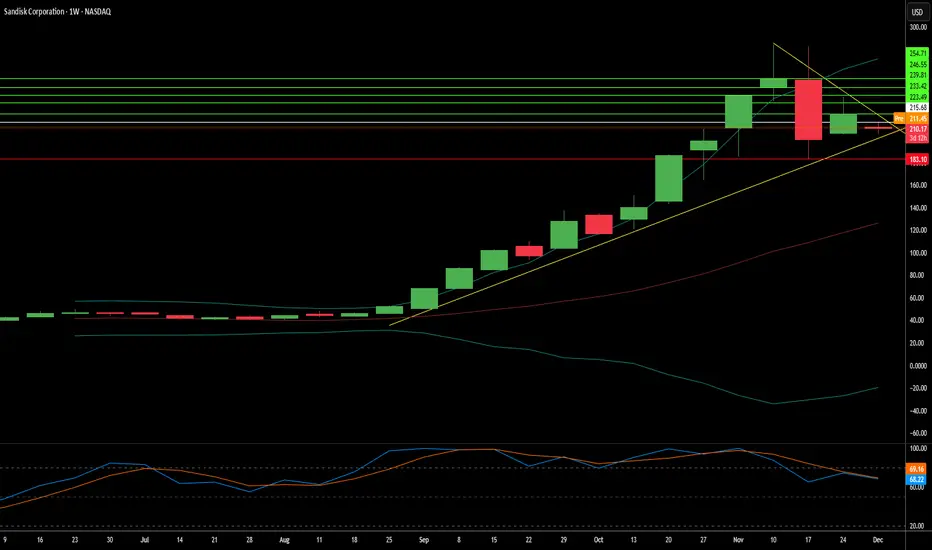
Is SanDisk Building the Foundation for the AI Economy?SanDisk Corporation (NASDAQ: SNDK) has emerged from its February 2025 spin-off from Western Digital as a pure-play flash memory powerhouse perfectly positioned for the AI infrastructure boom. The company's stock has surged toward $230 per share, with Morgan Stanley projecting targets as high as $273, driven by a rare convergence of technological innovation, geopolitical maneuvering, and macroeconomic tailwinds. The separation unlocked significant shareholder value by eliminating the conglomerate discount, allowing SanDisk to pursue an aggressive strategy focused exclusively on flash memory. At the same time, the hard disk drive business operates independently.
The company's BiCS8 technology represents a breakthrough in 3D NAND architecture, utilizing CMOS Bonded to Array (CBA) design that achieves 50% higher bit density and I/O speeds reaching 4.8Gb/s—critical capabilities for AI training and inference workloads. This technological leap, combined with strategic manufacturing partnerships with Kioxia in Japan and a calculated divestiture of Chinese assets to JCET, positions SanDisk to navigate the US-China semiconductor conflict while maintaining access to critical markets. The NAND flash market is experiencing a structural supply shortage following years of underinvestment, with contract prices surging by more than 60% in some categories and manufacturers unable to bring new capacity online until late 2026 due to the 18-24-month construction timeline for advanced fabs.
SanDisk's financial performance validates this strategic positioning, with Q4 2025 revenue reaching $1.901 billion (up 8% year-over-year) and cloud segment revenue growing 25% annually to $213 million. The company achieved a net cash position of $91 million ahead of schedule while expanding non-GAAP gross margins to 26.4%. Enterprise SSDs like the 122.88TB SN670 UltraQLC and the PCIe Gen5 DC SN861 are displacing traditional hard drives in data center architectures, as AI workloads demand the density of HDDs combined with flash speed. The company is also pioneering High Bandwidth Flash (HBF) technology, which could offer petabyte-scale capacity at significantly lower costs than traditional High Bandwidth Memory (HBM), potentially revolutionizing AI inference economics and solidifying SanDisk's role as a critical infrastructure provider for the AI economy.
ExxonMobil Builds an Oil Bridge Between Guyana and IndiaBy Ion Jauregui – Analyst at ActivTrades
Global oil trade turns again in an unexpected move: two supertankers loaded with ExxonMobil crude from Guyana are sailing toward India, covering more than 14,600 kilometers from the Caribbean to Asia. This historic route reflects not only India’s need to diversify its supply following the decline of Russian crude, but also Guyana’s growing influence as an emerging producer. A cultural curiosity adds a unique nuance: almost 40% of Guyana’s population is of Indian origin, a link that has facilitated diplomatic and commercial approaches.
The vessels Cobalt Nova and Olympic Lion, loaded with the Liza, Unity Gold, and Golden Arrowhead grades, represent millions of barrels that will soon feed refineries in Paradip, Mumbai, and Visakhapatnam. For India, it is an opportunity to secure a stable supply; for ExxonMobil, this voyage is not a simple transport: it is a strategic consolidation combining low production costs, solid cash flow, and presence in an emerging market with enormous energy demand.
Fundamental Analysis
ExxonMobil reinforces its position in a global context of volatility. Guyana’s production has grown from 0 to more than 800,000 barrels per day in just six years, becoming a strategic asset. The company protects its margins against Brent and WTI uncertainty while diversifying clients and securing long-term contracts in Asia, in one of the world’s most demanding oil markets. The combination of operational efficiency, investments in energy transition, and expansion of its oil portfolio allows it to maintain profitability and consolidate investor confidence, even in a complex geopolitical environment.
From a fundamental perspective, the operation strengthens ExxonMobil’s position against crude volatility and geopolitical pressure. Diversification toward India protects margins, improves cash flow, and strengthens the company’s presence in emerging markets, while its focus on operational efficiency and energy transition projects reinforces the perception of solidity among investors.
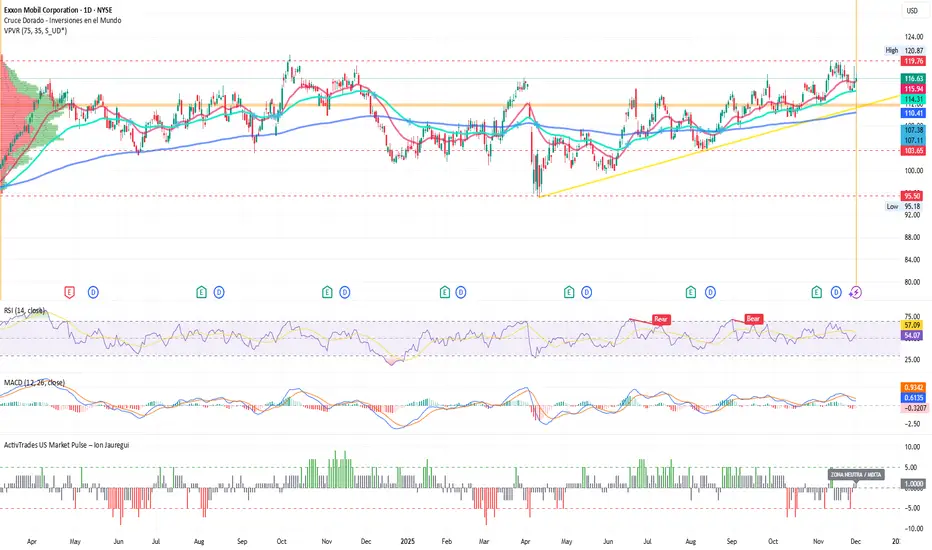
Technical Analysis – ExxonMobil (Ticker AT: XOM)
The stock has shown an upward trend since April with rising highs, supported by mid-level support around $104, with resistance at October last year’s highs, which was practically replicated this year in mid-November during the price breakout attempt. Currently, moving average crossovers sustain the bullish momentum, and a new attempt to advance the bullish trend could be seen. The RSI is currently in the mid zone at 54.07%, and the MACD is in a retracement period following a corrective fortnight that seems to have ended this week. The current price of $116.63 rests on the 50-day moving average, suggesting that buyer momentum remains present, although with some pause, as if the market awaits the next milestones in Guyana and global energy policy to define the next acceleration.
The ExxonMobil stock maintains an upward trend with rising lows and highs.
Key supports: $112.40 in Point of Control (POC) zone
Immediate resistance: $120.87, coinciding with recent highs
Indicators: RSI neutral, MACD showing corrective trend with mixed signals
A breakout above the highs could open the way to $124–$126, while a drop below $112 could generate corrections down to $108–$103.
Not Just Oil
ExxonMobil is not just transporting oil; it is building an economic and geopolitical bridge between Guyana and India. The operation demonstrates its ability to turn geopolitics into solid business and reflects how its stock combines technical potential and fundamental strength, a combination that attracts investors seeking stability in an uncertain energy market.
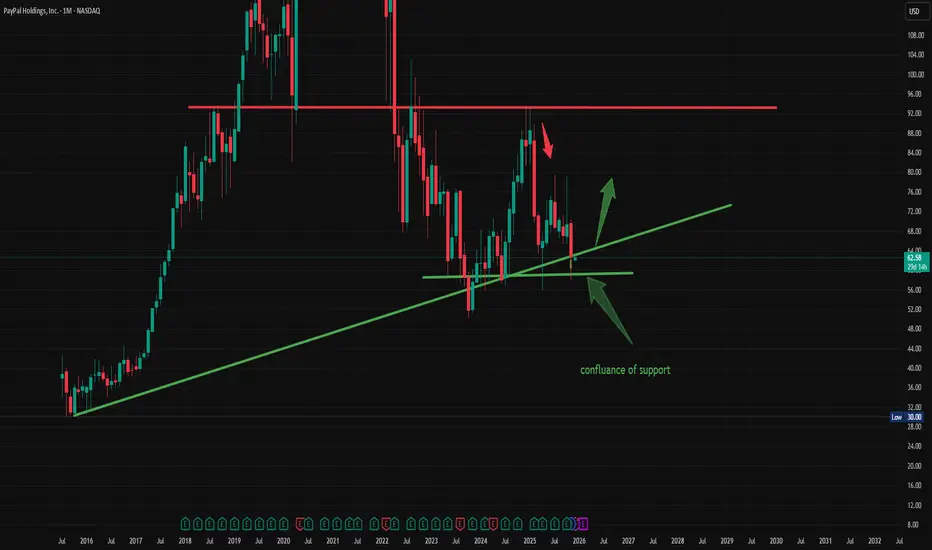
pypyl ready for take offwe have been ranging for 3 years now and every time we test green support we see a bounce off the trend line.from the old high we came down 35% and now all we need is conformation on the smaller time <but i believe the bottom is in .we also have a confluence of support that give us a high probability that we will see a reversal.
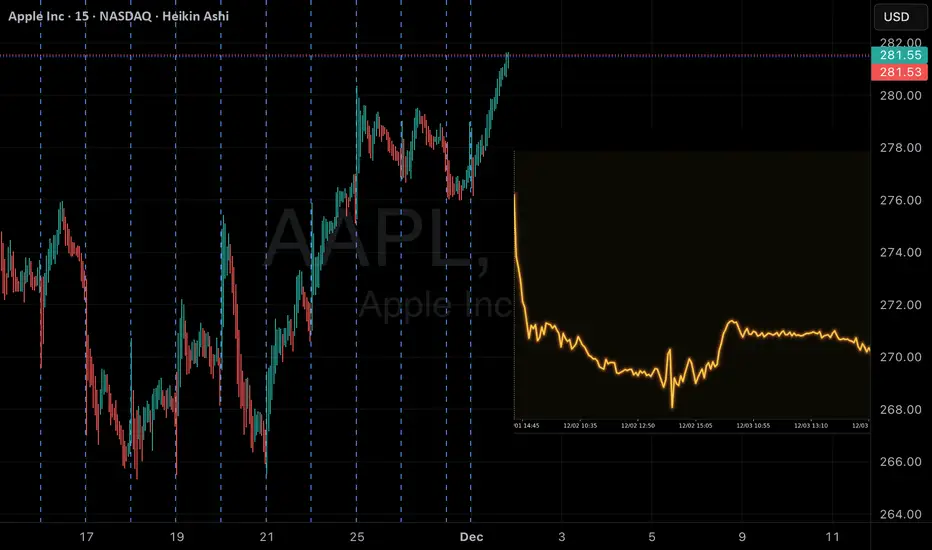
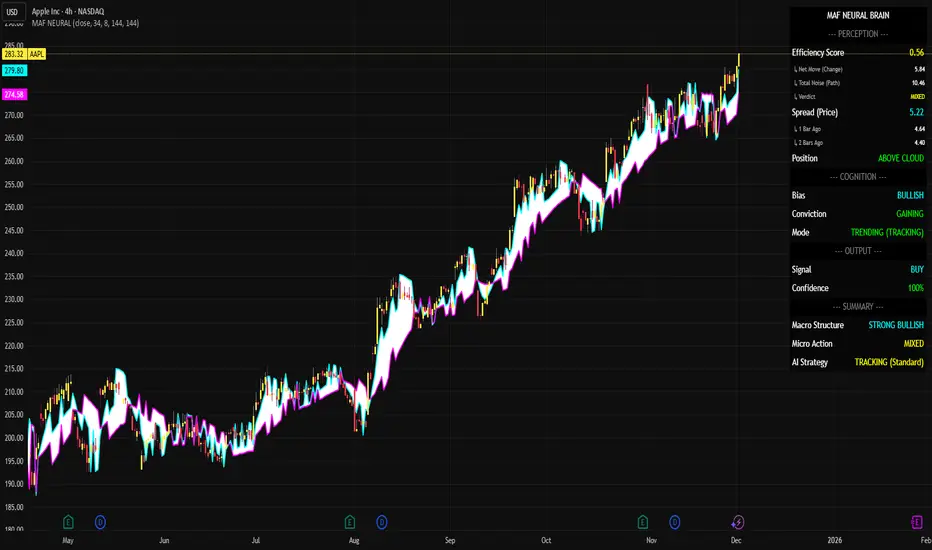
AAPL Listen to the "BRAIN"1. The "Breathing" Cloud (Changing Thickness)
The changing thickness of the White Cloud is the most important visual cue. Think of it as the "Lungs" of the Trend.
Expansion (Thickening Cloud):
What it means: The "Fast Core" (Cyan) is pulling away from the "Slow Core" (Magenta).
Analysis: This indicates Momentum Acceleration. The market is moving faster than its baseline. This is a "High Confidence" phase where you want to be aggressively holding or adding to positions.
On Chart: You can see massive expansions during the rallies (May, June, Oct). The cloud gets huge, signaling a "Power Trend".
Contraction (Thinning Cloud):
What it means: The cores are converging (pinching together).
Analysis: This indicates Momentum Deceleration or Consolidation. The market is "exhaling" or taking a rest.
On Chart: Notice how the cloud gets very thin before the trend either reverses or explodes again. A thin cloud is a "Decision Point".
2. Dashboard Analysis (The "Brain")
The Dashboard confirms what the Cloud is showing visually:
Spread (Price): 5.77: This is a Wide Spread.
Verdict: The trend is currently Expanded. It is not in a "compression" phase; it is in a "run" phase.
Efficiency Score: 0.56 (MIXED):
Verdict: While the trend is up, the price action isn't a straight line. It's a bit "choppy" or "grinding" (Mixed). It's not a "Clean Trend" (0.8+), but it's not "Noise" (<0.3) either.
AI Strategy: TRACKING (Standard):
Verdict: Because the trend is Strong (Wide Spread) but the action is Mixed, the AI decides the best course of action is simply to Track it. Don't get shaken out by the wiggles, but don't be too aggressive. Just trail your stop.
Summary
Current Status: STRONG BULLISH TREND. Action: HOLD. The Cloud is thick (High Momentum), and the Dashboard is signaling "Strong Bullish". Even though the Efficiency is "Mixed" (some minor chop), the sheer width of the cloud protects you from getting stopped out prematurely. Ride the expansion.
$TXN — Watching a clean continuation setupNASDAQ:TXN — Watching a clean continuation setup
Price reclaimed the $165.9 level and is holding strength above VWAP structure. The current pullback looks corrective, not distributive. If buyers defend the mid-zone again, the path toward $180.7 remains open.
Clear liquidity pocket above → bullish expansion remains the higher-probability scenario.
#TXN #stocks #WaverVanir #VolanX

XPEV Failed breakoutReasoning:
Weak Industry/Sector
Late stage failed breakout
Other automotive stocks are crashed NASDAQ:LI OTC:XIACY
Long-Term Investors (3-12 Month Holds)
Entry: Full position on breakout
Profit Taking: Sell 1/4 to 1/5 at Goal 1
Exit Signal: Close below 20-day EMA (your trend guide) or 50EMA
Why: Strong moves are hard to time at the top, but the 20EMA acts as a reliable trend filter
Note:
Remember: Every long-term investment alert can also be played as a swing trade.

$RDDT Long Setup - $280 Target During Q1 2026Reddit is one of those gifts that keep on giving since the IPO. Right now, support seems strong and it doesn't seem to be going away, at least from some current indicators. As always, none of this is investment or financial advice. Please do your own due diligence and research.


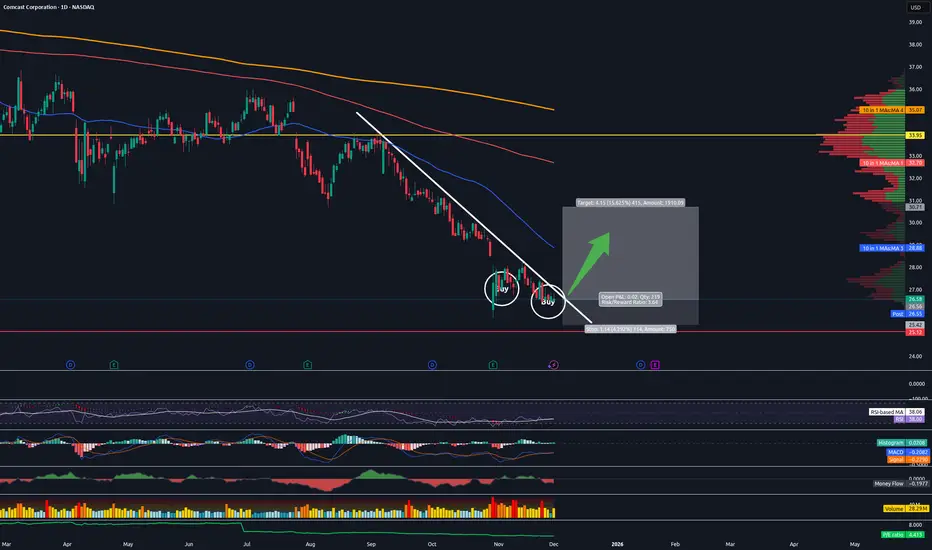
Long Comcast CMCSATrading Fam,
Not getting many long signals from my indicator these days. When I do, I pay attention. In this case, I've received two long signals on the same stock. Though, I am currently only short (and in the profit on both: TSLA and PLTR), I've decided to enter here long on Comcast. My indicator rarely fails me when it signals on these high MC/high vol. stocks. So, I will listen.
On the technical side, I am seeing a nice trendline, which, if my indicator is correct, we will break to the upside on soon. Should at least fill that recent gap down and hit the 50 SMA fairly quickly. It may be worth taking some profit at that point and raising stops to break even. I expect we'll hit our heads on that 50 SMA and draw back for a day or two at least while we wrestle around with it for a little. And then, should we break to the upside, we'll move quick. My final target may even be set too low at this point. I am trading cautiously. But we could tag the underside of that 200 SMA in red before buying subsides to some degree. I'll probably leave a little on the table for this scenario while trailing my stops up as I grab profit.
Conservative target is around $30 with a SL at around $25.50 for a 2:1 rrr. Setting a final target of that 200 SMA would increase your rrr to 5:1 with a potential profit of 23%.
✌️Stew
LEG. I believe LEG has huge long potential from here.LEG is one of the first stocks I shared on my Trading View account. I bought and sold for a minor loss as we started to dip. But looking back, I can see why I thought it would have huge potential for a long term hold. It just looks like it will go back up. Huge levels to test to the upside. It is bouncing over yearly levels and projections which is what I like to see.
I always get messages from mods to explain my trades. I often cant. It comes from almost 10 years of looking at charts. I know trend, levels and my proprietary fib pulls. My record shows for itself. I don't believe anyone should ever copy trade me. All my trades are long term holds and heat is expected in the near term.
Leg is looking really good in my opinion for a huge pump to the upside.

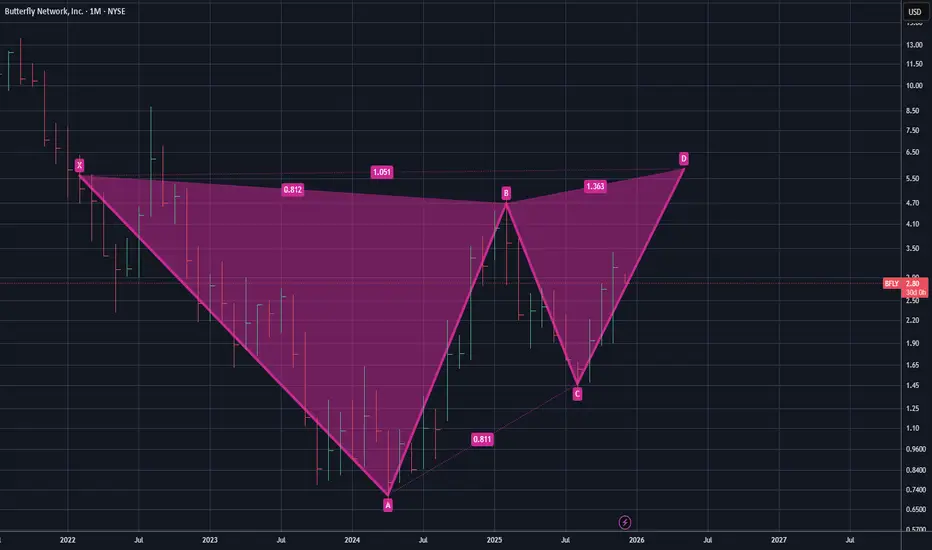
$5+ Target for Butterfly NetworksButterfly Networks is one of those stocks that short sellers like to get their hands on, as with many microcap stocks as well. That said, the product seems well developed, they have a large IP portfolio and could potentially be due for a new support line soon. I think $5 before Q2 2026 could be feasible. As always, none of this is investment or financial advice. Please do your own due diligence and research.
All Red - $NNOX Long - But Nanox's Biggest Issue Right NowThe problem with Nanox, which is also likely why they recently had a stock sale, is likely the need of cash for further distribution. They are in the red and still have long ways to go. That said, when the market dips, Nanox seriously dips. Beyond just the recent France deal, a catalyst is needed to further push Nanox further. That said, I believe we could be long overdue for a bull run. As always, none of this is investment or financial advice. Please do your own due diligence and research.

TSLA Gamma Structure and Key Reaction ZoneTesla (TSLA) stock has roughly $100 million of positive gamma exposure at the $450 strike, meaning a large concentration of call options is forcing dealers to buy shares as price moves upward toward that level, potentially creating a feedback loop that accelerates upside momentum. This “gamma wall” can act as a short-term magnet where price is drawn higher as hedging intensifies, but the effect is typically strongest only as long as spot price approaches or trades into that strike before options expiration.

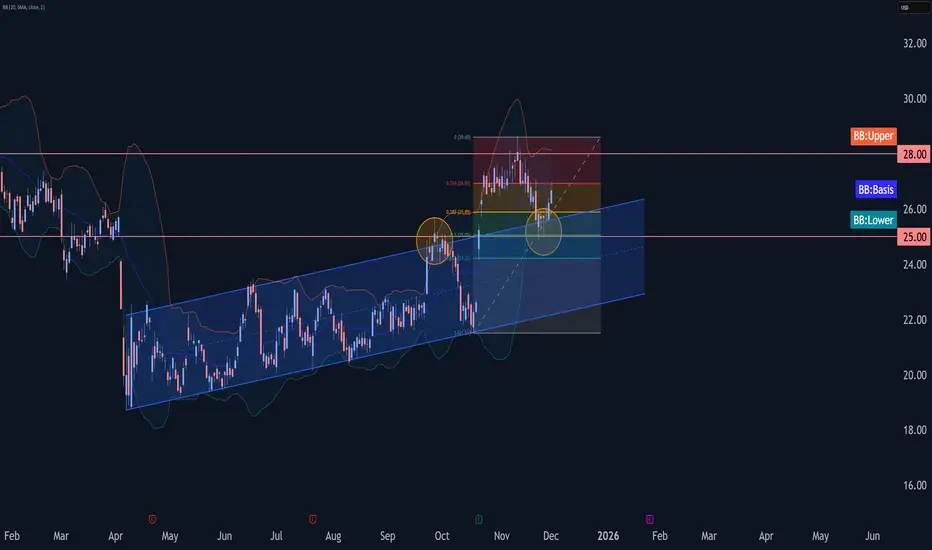
HalliburtHalliburton Wave Analon Wave Analysis – 1 December 2025
- Halliburton reversed from support zone
- Likely to rise to resistance level 28.00
Halliburton recently reversed from the support zone between the support level 25.00 (former resistance from September), lower daily Bollinger Band and the 50% Fibonacci correction of the upward impulse from October.
The upward reversal from this support zone started the active short-term impulse wave 5.
Given the clear daily uptrend, Halliburton can be expected to rise to the next resistance level 28.00 (which stopped the previous wave b).
TSM Swing Alert: Bearish Puts Amid Broad Market StrengthTSM Swing Trade | 2025-12-01
Direction: BUY PUTS (Contrarian to LLM’s BUY CALLS)
Confidence: 60% | Conviction: Medium
Horizon: 18 days (Expiry: 2025-12-19)
Strike Focus: $280.00
Entry Range: $8.75 – $9.25 (Mid: $9.00)
Targets:
Target 1: $13.50 (+45% gain)
Target 2: $17.25 (+85% gain)
Stop Loss: $6.25 (≈30% loss)
Swing Range: $283.19 – $292.38
Volume vs Prior Swing: 0.6×
1W Move: +0.93% | 2W Move: -0.96%
Risk Level: Moderate – Contrarian trade against bullish market; tight risk management advised
Options Flow: Extremely bearish, Put/Call Ratio 2.15, max volume at $260 put
Katy AI Conflict: LLM recommends BUY CALLS, but Katy predicts PUTS (-1.78% move, 50% confidence). Proceed with caution.
Trade Edge: Strong bearish options flow confirmation, contrarian opportunity against broad bullish market sentiment.
Notes: Monitor Taiwan-US trade negotiations and sector news; consider scaling in due to medium conviction.

CRDO Earnings Swing: High-Conviction Call Play Amid Pre-EarningsCRDO QuantSignals V3 Earnings | 2025-12-01
Trade Type: BUY CALLS
Confidence: 65% (Medium conviction)
Expiry: 2025-12-05 (4 days)
Strike: $175.00
Entry Range: $12.40 – $13.90 (mid: $13.15)
Target 1: $19.80 (+50%)
Target 2: $26.70 (+100%)
Stop Loss: $9.25 (-30%)
24h Move: +16.48% (pre-earnings run-up)
Flow Intel: Neutral
Earnings Estimate: $0.50
Analysis Summary:
Katy AI predicts bearish movement (-17.92%) but composite bullish score (+5.3) favors calls.
Technicals: Overbought stochastics (89.4), resistance at $183.69, support $170.
News/Sector: Strong semiconductor momentum, 240% revenue growth, 100% historical beat rate.
Options Flow: Neutral, implied volatility high (174%), balanced delta 0.4–0.6.
Risk Level: HIGH – due to AI conflict, overbought technicals, and extreme IV.
Positioning Notes:
Use smaller position size due to risk/conflict.
Monitor for IV crush post-earnings.
Tight stop loss recommended.
Quick Trade Setup:
Instrument: CRDO
Direction: CALL (LONG)
Strike: 175.00
Entry Price: 13.15
Target: 19.80 / 26.70
Stop Loss: 9.25
Expiry: 2025-12-05
Position Size: 2% portfolio

SOFI with a huge cup and handleNASDAQ:SOFI with a huge cup and handle that can send her 86% up it will break the resistence

Goldman Sachs (NYSE: $GS) : $2B Innovator Deal Boosts ETF PowerGoldman Sachs (NYSE: NYSE:GS ) is taking a major leap in the fast-growing ETF market with its $2 billion acquisition of Innovator Capital Management. The deal brings in a powerful lineup of 161 U.S.-listed ETFs managing nearly $30 billion in assets, instantly strengthening Goldman’s position in defined outcome products—one of the hottest ETF segments today. Innovator is widely recognized for pioneering “buffer” ETFs, which use options to offer downside protection in exchange for capped upside. These strategies have surged in popularity as investors seek structured, rules-based approaches to managing risk.
Innovator’s products carry a median expense ratio of 0.79%, translating to roughly $237 million in annual revenue at current AUM levels. Beyond U.S. equities, its strategies span various indexes and asset classes, giving Goldman broader reach and deeper ETF diversification. Before the acquisition, Goldman ranked 18th among U.S. ETF issuers with $51.4 billion in assets. Combined with Innovator, it climbs to 16th place—leapfrogging Global X and Direxion. Still, joining the top 10 will require significantly more scale.
CEO David Solomon highlighted the accelerating growth of active ETFs, noting their role in reshaping public markets. Although defined outcome ETFs are technically active, they operate as disciplined, systematic strategies, making them attractive to investors seeking predictable payoff structures.
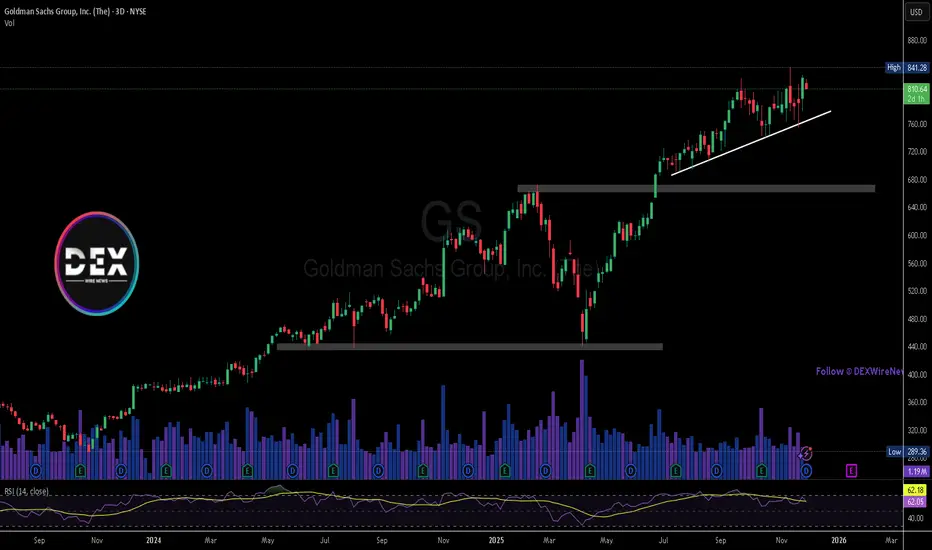
Technical analysis
Goldman Sachs stock remains firmly bullish. Price action continues to respect an ascending trendline established after breaking a key resistance level. The next major resistance sits near $841, the previous high. As long as the trendline holds, GS maintains strong upside momentum, with the trendline itself acting as dynamic support.
$WYFIFundamental Analysis: Explosive Growth Tempered by Widening Losses
WhiteFiber is positioning itself decisively within the high-demand AI and HPC infrastructure arena. The company's operational momentum is underscored by several key catalysts:
Transformative Revenue Run Rate: The upcoming full-quarter operation of its Montreal data center, projected to generate a $1 million monthly revenue run rate, represents a pivotal step toward scaling and financial inflection.
Forward-Looking Expansion: The development of its NC-1 data center in North Carolina, slated for Q1 2026, demonstrates a clear growth roadmap. Notably, the reported strong interest from potential counterparties suggests robust underlying demand for its planned capacity.
Strong Underlying Metrics: The Q3 revenue of $20 million (up ~65% YoY) paired with a healthy gross margin of 63% confirms the company's core business model is viable and operating in a high-value segment.
However, this growth narrative is currently shadowed by mounting operational expenses. The widening operating loss of $14.5 million, driven by booming general and administrative costs, highlights the "cash burn" phase typical of rapidly scaling infrastructure companies. This creates a binary investment profile: success depends on revenue scaling fast enough to overtake these expenditures before capital constraints arise.
Wall Street's sentiment leans strongly toward the growth story. With 8 out of 10 analysts rating WYFI a Buy (including two new Outperform ratings in the past month) and a consensus pointing to an average upside potential of 108%, the institutional outlook is decidedly optimistic, albeit acknowledging the inherent risk.
Technical Analysis: A Structured Roadmap with Key Levels
The stock's price action provides a clear technical map to navigate this fundamental volatility.
Critical Support Hierarchy:
Support 1: $15.00 – This is the primary defensive level for the bullish thesis. A sustained hold above this zone is crucial for maintaining near-term upward momentum.
Support 2: $10.00 – A breach of $15.00 would likely trigger a move toward this more substantial secondary support. This level represents a major psychological and technical floor where long-term buyers may re-enter.
Support 3: $8.00 – This is the ultimate support and a critical "line in the sand." A breakdown below this level would severely damage the technical structure and likely force a fundamental reassessment.
Bullish Trigger and Target:
The immediate resistance and momentum trigger sits at $25.00. A decisive break and sustained close above this $25.00 threshold is the technical confirmation needed to initiate the next major leg higher.
Upon a confirmed breakout above $25.00, the primary upside price target is projected at $30.00. This objective is derived from measuring the potential of the current consolidation pattern and aligns with the initial phases of the substantial upside implied by analyst projections.
Synthesis and Strategic Outlook
WhiteFiber embodies a classic growth-stage investment: tremendous potential fueled by crucial industry tailwinds, but a path fraught with execution risk and current profitability challenges. The convergence of a clear expansion narrative (Montreal, NC-1) and a strong bullish analyst consensus creates a compelling fundamental backdrop.
This backdrop is framed by a technical structure offering precise navigation points. The trade thesis is essentially this: maintain a bullish bias so long as price holds above the key $15.00 / $10.00 support zone. Investors should watch for a break above $25.00 as the signal for a likely acceleration toward the initial $30.00 target, which would serve as the first significant validation of both the growth story and the technical pattern. A failure to hold critical support, however, would signal a prolonged period of consolidation or correction is needed.

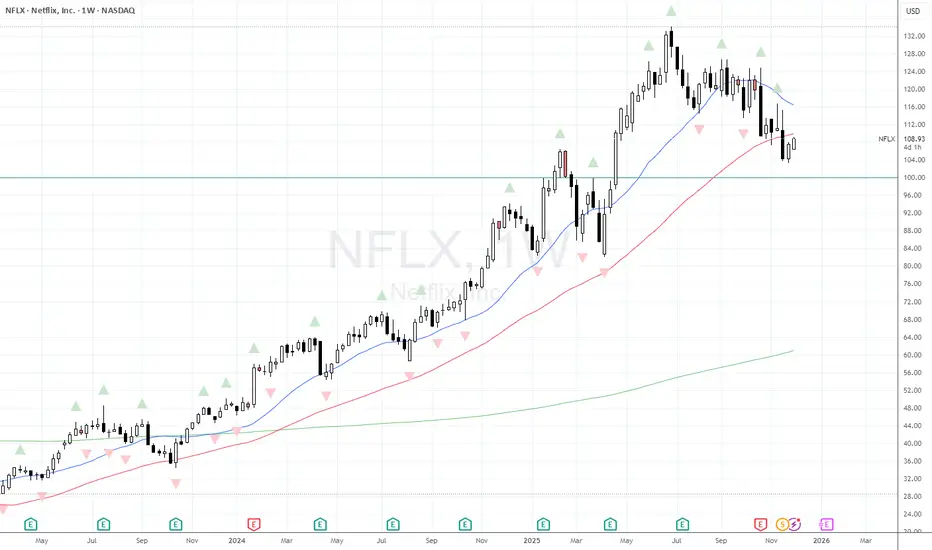
Next move for $NFLX down to $100?#NFLX had a great run until the summer of 2025 but has struggled since then. I'm sure there's many reasons for that - the concerns about the Warner Bros acquisition will undoubtedly be one of them. However from a technical standpoint the price has continued to make lower lows as it retreated from $132.
We know find ourself closing last week beneath the Weekly 50MA, which it hasn't done for approx 2 years. Is this an area for a bounce? There's been lots of positive news about the release of the final series of Stranger Things (I haven't watched it - but then I don't need to as I have a 14 year old niece who loves it, and insists on giving the family a complete run down of the show!)
Personally I would want to see price rally back into the area of the 20 & 50 Weekly MA's before rolling over and then moving lower to $100 - which could be a stronger level of support, and a real inflection point where price looks to make a decision.
AAPL Weekly Put Play – High-Probability Reversal Setup AAPL Weekly Signal | 2025-12-01
Instrument: AAPL
Signal Type: Weekly Swing
Direction: BUY PUTS (SHORT)
Confidence: 58%
Conviction Level: Speculative
Expiry: 2025-12-05 (4 days)
Recommended Strike: $280.00
Entry Price: $1.24 (midpoint)
Profit Target 1: $2.48 (100% gain)
Profit Target 2: $3.72 (200% gain)
Stop Loss: $0.62 (50% loss)
Position Size: 2% of portfolio (speculative due to low conviction)
Weekly Momentum: NEUTRAL (+0.82%)
Options Flow: Bearish (High Put/Call Ratio, 1.78)
Risk Level: HIGH – low confidence, short expiry, high theta decay, overbought RSI
Analysis Summary:
Katy AI Prediction: Downward trend from $281.12 → $278.32 (-1.05%), with 78% of predictions below current price. Average target $277.71 (-1.21%).
Technical: Extremely overbought (RSI 83.8), VWAP support $277.96, near weekly high (96% range).
News/Market Context: Neutral to slightly negative; Silver squeeze and rising yields create pressure.
Options Flow: Institutional puts heavily bought; maximum volume at $228 put.
Key Notes:
Weekly directional guidance suggested BUY CALLS, but Katy AI shows strong bearish trajectory.
Extreme caution due to low AI confidence (50%) and short expiry.
Consider partial profits at Target 1 to mitigate theta decay.
Stop loss at 50% to limit downside.