RBLX - Game Over ?I see two possibilities if we see a bounce - Good short entries.
If it doesn't bounce and keeps sliding, not so good R:R but can trailing stop the trade closely.

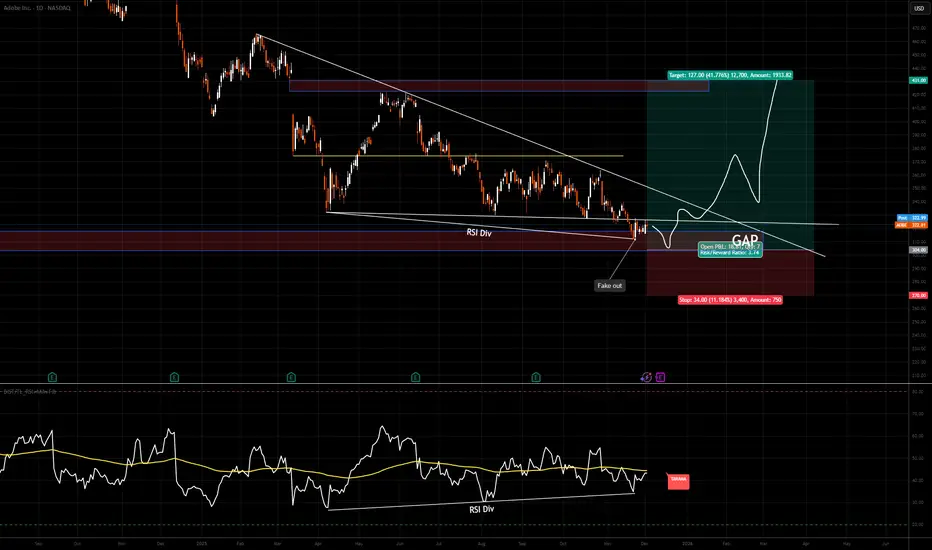
ADBE Fake Out Fill the Gap Descending Wedge PatternI want to start buy from here.
When AI trend end, ADBE will be one of the first stocks that rise.
I'll wait till fill the GAP.
If I'll see "Day Close" above bottom line of the "Descending Wedge Pattern", I'll buy again
My first targe will be GAP at top but I'm expecting more than that.
$GUTS (NASDAQ) — Weekly Reversal in ProgressAfter several months of consolidation followed by a sharp summer sell-off, GUTS is finally showing strong signs of recovery.
Last week’s candle closed decisively above the $1.60 – $1.70 supply zone, triggering a potential trend-reversal structure.
📌 Swing Trade Plan
📍 Entry: $1.85 – $1.90
🛑 Stop-loss: $1.58 (below the last bullish weekly candle)
🎯 Take-profit: $2.35 – $2.40
📊 Risk/Reward: ~1:2 ✔️
🔍 Technical Rationale
✔️ Strong breakout above resistance
✔️ Clear higher highs & higher lows structure forming
✔️ Positive reaction after earnings — bad news likely priced in
✔️ Rising volume confirming momentum and demand
⚠️ Invalidation Level
📌 A weekly close below $1.70 kills the bullish momentum and cancels the setup.
📢 Scenario Management
🔺 Plan will be updated in case of a breakout above $2.00
🔻 Or loss of $1.70, which would signal structural weakness
💬 This is just my personal market outlook — not financial advice.
If you enjoy this kind of analysis, drop a 👍 and follow for more weekly setups!
#Stocks #NASDAQ #SwingTrade #TechnicalAnalysis #PriceAction #Investing #StockMarket #ChartAnalysis #BreakoutTrading #MomentumTrading #ReversalPattern #VolumeAnalysis #MarketSetups #TradeIdeas

Scotiabank (TSX: $BNS) Earnings Beat Fuels Bullish MomentScotiabank (TSX: NYSE:BNS ) delivered a stronger-than-expected fourth quarter, posting $2.21 billion in profit despite a significant $373 million restructuring charge tied to layoffs. Profit rose from $1.69B a year earlier, driven by improved performance in wealth management, capital markets, and international banking. Adjusted earnings hit $1.93 per share, beating analyst estimates of $1.84.
CEO Scott Thomson emphasized that 2025 was a year of disciplined execution, noting that the bank delivered on its strategic priorities despite trade uncertainty, unemployment pressures, and a sluggish housing market. The restructuring — which involved more than 2,200 job cuts — is part of Scotia’s multi-year plan to simplify operations, reduce costs, and redirect investment toward technology and higher-value client segments.
The bank aims to reach a 14% return on equity, potentially earlier than planned. Executives highlighted improving profitability across international banking, global markets, and wealth management, with Canadian banking expected to follow next year through rising fees, mortgage refinancing at higher rates, and deposit growth. Provisions for credit losses rose to $1.11B, but management expects them to trend lower later in 2026. Analysts said margin expansion and capital-markets strength were the main drivers of the earnings beat.
Scotiabank also expects to benefit from Canada’s renewed focus on energy and mining development, including federal-provincial cooperation on major energy projects — a backdrop that could support double-digit EPS growth next year.
Technicals
NYSE:BNS is trending bullish after breaking above the key $55 resistance, confirming renewed buyer strength. The breakout opens a clear path toward the next major resistance at $74. Momentum remains positive, and any pullback toward $55 would act as a strong support zone for dip-buyers. As long as price holds above this level, the bullish structure remains intact.

QuantSignals V3 AEO Momentum Play – Buy the Dip, Ride the Rally!AEO QuantSignals V3 – Earnings Trade Alert (2025-12-02)
Trade Direction: BUY CALLS (Bullish)
Confidence: 58–65% | Conviction: Medium
Recommended Strike: $21.00–$21.50
Entry Range: $1.20–$1.42
Target 1: $2.10–$2.40 | Target 2: $2.84–$3.60
Stop Loss: $0.90–$1.05
Expiry: 2025-12-05 (3 days)
Position Size: 2–3% of portfolio (use small due to risk)
⚠️ Risk & Conflict Notes
Katy AI shows neutral/bearish bias (-1.2% to -2.19% predicted moves, 50% confidence), conflicting with LLM BUY CALL recommendation.
High implied volatility (IV 189–200%) → rapid price swings, overbought RSI (85.7) → pullback risk.
Trade post-earnings; use caution with position sizing.
High Risk Warning: Only small position recommended due to Katy conflict and high uncertainty.
💡 Trade Insight
Exceptional fundamental strength: 1337% revenue growth, perfect earnings beat history (100% success, +38.7% avg surprise).
Strong pre-earnings institutional flow (2.1x volume) supports bullish positioning.
Trade structure anticipates Katy’s predicted dip for better entry while riding strong fundamentals.
Tight stop loss and balanced delta mitigate downside risk.

Quant signals V3 Bearish Opportunity: MRVL Post-Earnings MRVL QuantSignals V3 – Earnings Trade Alert (2025-12-02)
Trade Direction: BUY PUTS (Bearish)
Confidence: 60% | Conviction: Medium
Recommended Strike: $87.00
Entry Range: $2.92
Target 1: $5.70 | Target 2: $8.55
Stop Loss: $1.43
Expiry: 2025-12-05 (3 days)
Position Size: 2% of portfolio (moderate conviction)
⚠️ Risk & Conflict Notes
Katy AI shows post-earnings bearish momentum from $92.72 → ~$86-88, despite composite guidance suggesting BUY CALLS.
High implied volatility (IV 169.7%) → rapid time decay; monitor closely.
Light volume & overbought stochastics (86.9) → market conviction weak, pullback likely.
Options flow: Extremely bearish, PCR 4.28, indicating heavy institutional put buying.
Moderate Risk Warning: Consider scaling in rather than full position due to medium confidence.
💡 Trade Insight
Combines Katy AI bearish timing with extreme options flow for an asymmetric opportunity.
Post-earnings, price movement is more predictable, reducing event risk.
Tight stop loss mitigates risk from IV crush.

Cloudflare (NYSE: $NET) Pops After Bullish Barclays CallCloudflare (NYSE: NYSE:NET ) jumped in premarket trading after Barclays initiated coverage with an Overweight rating and a $235 price target. Shares rose roughly 3% as analysts led by Saket Kalia outlined a strong multi-year growth roadmap supported by Cloudflare’s expanding product ecosystem and accelerating market share gains.
Barclays highlighted Cloudflare’s unique homogeneous global network, which currently supports nearly 20% of the internet. Because the entire network can run any Cloudflare service at any time, the company is able to scale new offerings quickly and capitalize on secular trends such as cybersecurity expansion, AI inference, cloud adoption, and emerging “no-click” search.
Cloudflare organizes its business into four product suites, or “Acts.” According to Barclays, Act 1 delivered about 85% of FY24 revenue, while Acts 2 and 3 contributed the remaining 15%. However, Acts 2 and 3 are growing materially faster and tapping into large, rapidly expanding markets where Cloudflare continues to take share. Analysts believe this evolving mix will strengthen revenue durability as the company moves deeper into security, AI, and developer tooling.
Barclays expects 27%–30% annual growth through FY28, driven by continued share gains and broader adoption of Cloudflare’s enterprise contracts. While valuation is elevated relative to peers, analysts argue that sustained 30% growth rates are rare in large-cap software — and historically, markets have rewarded companies able to maintain this trajectory. Cloudflare’s focus remains on the Rule of 40, balancing high growth with improving profitability over time.
Technicals
NET remains in a strong bullish structure. After hitting the $260 resistance, price retraced toward the $180 support zone, where buyers quickly stepped in. The rejection at support confirms bullish momentum, with upside targets now pointing back toward $260. As long as price holds above $180, bulls remain firmly in control.

600% in 6 month only because of one Patent(svandiniumAluminium)600% in 6 month only because of one Patent(svandinium Aluminium alloys)

QDMICriterion Rating / Comment
ROIC > 10% ✅ Yes — ROIC ~ 59.8%
StockAnalysis
ROE > 15% ✅ Yes — ROE ~ 87.9%
StockAnalysis
FCF yield > 6-8% ❓ No public, stable data on free cash flow, and there are quarters with losses
StockAnalysis
+1
Debt/EBITDA < 3 ✅ Yes — almost no debt to EBITDA
StockAnalysis
Growth of FCF + EPS + Revenue ⚠️ Results are rising sharply — there is growth, but also high volatility
TradingView
+2
stocktitan.net
+2
Moat / competitive advantage ❌ No — brokerage/intermediary model, no sustainable moat
Good management 🔶 Unclear — there is insider buying, but governance & dependency risk are high
Investing.com
+2
Simply Wall St
+2
You are buying below fair value (margin of safety) ❓ Too speculative — valuation metrics (EV/EBITDA, EV/Sales) are very high in previous good periods; even in a good year it is risky

AMZN long-term TAAmazon is consolidating, the indicators do not support recent short-term runs which resulted in pullbacks but the trend is neither bearish, more neutral-bullish and also it supports SMA50 along the way, yes there were news about new AI chip from Amazon to rival Nvidia and so on and it has a chance to rally yet following the AI hype trend ride, but the volumes didn't react that much either, we just have to give it a little bit more time to finish the consolidation and project the approximate outcome.


$BB Squeeze Incoming?✔️ What I see:
- Declining resistance is being tested right now.
- Falling wedge pattern forming since early November — bullish structure.
- Price is sitting ABOVE the lower green channel → strength.
- Recent candles show higher lows, even during weak volume → buyers present.
- 1H RSI = ~56 → neutral but leaning bullish.
- Squeeze histogram is turning green → momentum is shifting.
⭐ Interpretation:
- BB is attempting to break out of the 1H wedge.
- If it clears $4.13–4.15, it confirms.
✔️ Massive daily falling wedge
- Lower green support
- Upper orange downtrend
- This wedge started mid-September → long consolidation → now tightening.
- This is the exact pattern where stocks pop 10–25% IF volume enters.
✔️ Weekly RSI = 51
- Neutral and rising → bullish tilt.
✔️ Weekly trendline (your blue line) is flattening
-Flattening = trend exhaustion.
-This often precedes a reversal.
✔️ Weekly volume is LOW
-Low volume during a downtrend = sellers are done.
-This is typically where whales begin loading quietly.
🔥 Price Targets if BB Breaks Out:
4.15 → breakout trigger
4.33 → fib + supply zone
4.48–4.55 → big target
4.72
5.00

DG $107 Call 12/12I identified a double bottom pattern, drew my target then waited for confirmation to enter a call option.
The target was met and continued towards the upside.

RGTI - Ideally entry on a major Quantum name for the long run! We just saw a weekly textbook ABC correction into symmetry and the 618 of the entire swing. This is a great long-term entry area with a stop below the low.
Follow us for more A+ setups!

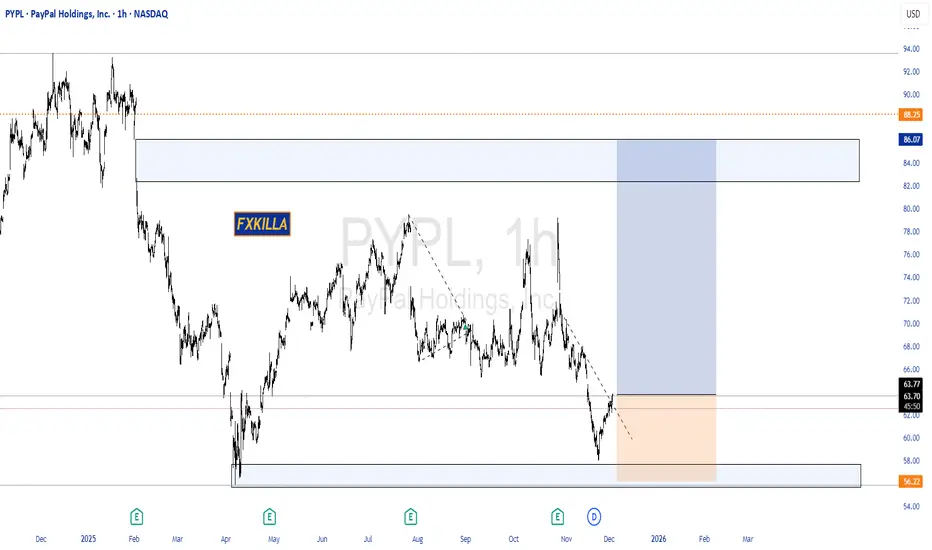
PAYPAL HIGH PROBABILITY LONG SETUP SOON!!!🚨 PAYPAL HIGH PROBABILITY BUY SETUP 🚨
* Here We Can See Clearly The Next Potential Moves For PYPL Coming Hours/Days.
* Keep Your Eyes Close On Your Trading Positions.
* Happy PIP Hunting Traders.
FXKILLA.
$ADBE — WEEK 49 TREND REPORT NASDAQ:ADBE — WEEK 49 TREND REPORT
Ticker: NASDAQ:ADBE — 12/02/2025 @ 323$
Timeframe: WEEKLY
This is a reactive structural classification of NASDAQ:ADBE based on the weekly chart as of this timestamp. Price conditions are evaluated as they stand — nothing here is predictive or forward-assumptive.
⸻
1) Current Trend Condition
• Trend Duration: +6 weeks (bearish)
• Trend Reversal Level (Bullish): 337.64$
• Trend Reversal Level (Bullish Confirmation): 365.70$
• Structural Support (38.2%): 424.90$
⸻
2) Structure Health
• Retracement Phase:
Breakdown (establishing price beneath 38.2%)
• Position Status:
Unstable (price below both structural layers)
⸻
3) Temperature
• Cooling Phase
⸻
4) Momentum
• Bearish
⸻
5) Market Sentiment
• Bearish
⸻
Author’s Note
This analysis is fully reactive, not predictive. Market conditions, trend structure, and behavior are classified as they appear in real time. The objective is to identify where directional shifts first occurred, where structural integrity remains intact, and where it would begin to weaken if key levels were breached.
Predictive analysis projects outcomes that do not exist yet. Without price confirmation, prediction is built on baseless assumptions. This framework avoids that entirely by responding only to verified structural changes and live conditions.
The levels shown simply identify where the current trend structure first shifted and where it would begin to lose integrity if breached. Recognizing these boundaries allows for clearer interpretation of market behavior without relying on forward guarantees, speculative projections, or unsupported assumptions.
⸻
Methodology Overview
This classification framework evaluates directional conditions using internal trend-interpretation logic that references price behavior relative to its structural layers. These relationships are used to identify when price movement aligns with the framework’s criteria for directional phases, transition points, or regime shifts. Visual elements or structural labels reflect these internal interpretations, rather than explicit trading signals or preset indicator crossovers. This framework is observational only and does not imply future outcomes.


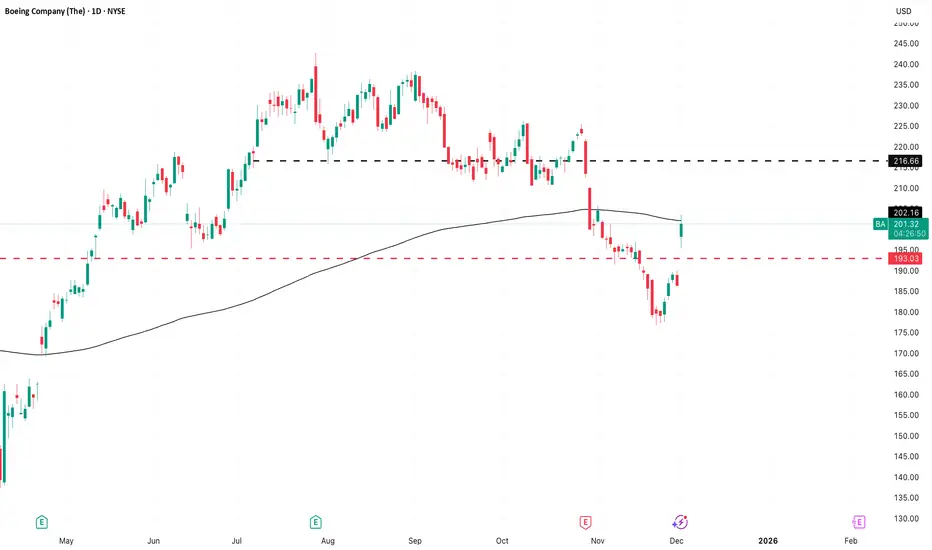
Shorting gap up on Boeing
Boeing is still losing real money. This year alone they posted almost $12 billion in losses, and the truth is simple: this company hasn’t made a profit since 2018. That is seven straight years of destroying shareholder value while pretending everything is “on track.” Their new CFO comes from Lockheed — a serious operator, an experienced man who spent his career inside a winning culture. And now he has to walk into Boeing and deal with the exact opposite: a broken culture, years of bad decisions, and a company that forgot what quality looks like. When a company bleeds billions, loses trust, and keeps promising turnarounds that never come, you stop listening to the optimism and start paying attention to the math. #Boeing isn’t improving — it is surviving. And survival is not a business model:
short #BA 202.86
TSEMFUNDEMENTAL ANALYSIS
TSEM, a foundry business based in Israel. A potential small cap gem which may experience exponential growth over the next few years, largely due to the demand in semiconductor solutions as part of the AI super-cycle. All eyes have been on Nvidia, which continues to receive strong demand for their GPUS, with Blackwell release on the horizon. If Nvidia isn’t done with its run, which I don’t think it is, we could see other semiconductors names continuing their run. I don’t think Nvidia will give you a multi-bagger but a name like TSEM may well do that. Not because of any underlying technology but merely because it is an undervalued company according to financial metrics. Also, TSEM supplies services to the autonomous vehicle, smart device, industry automation sectors. With a focus on manufacturing analog, mixed-signal and RF technologies – this aligns with the requirements of AI-driven innovations (autonomous vehicles in particular).
TECHNICAL ANALYSIS:
-ABC correction from Dotcom Crash over a 14 year period.
-All time low put in during 2009
-Start of an uptrend, 12345 waves pattern
A crash ensued where we saw a Fibonacci retracement to the Golden Pocket (0.618). This coincided with the Weekly RSI being taken out and thus a complete reset.
-Possible start of wave 2, as part of a larger 5 wave move back to the upside. Bullish confirmation will be a break out above $50 with high volume.
CONCLUSION
The ideal entry was missed but there may be some room to go to the upside. If we do indeed see a continued AI driven super cycle over the coming year or two, especially with Blackwell on the horizon, we may see other semiconductor names like TSEM benefiting. Given it’s small cap status, I deem this a worthy company to keep on my radar.

NU Holdings: A High-Growth Fintech LeaderNYSE:NU is the largest digital bank in the world, with over 100 million customers across Brazil, Mexico, and Colombia, and is expanding its base by 10–12 million users per year. Unlike most fintechs, NU is solidly profitable, consistently delivering ~20% net profit margins, supported by exceptional operating efficiency and low customer acquisition costs.
The global neo-banking market is projected to reach $1.5–2 trillion in annual revenue by 2030. Using today’s estimated market revenue of $240 billion, this implies a compound annual growth rate of roughly 49% over the next five years—representing one of the most powerful structural growth stories in global finance.
As a market leader with scale, profitability, and strong brand trust across Latin America, NU is positioned to capture a disproportionate share of that expansion. Technically, NU has also been riding an exceptionally clean upward price channel since April 2025, and at the right entry point, it represents a compelling long-term investment opportunity.

LULU: Strong buyI'm getting very long on LULU, volume profile shows capitulation, buyers are appearing at the bottom of the downtrend

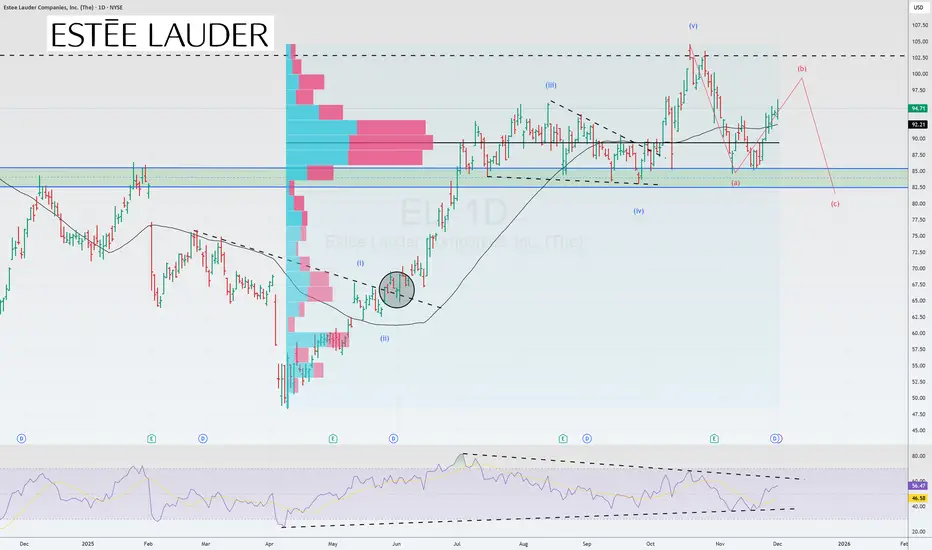
EL🌎 The company is undergoing a major restructuring, delegating profit and loss management responsibilities to regions and achieving significant cost savings, which could lead to a much faster and more significant return to profitability than expected.
Growth will be driven by several key factors: entering new markets through platforms like Amazon and Tmall, supported by AI-powered personalization; active expansion in Latin America and Southeast Asia; and an increased share of direct sales, which increases average order value and customer loyalty. Furthermore, growing demand for premium health and skincare products is fueling the company's broad portfolio of science-based products.
According to an optimistic scenario, revenue could reach $16.8 billion and net profit $1.6 billion by 2028.
In June, the downward trend was broken.
The market believes in the company's strategy, and the $85 level is holding up well for now.
Around $100, the stock needs to be closely monitored.
Until the market sees real changes in the company's performance based on the new strategy, the stock will have a hard time breaking resistance.
Pre-Market Morning Levels & Setups: META • SPY • ZS • AMZN •NVDAQuick morning breakdown covering META, SPY, ZS, AMZN, and NVDA.
Touched on futures structure, overnight sentiment, key levels, and what I’m watching into the open.
Straightforward setups and the zones that matter.
