IRBT big move incomingiRobot had it's largest volume in history 1 day ago! I think there will be a big move coming. My bet is that it will drop a lot, maybe even below 1$ and then pump.

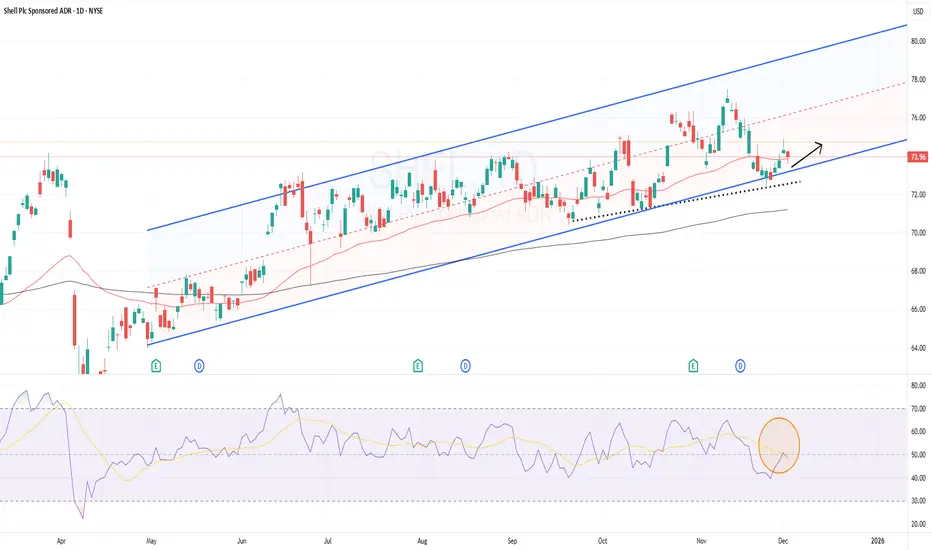
$SHEL offers a good entry point
I’m watching Shell closely — its Q3 2025 results showed strong cash flow: adjusted earnings of $5.4 billion and operating cash flow over $12 billion.
Meanwhile, the company just kicked off a fresh $3.5 billion share buyback, and continues to pay a healthy dividend, which signals confidence in its cash-generation.
On the chart — assuming technical structure holds — the setup looks attractive: price is near the lower end of its ascending channel, 50EMA remains above 200EMA, and dips have tended to bounce off support.
That said, I’m keeping an eye on oil-price volatility and macro headwinds; those could test sentiment if commodity prices slide or demand softens.
Bottom line: Shell looks like a solid dividend-plus-value play right now — I’d consider entry on a dip, with a medium-term horizon.
Global Market Time Zone Arbitrage1. What Is Time Zone Arbitrage?
Time zone arbitrage refers to exploiting temporary mispricing in financial instruments caused by non-overlapping market hours. For example:
The U.S. market closes when the Asian markets are asleep.
The European market opens before the U.S., but after Asia has already moved.
Commodity futures in the U.S. may reflect global sentiment before Asian equity markets reopen.
These gaps create windows where prices adjust with a delay, allowing arbitrageurs to act quickly and capture profits.
The concept relies on the fact that markets, although globally integrated, respond to information at different times, and liquidity varies across sessions. This gives rise to price distortions that can be exploited for profit.
2. Why Time Zone Differences Create Arbitrage Opportunities
Several factors contribute to these opportunities:
A. Information Lag
When important economic data or geopolitical news is released during the closing hours of one market, the impact may not be priced into another market until it opens. Examples:
U.S. Federal Reserve announcements occur late in Asian hours.
European inflation data releases affect U.S. futures before cash markets open.
Traders who act early benefit from this information time lag.
B. Liquidity Imbalances
Liquidity varies across time zones. For example:
Asian markets often have lower liquidity for U.S.-linked ETFs.
Pre-market and after-hours trading in U.S. equities is less liquid, leading to wider spreads.
European market open tends to see high liquidity as it overlaps with Asian close.
Lower liquidity often leads to temporary distortions in pricing, ideal for arbitrage strategies.
C. Market Sentiment Spillover
Global sentiment travels through markets based on opening times:
Asian sell-offs usually influence the European open.
European movements influence U.S. futures.
U.S. closing trends flow into the next Asian session.
This chain reaction allows traders to anticipate moves and position themselves accordingly.
D. Different Valuation Models Across Regions
Investors in different regions may weigh information differently.
For example:
U.S. tech stocks heavily influence global sentiment, but Asian tech ETFs priced in local currencies may react with a delay.
European energy companies may react differently to U.S. crude price moves than American companies.
These valuation differences create price gaps.
3. Types of Time Zone Arbitrage
1. Cross-Market Equity Arbitrage
This involves using price movements in one market to predict movements in another.
Example:
U.S. NASDAQ falls 3% overnight.
Asian tech-heavy indices like Nikkei or Hang Seng tend to gap down at open.
Traders position themselves early to capture the expected gap.
2. ETF–Underlying Asset Arbitrage
Many global ETFs trade in the U.S., even when their underlying markets are closed.
Example:
The iShares MSCI Japan ETF (EWJ) trades in U.S. hours.
If EWJ falls after the Tokyo Stock Exchange closes, traders anticipate Tokyo will open lower.
Institutions buy or short the ETF after hours, then hedge positions when the underlying market opens.
3. Currency-Futures Arbitrage
Foreign exchange markets operate 24/5, but liquidity shifts across regions.
Example:
Strong U.S. economic data strengthens the USD late in U.S. hours.
Asian markets may adjust sharply at open using this new information.
Futures on currency pairs (e.g., JPY/USD) can show early reactions that are not yet reflected in related equity markets.
4. Commodity–Equity Arbitrage
Commodities like gold, oil, and copper trade nearly 24/7.
Copper price drops in the U.S. session might not immediately reflect in mining stocks in Australia until their market opens.
These mismatches create short-term arbitrage chances.
5. Index Futures vs. Cash Market Arbitrage
Index futures trade almost continuously, while cash equity markets operate only during specific hours.
Example:
S&P 500 futures drop at 2 AM during Asian hours.
Asian markets react immediately.
U.S. cash market does not reflect this drop until the New York open.
This delay produces opportunities for traders watching futures across time zones.
4. Practical Examples of Time Zone Arbitrage
A. U.S. Market Influence on Asia
Let’s say:
U.S. S&P 500 closes down 2% due to weak jobs data.
Asian markets are closed during the news release.
Asia opens and gaps down dramatically.
Traders monitoring U.S. data can pre-position in futures or ADRs (American Depositary Receipts).
B. European Market Influence on U.S. Pre-Market
Suppose:
ECB announces an unexpected rate cut at 12:45 PM CET.
U.S. markets are still hours from opening.
U.S. futures move first, followed by cash markets during the opening bell.
Knowledgeable traders arbitrage these price changes before U.S. markets react fully.
C. Gold Arbitrage Between U.S. and Asian Markets
Gold is priced globally, but miners operate regionally.
Example:
COMEX Gold drops at midnight Indian time.
Indian gold-linked equities and ETFs adjust only at market open.
This lag is a profitable window.
5. Risks In Time Zone Arbitrage
While lucrative, the strategy carries risks:
A. Unexpected News Before Market Open
Markets can reverse due to:
Overnight geopolitical events
Emergency press conferences
Central bank surprises
These can eliminate expected gaps.
B. Currency Volatility
When arbitraging international assets, currency swings can cut or reverse profits.
C. Liquidity Risks
After-hours markets often have:
Low volume
Wider spreads
High slippage
This makes execution tricky.
D. Overcrowding of Trades
Institutions and algorithms aggressively exploit these inefficiencies. When too many traders take the same position, the arbitrage window closes quickly.
6. Why Time Zone Arbitrage Still Exists Today
Despite globalization, arbitrage opportunities persist because:
Not all markets operate 24/7.
Retail sentiment spreads slower than institutional news.
Economic data releases are timed for specific countries.
Policy decisions occur during local business hours.
ETFs allow price discovery even when cash markets are shut.
These structural features ensure that time zone arbitrage will continue to remain relevant.
7. Conclusion
Global market time zone arbitrage is a sophisticated trading strategy that leverages asynchronous market hours, delayed price adjustments, and global sentiment flows. While technology has reduced many inefficiencies, markets still respond locally to global news at different times, and liquidity remains uneven across sessions. By understanding how information travels from Asia to Europe to the U.S. and back again, traders can identify profitable windows where prices have not fully adjusted.
However, success in time zone arbitrage requires speed, precision, risk management, and a deep understanding of global macroeconomics. For well-prepared traders, it remains a valuable tool for capturing short-term profits in an interconnected yet time-segmented financial world.

Global Banking and Financial Stability1. The Role of Global Banking in the World Economy
Global banking institutions include commercial banks, investment banks, universal banks, central banks, and cross-border financial intermediaries. These institutions perform several core functions that support global economic growth:
1.1 Capital Allocation
Banks collect deposits and channel them into loans for businesses, households, and governments. Efficient capital allocation ensures that productive sectors—manufacturing, technology, infrastructure—receive the funding they need to expand.
1.2 Facilitating Global Trade
Banks finance trade through letters of credit, export financing, and currency exchange. International transactions require trust, documentation, and risk management, which banks provide by acting as intermediaries.
1.3 Payment Systems
Modern banking supports real-time payments, cross-border remittances, SWIFT messaging, and digital fund transfers. These systems form the highway on which global money flows.
1.4 Risk Management and Hedging
Banks design instruments such as derivatives, currency swaps, and interest-rate futures, helping businesses manage forex, commodity, and credit risks. This stabilizes global supply chains and investment strategies.
2. The Architecture of Global Financial Stability
Financial stability means the system continues functioning even when faced with shocks—like economic downturns, geopolitical events, or market volatility. Several pillars support this:
2.1 Robust Banking Regulations
After the 2008 financial crisis, global regulators introduced stronger frameworks:
Basel III norms improved capital adequacy and liquidity requirements.
Stress testing ensures banks can survive market shocks.
Macroprudential regulations prevent systemic risks like credit bubbles.
These safeguards ensure banks hold enough capital and liquidity to absorb losses.
2.2 Central Bank Oversight
Central banks like the Federal Reserve, European Central Bank, Bank of England, RBI, and others play a major role in maintaining stability by:
Setting interest rates
Controlling inflation
Providing emergency funding through lender-of-last-resort facilities
Supervising financial institutions
Regulating payment systems
Their decisions directly affect borrowing costs, credit supply, currency values, and overall financial stability.
2.3 International Institutions
Bodies such as the IMF, World Bank, Bank for International Settlements (BIS), and Financial Stability Board (FSB) create global standards, provide financial aid during crises, and coordinate cross-border regulations. Their involvement becomes crucial during sovereign debt crises and currency collapses.
3. Key Risks to Global Banking Systems
Despite advancements in regulation, global banks face several systemic risks:
3.1 Credit Risk
The possibility that borrowers fail to repay loans. High default rates—especially in corporate or real-estate sectors—can weaken bank balance sheets.
3.2 Liquidity Risk
When banks cannot meet short-term obligations due to insufficient cash. Liquidity crises often trigger bank runs or emergency central bank interventions.
3.3 Market Risk
Changes in interest rates, currency prices, or asset valuations can reduce the value of a bank’s holdings. Sudden rate hikes or stock market crashes may cause large unrealized losses.
3.4 Operational and Cyber Risk
Digitalization increases the risk of cyberattacks on banks, potentially disrupting payment systems or exposing customer data. Technology failures also pose operational threats.
3.5 Contagion Risk
Because banks are interconnected, the failure of one major bank or a country’s financial system can create chain reactions globally. This was seen during:
The 2008 Lehman Brothers collapse
The 2011 Eurozone debt crisis
The 2023 regional bank failures in the U.S.
Interconnectedness magnifies both strength and vulnerability.
4. The Drivers of Financial Stability in the Current Global Environment
4.1 Strong Bank Balance Sheets
Global banks today hold higher capital buffers and liquidity reserves. This increases their ability to withstand market shocks.
4.2 Digital Transformation in Banking
Technology improves efficiency, risk monitoring, and compliance. Real-time data analytics help banks detect stress early and manage exposures more effectively.
4.3 Banking Consolidation
Mergers create larger, stronger banks with diversified operations. This reduces individual institution risk but can also create “too-big-to-fail” challenges.
4.4 Improved Crisis Management Frameworks
Many countries now have:
Deposit insurance
Resolution mechanisms for failing banks
Better stress tests
Contingency funding arrangements
These tools reduce panic and ensure orderly handling of distressed institutions.
5. Emerging Challenges for Global Financial Stability
5.1 Geopolitical Tensions
Trade wars, sanctions, and military conflicts affect currency stability, commodity prices, and cross-border capital flows.
5.2 Inflation and Interest Rate Volatility
High inflation forces central banks to raise rates. Rapid hikes increase borrowing costs and can strain banking sectors—especially in emerging markets.
5.3 Shadow Banking Risks
Non-bank financial institutions—hedge funds, fintech lenders, investment funds—play a growing role but operate with less regulation. Their instability can spill into the banking system.
5.4 Climate and Sustainability Risks
Climate-related disasters, ESG compliance pressures, and the transition to green economies impact credit portfolios, insurance markets, and investment strategies.
5.5 Digital Currencies and Decentralized Finance (DeFi)
While innovation brings opportunities, it also poses risks:
Volatile crypto markets
Lack of regulatory frameworks
Potential loss of monetary policy control
Cyber-vulnerabilities
Central Bank Digital Currencies (CBDCs) may reshape global banking in unpredictable ways.
6. The Path Forward: Strengthening the Future of Global Finance
Ensuring long-term global financial stability requires coordinated efforts across governments, banks, international organizations, and the private sector. Key priorities include:
6.1 Strengthening Regulation and Supervision
Continuous evolution of Basel norms, cyber-resilience frameworks, and cross-border regulatory cooperation is essential.
6.2 Enhancing Financial Inclusion
Stable banking systems must serve not just corporates but also small businesses and individuals. Digital banking, UPI-type platforms, and low-cost financial services reduce inequality and strengthen economies.
6.3 Building Resilient Digital Infrastructure
Banks must invest heavily in cybersecurity, cloud reliability, AI-driven risk analysis, and fraud prevention.
6.4 Sustainable and Responsible Banking
Green financing, climate-risk assessment, and ESG compliance will increasingly shape global credit flows and stability metrics.
6.5 Crisis Preparedness
Regular stress tests, liquidity buffers, and emergency response frameworks help ensure rapid containment of shocks without widespread disruption.
Conclusion
Global banking is the lifeline of modern economies, facilitating capital flow, trade, investment, and innovation. Financial stability depends on well-regulated, well-capitalized, and well-supervised banking institutions that can withstand economic and geopolitical shocks. As globalization deepens and new risks like cyber threats, climate change, and digital currencies emerge, maintaining stability will require constant vigilance, updated regulatory frameworks, and resilient financial infrastructure. Ultimately, the strength of the global banking system shapes the strength of the global economy, influencing growth, employment, and prosperity for billions of people.
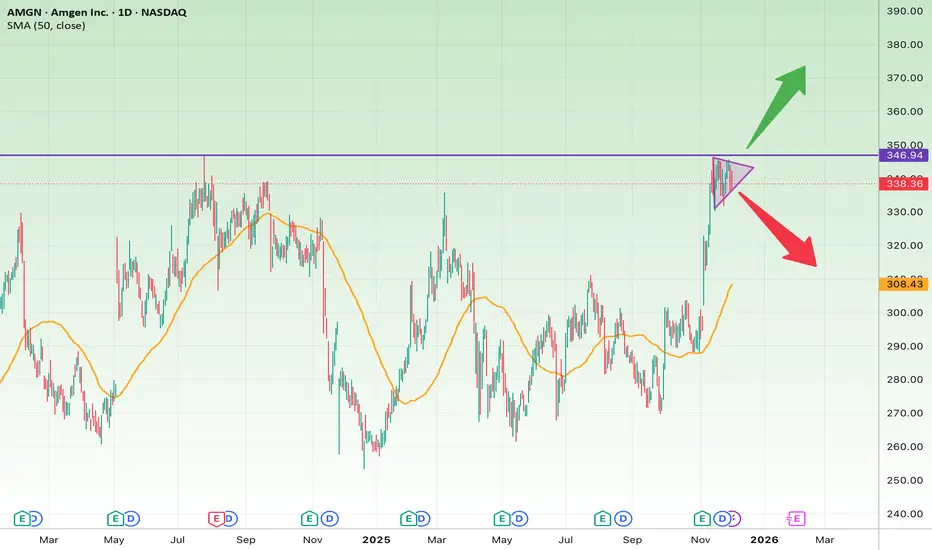
AMGN on the Verge of a Major Breakout1. Technical Analysis
AMGN has formed a bullish pennant pattern after a strong upside rally. This compression typically acts as a continuation setup, suggesting that buyers are preparing for another push higher—if the major resistance gives way.
Key Resistance
• $346.7 → Major multi-year resistance
Bullish Scenario
If AMGN breaks above 346.7:
• Target 1: $360
• Target 2: $370
• Target 3: $385
Bullish catalysts:
• Strong prior momentum
• Bullish Pennant continuation pattern
• Trading well above the 50-day SMA
Bearish Scenario
If price breaks below the pennant support:
• Support 1: $330
• Support 2: $318
• Support 3: 50-day SMA (~$308)
Suggested Stop-Loss
For short-term traders:
• Stop-Loss: A confirmed break below $330
(A close below 330 indicates weakness and invalidation of the pennant.)
For swing/mid-term traders:
• Stop-Loss (safer): $318
(Losing this level breaks the broader bullish structure.)
2. Fundamental Snapshot
Positives
• Strong revenue performance in specialty therapeutics
• Recent earnings beat expectations
• Healthy cash flow and margins
• Expanding R&D pipeline and new partnerships
Risks
• Intense competition within biotech
• Price-pressure risks
• Regulatory and FDA-related uncertainties
Summary:
The fundamentals remain strong and support the bullish technical structure unless major negative catalysts emerge.
3. Final Summary
AMGN is sitting at a critical inflection point.
A breakout above 346.7 could trigger a new bullish leg, while weakness below 330 activates the stop-loss for short-term traders.
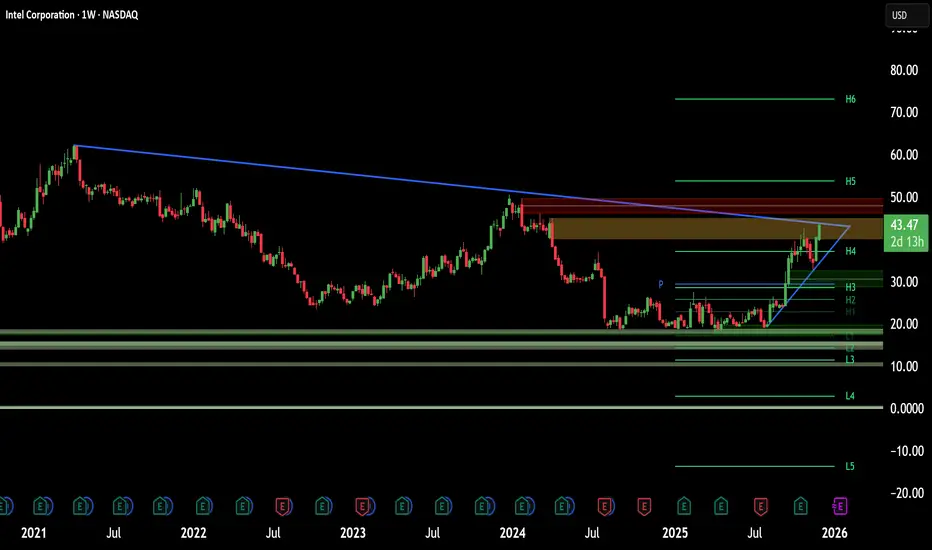
Is Intel’s Apple Deal the Ultimate Pivot?Intel (NASDAQ: INTC) stock soared over 116% this year. Reports suggest Apple may use Intel’s foundry by 2027. We analyze the drivers behind this potential resurrection.
Geopolitics & Geostrategy: The Stability Premium
In a volatile world, Intel offers a "stability premium." TSMC’s concentration in Taiwan risks Western supply chains. The US government now holds a ~10% stake in Intel. This actively incentivizes domestic production to secure the grid. Apple chooses Intel to hedge against geopolitical friction. This move aligns with US strategic interests, treating Intel as a sovereign asset.
Management & Leadership: The Tan Effect
CEO Lip-Bu Tan drives a massive cultural shift. He replaced Pat Gelsinger’s engineering vision with operational discipline. Tan prioritizes customer listening, an area where Intel historically struggled. This pivot is paying off. Securing Apple proves Intel is shedding its "arrogant" legacy. It is becoming a true service-oriented foundry.
Technology & Innovation: The 18A-P Advantage
The deal relies on Intel’s **18A-P process technology**. Apple aims to use this for entry-level M-series chips. This validates Intel's aggressive manufacturing roadmap. Additionally, the Trump administration invested $150 million in xLight. This startup develops next-gen lithography lasers to aid chipmaking. It reinforces the ecosystem surrounding Intel’s manufacturing capabilities.
Business Models: The Foundry Pivot
Intel is transforming from a product company to a hybrid foundry. Analysts estimate the Apple deal could generate ~$1 billion annually. However, the "Apple Seal of Approval" is worth far more. It signals to giants like Qualcomm that Intel is ready. It also creates leverage against TSMC’s pricing power.
Final Verdict: The Apple rumors convert Intel into a legitimate turnaround play. US geopolitical interests align with the new leadership. Validated technology suggests Intel’s worst days are likely over.
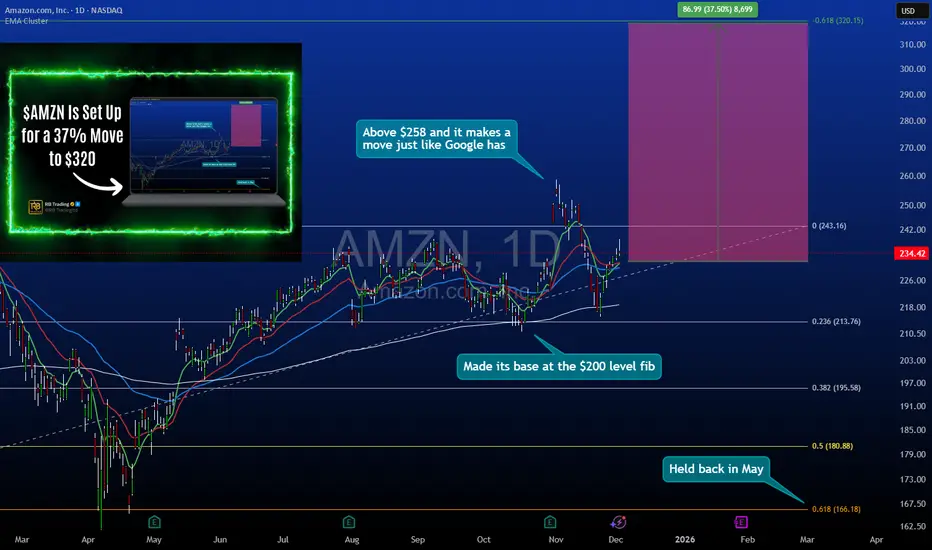
Amazon - Big Tech Pullback Strategy Into $232 SupportAmazon Multi-Month Position Build: $232-234 Entry Zone Targeting $320
Amazon has pulled back into a critical support zone at $232-234, presenting the same geometric retracement setup that recently validated on GOOGL. This analysis breaks down why this level offers favorable risk/reward asymmetry for a multi-month position targeting $320.
🎯 Setup Overview:
Entry Zone: $232-234 (current pullback area)
Primary Target: $320 (37% upside potential)
Timeframe: Multi-month position (Q1-Q2 2025)
Pattern: Structured retracement in established uptrend
📊 Technical Structure:
Support Confluence at $232-234:
0.618 Fibonacci retracement from recent swing low to high
Previous consolidation zone that acted as resistance, now support
Volume profile shows significant accumulation at this level historically
Aligns with rising trendline from 2023 lows
Price Action Context:
Amazon rallied from $140 lows to $260+ highs before this pullback. The current retracement brings price back into a zone where buyers have historically stepped in with conviction.
Why $320 Target:
Represents the next major resistance zone from prior price structure
Aligns with measured move extensions from current base
37% upside provides asymmetric reward relative to defined risk
🔍 The GOOGL Parallel (Why This Pattern Works):
What Just Happened with GOOGL:
Google recently pulled back into a similar geometric retracement zone (0.618 level) and reversed sharply, validating the strategy of buying quality big tech names during structured pullbacks rather than chasing momentum.
Why The Pattern Repeats:
Institutional Behavior: Large funds rebalance and take profits at resistance, creating predictable pullback zones
Liquidity Zones: Support levels represent areas where prior buyers have conviction and add to positions
Mean Reversion: Extended moves in trending assets typically retrace to specific mathematical levels before continuation
Key Lesson from GOOGL:
The most uncomfortable entry (during the pullback) provided the best risk/reward. Waiting for "confirmation" meant entering 15-20% higher with expanded risk.
📈 Why This Setup Makes Sense:
Risk Is Defined:
Stop loss placement below $225 (structure breakdown) limits downside to ~$7-9 per share from mid-range entry at $233. If price breaks $225, the bullish thesis is invalidated.
Reward Is Probable:
The $320 target isn't arbitrary it's based on:
Previous resistance turned future resistance
Fibonacci extension levels from the pullback
Historical price behavior at major psychological levels
From $233 entry:
Risk: ~$8 to stop at $225
Reward: $87 to target at $320
Ratio: ~10.8:1
Even a conservative partial target at $280 (first resistance) still offers 6:1 reward/risk.
🛡️ Risk Management Framework:
Entry Strategy (Scaling In):
First position: $234 (initial test of support zone)
Second position: $232 (if support retests cleanly)
Final position: $228-230 (if maximum pain occurs but structure holds)
This averaging approach improves entry price while maintaining discipline.
Stop Loss Placement:
Below $225 - a decisive break of this level invalidates the support thesis and requires exit regardless of unrealized loss.
Target Management:
First reduction (1/3): $270 (previous resistance, books profit)
Second reduction (1/3): $295 (psychological level, locks gains)
Final exit (1/3): $320 (primary target, complete position close)
Progressive profit-taking removes emotion from exits.
🧠 Trader Psychology: Why Most Will Miss This:
The Discomfort Factor:
At $234, Amazon "feels" weak because it's down from $260. At $270, it will "feel" strong because it's rising. But the best risk/reward exists now, not later.
Recency Bias:
Recent selling pressure makes traders assume more downside. Historical structure suggests this is where buyers return.
Waiting for Confirmation:
Many will wait for price to break above $250 to "confirm" strength. By then, risk to $225 expands dramatically and reward compresses.
The GOOGL Proof:
Those who waited for Google to "prove itself" entered 18% higher with worse risk parameters. The same pattern is setting up here.
📊 Tools Supporting This Analysis:
Fibonacci Retracement:
0.618 level at $232 marks the zone where pullbacks in strong trends typically find buyers.
Volume Profile:
High volume node around $230-235 indicates this area has been contested heavily—now it must hold as support.
Trendline Analysis:
Rising support from 2023 lows intersects with current price, adding confluence to the $232 zone.
Market Structure:
Higher lows and higher highs remain intact. This pullback is a correction within an uptrend, not a reversal.
🎯 Why Big Tech Pullbacks Work:
Quality + Liquidity:
FAANG stocks have deep liquidity and institutional ownership. When they pull back to structure, buyers appear because the underlying businesses remain strong.
Rotation, Not Rejection:
Selloffs in mega-cap tech are often profit-taking and sector rotation, not fundamental deterioration. This creates buy-the-dip opportunities.
Historical Precedent:
Amazon has repeatedly rewarded buyers who entered during 15-20% pullbacks to support in multi-year uptrends.
📅 Timeframe Expectations:
Not a Day Trade:
This is a multi-month position (potentially 3-6 months to target). Intraday volatility should be ignored.
Quarterly Catalysts:
Amazon's next earnings report and holiday season results could act as catalysts for the move toward $320.
Patience Required:
The $232 level may retest multiple times before resolving higher. Position sizing should accommodate short-term volatility.
⚠️ What Could Go Wrong:
Macro Headwinds:
Broader market selloff could pressure all equities regardless of individual structure. The $225 stop exists for this reason.
Sector Rotation:
If money flows out of tech entirely, support may not hold. This invalidates the thesis and requires disciplined exit.
Earnings Risk:
If holding through earnings, position sizing should account for potential volatility. Consider reducing exposure before the event.
Breaking Support:
If price closes below $225, the setup is broken. No hoping, no averaging down further—just exit and reassess.
🏆 The Professional Approach:
They Buy Structure, Not Stories:
The $232 level isn't interesting because of news or narratives. It's interesting because risk is small and reward is large based on geometry.
They Scale Positions:
Rather than going all-in at $234, they build the position across $234, $232, and potentially $228. This reduces timing pressure.
They Accept Being Wrong:
If $225 breaks, they exit with a small, controlled loss. Pride doesn't enter the equation.
They Journal the Setup:
Entry rationale, risk parameters, and targets documented before the trade. Emotions don't dictate exits.
📌 Key Takeaways:
✅ GOOGL validated the pattern: The same pullback-to-support strategy that worked on Google is setting up on Amazon at $232-234.
✅ 10:1 risk/reward exists now: Entry at $233 with $225 stop and $320 target offers exceptional asymmetry this compresses as price rises.
✅ Multi-month timeframe: This isn't a quick flip. Targets may take 3-6 months. Position sizing and patience are critical.
✅ Structure over emotion: When $234 feels scary, that's the signal. When $280 feels safe, that's the warning.
✅ Scale in, scale out: Build the position across the zone, exit progressively at targets. This removes timing pressure and locks gains.
⚠️ Important Disclaimers:
This analysis is for educational purposes and reflects a technical view based on price structure, historical patterns, and risk/reward calculations. It is not financial advice or a recommendation to buy or sell AMZN or any security.
The $232-234 support zone could fail. The $225 stop loss exists because no support level is guaranteed. Proper risk management requires accepting potential loss if structure breaks.
Targets are based on historical resistance levels and do not guarantee future performance. Market conditions, company-specific events, and macroeconomic factors can prevent targets from being reached.
The GOOGL comparison is for educational pattern recognition, not a guarantee that Amazon will follow the same path. Each setup has unique risks.
Always conduct independent analysis, size positions according to your risk tolerance, and consider consulting a financial professional. All investing involves risk of loss.
✨ Join the Discussion:
Are you watching Amazon at these levels? Have you used similar pullback strategies on big tech names? Share your thoughts or questions in the comments below.
📜 Buy structure. Define risk. Trade with discipline.
Bottoming out NASDAQ:ALGN has bottomed out and its close to completing its accumulative phase once it breaks above US$150.00. Ichimoku shows three bullish golden crossover and its likely to see strong bullish rebound going forward. MACD histogram is positive and stochastic has shown overbought crossover.
Target over the near to mid-term is at 200.00

Near-term accumulation doneNYSE:ACN bottom has seen a recovery and its likely to see strong upthrust going forward as it has broken out of the consolidative range and the falling wedge formation. Ichimoku has confirmed its three bullish golden cross and long-term MACD is showing positive momentum.
Target in the near to mid-term will be at 300.00

DASH - gap fill to upside plus $100 million insider buyingDASH - Stock seeing a nice move higher post $100 million insider buyer. Stock has big gap to fill to the upside from $215 to $242. looking for calls as long as $215 holds. could see a possible gap fill.

MSTR - 3 Bar pattern followed by reaction - powerful pattern !MSTR - 3 Bar pattern followed by reaction - powerful pattern ! - based on BTC strong reaction, monitor check if it can clear the symmetry and make higher low post clearing the symmetry overhead!


PAAS LongLong Monday on a flat or lower market open
Aggressive long because we are way above VAH into breakout territory
SL 33.38
TP 38.39

$70 coming soon?This looks bullish and came back into that channel, a classic reversal. I think its going to hit 75 in next 6-9 months. If it looses 35, then its bearish and can go down from there.
All the best !!

$AMD Short Target - $200 - About to Break Support Trend?AMD Is about to break support and take a nose-dive. The next trendline, even with positive volume seems to be mostly sells. $200 as a short-term target before retracement seems reasonable. As always, none of this is investment or financial advice. Please do your own due diligence and research.

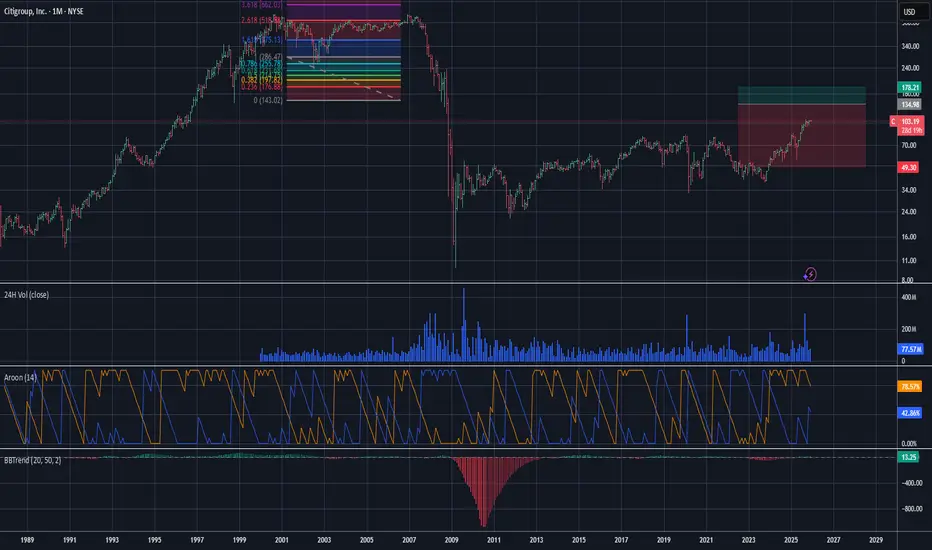
Citigroup Short - $88 TargetThe support curve seems to be breaking again for Citigroup in similar pattern as it has had for nearly 14 years. If the curve doesn't allow for a continued uptrend, in which volume seems to be low, then it could end up retracing back down to $88. As always, none of this is investment or financial advice. Please do your own due diligence and research.
META - Weekly - Dealing With a Fibonacci LayerThe asset is currently at a crucial Fibonacci resistance layer, suggesting a near-term ceiling or range-bound trading zone, which complicates immediate price action, although the 200-day EMA appears to be the more reliable support level compared to the 100-day EMA. This technical caution is amplified by a pattern of decreased weekly volume since early 2024, mirroring the distribution phase seen before the July 2021 correction, which strongly indicates a likely, gradual correction to the $500 or potentially the $300 level. Fundamentally, the company remains robust in the long term due to strong annual net income and revenue growth, normal debt levels, and ample free cash flow and cash equivalents; however, the significant quarter-over-quarter drop in net income from Q2 2025 to Q3 2025 raises short-term skepticism about its immediate health, aligning with the bearish technical outlook for a substantial correction before the long-term fundamentals can drive the next major upswing.
Not financial advice, always do your due diligence
Leave a like👍 and/or comment💬.
We appreciate and value everyone's feedback!
- RoninAITrader

$LYFT - Worth Keeping an Eye On LyftLyft has been trending towards consistent profitability and the margins have been improving. Keeping a close on eye on this one. Could see a nice run up.
Disclaimer:
I do not provide personal investment advice and I am not a qualified licensed investment advisor. I am an amateur investor.
All information found here, including any ideas, opinions, views, predictions, forecasts, commentaries, suggestions, or stock picks, expressed or implied herein, are for informational, entertainment or educational purposes only and should not be construed as personal investment advice. While the information provided is believed to be accurate, it may include errors or inaccuracies. I will not and cannot be held liable for any actions you take as a result of anything you read here.
Conduct your own due diligence, or consult a licensed financial advisor or broker before making any and all investment decisions. Any investments, trades, speculations, or decisions made on the basis of any information found on here, expressed or implied herein, are committed at your own risk, financial or otherwise.
Feel free to give us a follow and shoot us a like for more analysis updates

$PG $143.62 - MultiTimeFrame Trendline HoldDaily chart (1D): The trendline has been tested 6 times and has held each time, showing strong long-term support.
1-hour chart (1H): The trendline shows 7 touch points, reinforcing intraday strength.

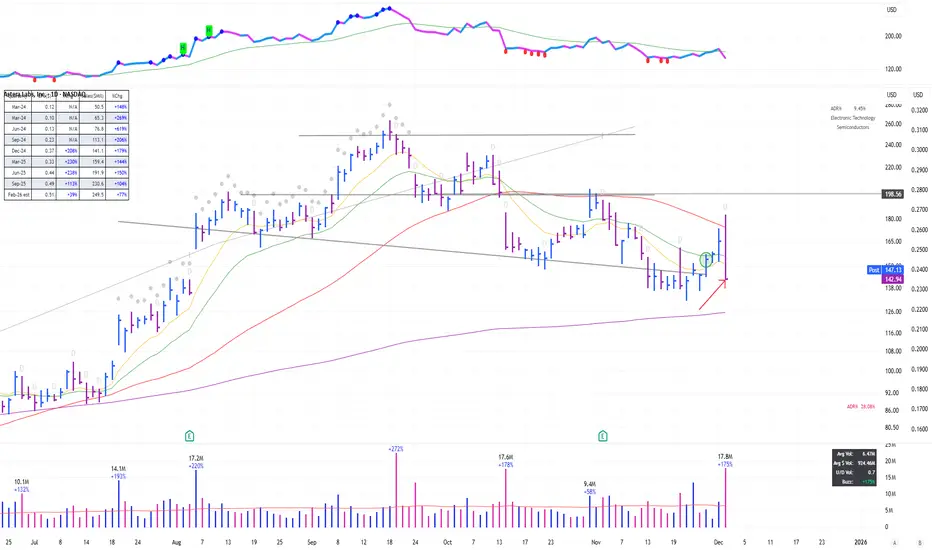
Trading Journal $ALAB Bought as it was showing relative strength while the market was coming off its lows. However, the 20% reversal from the high on heavy volume suggests it’s likely to find some support around the 200 MA now...
Apple Stock Setup: Momentum and Patterns Point Toward New ATHA deep dive into Apple’s latest technical setup, analyzing MACD momentum, RSI strength, and emerging chart patterns that signal a potential breakout toward a new all-time high around $290.

META — WEEK 49 TREND REPORTNASDAQ:META — WEEK 49 TREND REPORT
Ticker: NASDAQ:META — 12/02/2025 @ 647.10$
Timeframe: WEEKLY
This is a reactive structural classification of NASDAQ:META based on the weekly chart as of this timestamp. Price conditions are evaluated as they stand — nothing here is predictive or forward-assumptive.
⸻
1) Current Trend Condition
• Trend Duration: +9 weeks (Bearish)
• Trend Reversal Level (Bullish): 670.20$
• Trend Reversal Level (Bullish Confirmation): 688.75$
• Pullback Support: 645.90$
• Correction Support: 525.73$
⸻
2) Structure Health
• Retracement Phase:
Correction (approaching 61.8%)
• Position Status:
Unstable (price below both structural layers)
⸻
3) Temperature :
Cooling Phase
⸻
4) Momentum :
Bearish
⸻
5) Market Sentiment
Bearish
⸻
Author’s Note
This analysis is fully reactive, not predictive. Market conditions, trend structure, and behavior are classified as they appear in real time. The objective is to identify where directional shifts first occurred, where structural integrity remains intact, and where it would begin to weaken if key levels were breached.
Predictive analysis projects outcomes that do not exist yet. Without price confirmation, prediction is built on baseless assumptions. This framework avoids that entirely by responding only to verified structural changes and live conditions.
The levels shown simply identify where the current trend structure first shifted and where it would begin to lose integrity if breached. Recognizing these boundaries allows for clearer interpretation of market behavior without relying on forward guarantees, speculative projections, or unsupported assumptions.
⸻
Methodology Overview
This classification framework evaluates directional conditions using internal trend-interpretation logic that references price behavior relative to its structural layers. These relationships are used to identify when price movement aligns with the framework’s criteria for directional phases, transition points, or regime shifts. Visual elements or structural labels reflect these internal interpretations, rather than explicit trading signals or preset indicator crossovers. This framework is observational only and does not imply future outcomes.

New Setup $Z, Daily, Short$Z on the daily chart shows a potential bounce on the ema50d as resistance.
The bearish trend is well consolidated and a catch is possible after the candle of today.
