SPX to Money Supply WARNING!If the charts aren’t showing bubble setups, I’m not going to invent them. I post what the data shows. So please don’t shoot the messenger when I say GTFO & STFO.
And just to keep the facts straight:
Brokerage, stock, and crypto accounts are not part of M2.
Why does M2 matter?
It’s the actual spendable money in the economy.
When M2 grows faster than real output (as it did in 2021), price pressure builds.
The economy runs on liquidity.
Retail, goods, services all of it requires money you can actually spend, not paper gains in a trading account.
When the S&P 500 disconnects massively from M2 — like during the dot-com bubble — revenue and profit growth can’t keep pace. Valuations expand purely on speculation, not on real, organic fundamentals. That’s how multiples stretch and bubbles form.
The problem? Most retail traders have no idea this is happening. They’re trading with their hair on fire, following cute social-media stories dressed up as “analysis,” using strategies that have never been tested in real markets.
And that’s exactly how bubbles are fed:
big players sell into retail euphoria, and retail ends up holding the bag of schitt!
Buy when stocks are cheap, not at all-time highs in euphoria land.
"Price is what you payt, VALUE is what you get!"
THANK YOU for getting me to 5,000 followers! 🙏🔥
Let’s keep climbing.
If you enjoy the work:
👉 Drop a solid comment
Let’s push it to 6,000 and keep building a community grounded in truth, not hype.
Trade ideas

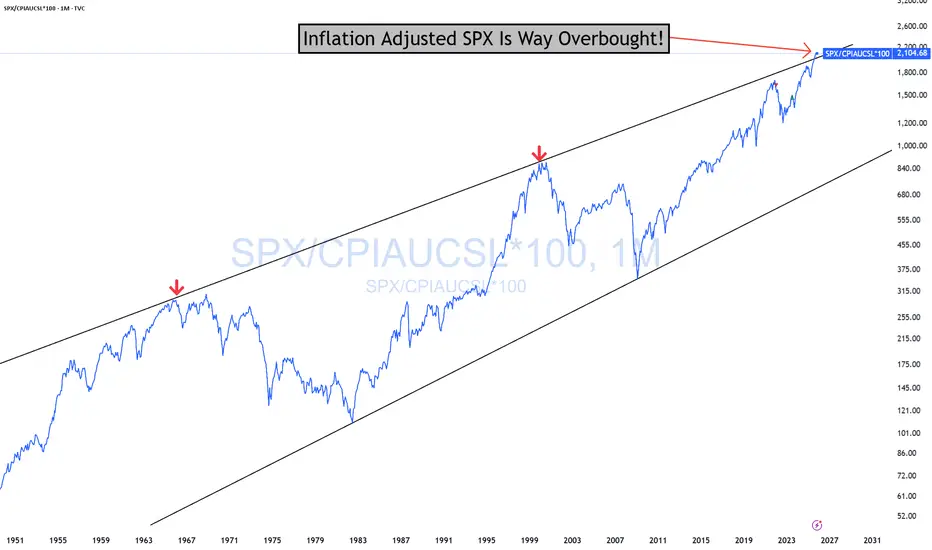
SPX Overbought In Real Terms WARNING!SPX Overbought In Real Terms (Inflation-adjusted) Stripping away inflation shows you the "real" value of SPX.
This is not something you will likely see again in your lifetime. We have only been this overbought twice before since 1947! Both times, what followed was a bear market. You are far more likely to see the price hit the bottom of the channel in your lifetime.
As is always the case, no one will want to touch stocks then. Rest assured, I, for one, will be buying up a storm then.
You have all been WARNED!
GTFO and STFO!
Risk Management is paramount!
THANK YOU for getting me to 5,000 followers! 🙏🔥
Let’s keep climbing.
If you enjoy the work:
👉 Boost
👉 Follow
👉 Drop a solid comment
Let’s push it to 6,000 and keep building a community grounded in truth, not hype.
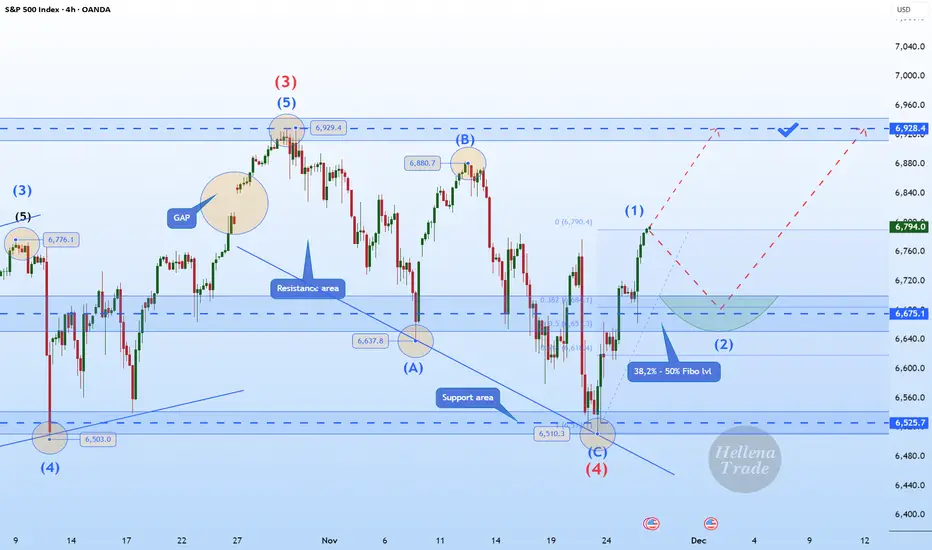
Hellena | SPX500 (4H): LONG to MAX of wave "3" of 6928.Colleagues, we continue the previous scenario of upward movement in the impulse “12345”.
I expect a small correction in the middle order wave “2” approximately to the area of 38.2%-50% Fibonacci levels (6675).
Then I expect a continuation of the upward movement to the maximum of the wave "3" of the higher order 6928.4.
It is possible that the first wave may be stretched, which may mean a correction-free movement to the target.
Fundamental Context.
Market sentiment remains cautiously bullish ahead of this week’s US data releases. Investors continue to price in a softer Fed policy path for 2026, which supports the equity market after the recent correction.
US Treasury yields remain under pressure, and the latest macro indicators — especially labor market cooling and weaker business activity components — reinforce expectations of an economic slowdown. This backdrop typically favors equity upside as markets look ahead to potential policy easing.
Manage your capital correctly and competently! Only enter trades based on reliable patterns!
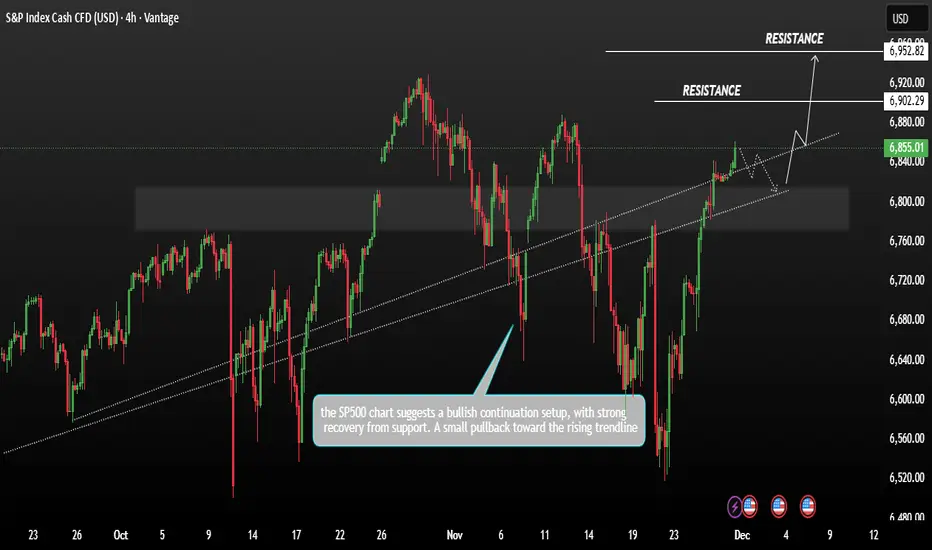
SP500 Consolidation bullish momentumSP500 showing price action between late September and early December the SP is trading around 6,855 after a strong upward move recent candles show bullish momentum pushing above a previously broken trendline.
The S&P 500 rose on Friday, pushing it close to its record high. A strong November rally, fuelled by investor optimism over potential Federal Reserve interest-rate cuts, has continued to lift stocks.
Technically, if the price maintains its bullish zone within the current range, we could expect further upward movement. The next major resistance zone is projected at 6902–6952.
You may find more details in the chart,
Trade wisely best of luck buddies.
Ps; Support with like and comments for better analysis thanks for supporting.
SP500 Bullish Divergence Detected (SPY)Bullish divergence of the SP500 and NYSE Advance Decline Line (ADL) is one of the most powerful and reliable "leading" indicators available. Here we see the ADL make a new high (a higher high) while the SP500 does not make a new high. This divergence indicates that market breadth is markly improving, which will ultimately drive the SP500 up to new all time highs in the coming weeks or months.
I am well aware of discussions about bubble fears and valuation concerns. It's important to note that the market can continue to increase for some time even with these concerns, so it would be a mistake to get out of or short the market at this time. Also, the technicals are pointing higher, not lower.
As long as this train keeps chugging, we should stay on this ride! Go long on SPY, VOO, QQQ!!!

The Culmination of the 2025 Bull Market: AI Mania Tipping PointThe Culmination of the 2025 Bull Market: AI Mania Tipping Point
A. Geometry of the 2-Week Chart
On the 2-Week chart, price has reached the upper boundary of the 1:20 parallel channel —
the same structural angle that has defined the entire post-2020 bull cycle.
This angle rises at 20 points per 2-week bar, and the market has touched it only at major cycle culminations:
Jan 3, 2022 — Major Top
Oct 10, 2022 — Capitulation Low
Oct 23, 2023 — Structural Low
Apr 7, 2024 — Angle Retest Low
Oct 27, 2025 — Structural Top
Each contact marked the exhaustion of one cycle and the birth of another.
Today, price is pressing against this ceiling with the weakest internal motion of any prior touch.
B. Speed & Acceleration on the 2-Week Chart
The internal motion confirms the structural peak.
⚡ Speed Has Rolled Over
Speed at the February 2025 top reached 159 Market Knots.
At the October 2025 top, Speed failed to exceed that reading.
Price made higher highs while Speed made lower highs.
Higher highs with lower speed = exhaustion.
The trend is rising, but the force behind it is hollow.
🔻 Acceleration Has Already Turned Negative
Acceleration always breaks first —
it is the earliest signal of structural weakness.
Acceleration turning negative on the 2-Week chart reveals something critical:
It can go much deeper negative.
The force of the trend is collapsing before price.
Acceleration turning negative on the 2-Week chart reveals something critical:
It can go much deeper negative — the force of the trend is collapsing before price.
📉 The Unified Signal
When both Speed and Acceleration deteriorate at the highs,
the market becomes structurally vulnerable.
C. The 2-Day Chart — Short-Term Angles Breaking
Inside the broader structure, the rise has been carried by two steep geometric angles:
The $4-per-degree angle
From the Oct 27, 2023 low
(1° = 4 points)
The $8-per-degree angle
From the Apr 7, 2025 low
(1° = 8 points, the steepest of the advance)
Both angles have now broken.
This confirms what the 2-Week structure already signaled:
the completion of a cycle.
D. 2-Day Motion (Market Knots) — Internal Force Collapsing
The 2-Day chart reveals what the price action hides:
the internal engine of the trend has failed while price still sits near the highs.
⚡ Speed has imploded
Price is still hovering near peak levels
But Speed has collapsed straight downward
This is one of the strongest exhaustion signatures the Market Knots System can print
When Speed collapses while price remains elevated, the trend is no longer supported —
it is hanging at the highs without the force that once carried it and dangerously no structure beneath .
🔻 Acceleration is deeply negative
Acceleration has plunged into the deepest negative zone since 2022
The internal force behind the advance is not just fading —
it has completely reversed
Acceleration is violently negative.
This creates a structurally fragile condition:
The trend’s internal force has shut down, and price is standing on hollow ground.
2. CONVERGENCE OF CYCLES — December as the Stress Point
This breakdown occurs precisely as multiple independent cycles converge into the same temporal window —
a natural stress point in the market’s architecture.
• The 2020 Cycle — Five Years Completed
The post-pandemic cycle that began in March 2020 now enters year five —
a common terminal phase in Gann-based cycle structures.
Five-year expansions often mark major growth culminations before a structural reset.
• The 2021/2022 High — A 3-Year Echo
The December 2021–January 2022 top forms a three-year resonance window.
Markets often return to the vibration of prior highs on a three-year cadence.
Once again, we arrive in the December–January window.
• The 7-Year Cycle (2520°) — The Echo of 2018
In 2018, the market peaked early in Q4 and panicked into December
as liquidity tightened and the long structural angle exhausted.
Seven years later, in 2025, price stands in the same geometric position:
touching the top of its structure, with motion collapsing and key angles broken.
Seven-year cycles often carry the potential for panics, sharp declines, and structural breaks
when the underlying geometry reaches full extension.
3. VALUATIONS — A Market Lifted by the Few
The 2025 advance has been extraordinarily narrow.
Nine companies now represent 37.64% of the S&P 500:
NVIDIA
Apple
Microsoft
Amazon
Alphabet (GOOGL + GOOG)
Broadcom
Meta
Tesla
This is not a broad-based advance.
It is an AI megacluster lifting the entire index.
Top S&P 500 YTD Performers (AI/Tech-Linked)
And the top S&P 500 YTD performers inside the index are also AI/Tech domiannt.
Western Digital (WDC) — +208.82%
Robinhood (HOOD) — +187.98%
Seagate (STX) — +175.16%
Micron (MU) — +146.40%
Palantir (PLTR) — +104.75% (Ranked #7 on official S&P list)
Lam Research (LRCX) — +97.49% (Ranked #8 on official S&P list)
AI Mania Is the Only Engine
The market’s strongest performers — both mega-cap and mid-cap — are uniformly driven by:
AI hardware
AI compute capacity
AI storage and memory
AI cloud infrastructure
AI-driven speculation flow
This is not organic economic breadth.
It is a narrow, leveraged bet on a single technological axis, carrying the S&P to its ceiling.
A Structural Imbalance
When nearly 40% of index weight — and nearly all performance — comes from one cluster,
the structure becomes top-heavy, like a building with all its weight on a single floor.
The index reached its 2025 peak
not through collective expansion,
but because a handful of megacap Tech/AI companies propelled it upward in stalling economy.
5. SYNTHESIS — A Moment of Completion
The 2025 bull market has reached its culmination.
A cycle viscously powered by a narrow AI concentration.
The market stands at the top of its orbit,
supported by a structure whose internal beams are already failing.
Historically, this alignment produces volatility as one cycle completes and the next takes form.
Multiple independent cycles — 5-year, 3-year, and 7-year — are converging into the December/January window
Our geometric measurements indicate a contraction of prices in December and into Q1 of next year. This will initiate a price decline back toward the 1:20 angle into 2026, followed by a resumption of higher prices into 2027.
Nana Hermes —
All Things Move by Measure.

Sell US500 – Clear Signs of Bearish Smart-Money Flow1. Bearish structure confirmed
The previous bullish Order Block has been completely broken with a sharp displacement and high volume.
When an OB fails this decisively, it signals a clear shift in market structure from bullish to bearish as buyers lose control.
2. New Bearish Order Block formed at the break of structure
After the breakdown, price retraced back into the zone above the break and created a new VNShark-OB:
Strong breakout volume → footprint of Smart Money stepping in
Wide Imbalance (IMB) → liquidity gap left unfilled
Initial reaction from the zone → sellers defending the area
This is a typical smart-money pattern before the next bearish leg.
3. Trade Plan – Two Sell Limits
Sell Limit 1
First touch of the new OB
50% position size
Sell Limit 2
Higher liquidity sweep
100% position size
Expectation: Smart Money may push price higher to hunt liquidity before sending it lower.
4. Risk Management & Notes
No chasing if price drops without a retest
Position size according to strict risk management
Avoid trading near major news releases
Setup becomes invalid if price closes above the entire OB zone
Do not hold trades over the weekend
Signature
Follow VNShark to understand how Smart Money leaves footprints — and how you can follow them with precision.

S&P500 Idea FOMCBias until Dec FOMC:
We will be looking to continue to ride the Fed rate cuts odds increased on the markets as that is still holding most weight at the moment and will most likely continue to do so until the FOMC decision on 11 December.
The markets have been primarily pricing in the rate cut expectations 30 days well before the actual FOMC decision, there during the actual Rate decision release, we barely get any impact and we get markets repositioning for any future guidance to come. Basically a case of ‘Buy the rumour and Sell the news’’ play.
- Because at the moment, we have been seeing rate cut probabilities increasing to 85% which has been holding most weight for Gold upside and giving the greedy intuitions a reason to further buy up risk assets.
However,
- This doesn't mean that Dec is a guaranteed rate cut, and during the December FOMC, the fed may either cut rates by 25bps or Hold rates, and if there future guidance remarks are hawkish since inflation is still elevated - then we can see Profit taking on risk assets. Therefor expect to see Gold bears, DXY bulls, BTC Bears, Stock bears.
So until the actual December FOMC, If December Rate cut probabilities are still elevated (80%+), then, we can still expect Buyers in control on Risk assets, so:
- DXY - Downside.
- GOLD - Upside , potentially retest upto previous ATH’s $4380’s. Then Profit taking post FOMC.
- US Stocks - Upside on SPX to make New ATH’s and bearish wave if Dec FOMC hawkish.
- BTC - Upside to 100k, prev supply zone before Correction bearish phase.
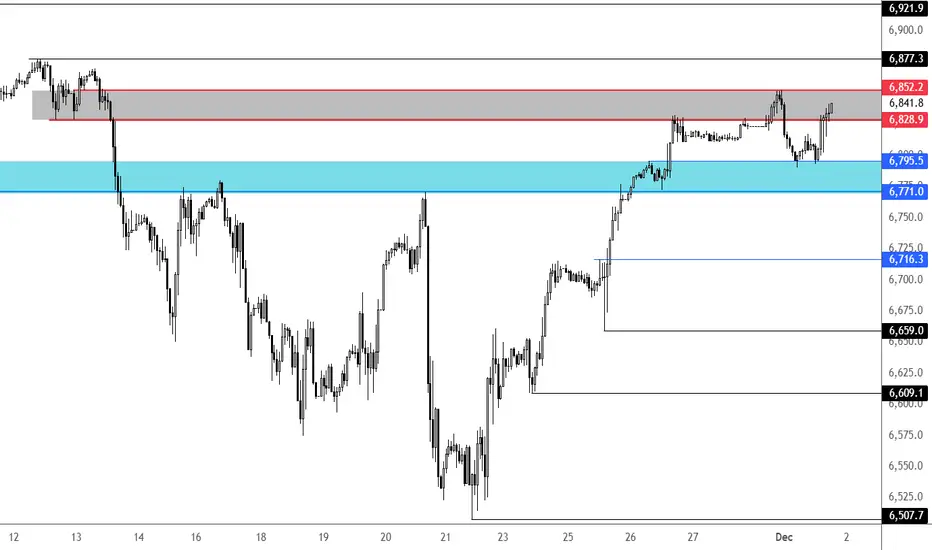
S&P 500 key levels to watchUS indices have managed to bounce nicely off their overnight lows, despite concerns about the yen-funded carry trade unwind and crypto selling. The S&P has now entered a key inflection point again, near 6840-52 area; let's see whether the bulls will be able to reclaim this zone and kick on from there, or whether the selling resumes. Shaded blue area is the key support zone to watch between 6771-6795; bearish if we go below there.
Fawad Razaqzada, market analyst with FOREX.com
SPX — a new ATH is coming very soon.The market has just formed a clean initial impulse and broke out of the descending Andrews pitchfork , which tells us one thing: the correction is about done. (I previously expected a triangle as a possible correction, but the structure is now clear.)
From here, the next step is simple — a new all-time high.
Targets: I’m focused on the 127.2% and 161.8% Fibonacci extensions of the correction.
Trading plan: I’m waiting for a local 3-wave pullback — and only then I’ll enter on the breakout. Entering “just because it dipped” — ❌ never an option.

A Storm Is Coming?Core Thesis: The market is colossally underestimating the risk of a deliberate US dollar devaluation. Contrary to popular belief, a weaker dollar in this specific context will not boost risk assets but will instead be the source of massive volatility, potentially exceeding 2008. The collapse will come from the unwinding of a global dollar-centric carry trade.
The Pillars of the Storm:
The Structural Imbalance (The Fuel):
The US, as the world's largest importer, sends dollars abroad. To maintain their export-oriented economies, foreigners reinvest these dollars into US assets (especially the top 7 S&P 500 stocks).
This has created a structural "carry trade": global investors are overexposed to US assets and, trusting that the dollar rallies in crises (like 2008), do not hedge their currency risk.
This continuous flow is a primary reason for extreme US equity market valuations. Global liquidity, not just fundamentals, has inflated prices.
The Trump Agenda (The Trigger):
The Trump administration is actively pursuing a weaker dollar to gain an upper hand in the economic conflict with China, using tariffs as leverage.
Since Trump took office, we have already seen episodes where the dollar and stocks sell off simultaneously – a warning sign that the traditional correlation is breaking.
The Federal Reserve (The Accelerator):
Trump needs a dovish Fed to weaken the dollar. The appointment of Steven Miran to the Fed, with his interest rate projections 100bps below other members, is a clear signal of this direction.
A new Fed Chair, more aligned with Trump, will likely take over in 2026 to implement a more aggressively accommodative monetary policy.
The Crisis Mechanism:
The trap is set in the following scenario:
The Fed cuts rates aggressively to weaken the dollar, following Trump's agenda.
The dollar devalues significantly.
For a foreign investor, the return is: (S&P 500 Return) + (FX Change). With the dollar falling, their gains are eroded or turn into losses.
This triggers a mass exodus of these foreign investors, who start selling US assets to protect their returns.
The selling is amplified by the structural fragility: everyone is positioned the same way. Liquidity evaporates.
Panic sets in when the typical "Fed put" (intervention to save the market) fails, because more liquidity injected by the Fed would depress the dollar even further, amplifying the equity selloff instead of containing it.
Warning Signals to Monitor:
Primary Signal: Equity selling occurring simultaneously with a depreciating dollar.
Confirmation Signal: A rise in implied volatility (skew) in the currency market.
Market Signal: Underperformance of high-beta and low-quality stocks, indicating that risk capital flows are drying up.
Critical Signal: Any Fed intervention that, instead of calming the market, causes an even larger selloff in the dollar and stocks.
Current Positioning & Conclusion:
In the short term, the author maintains long positions in equities, gold, and silver, as liquidity tailwinds are still favorable. However, the storm is forming. The market is as complacent about a weak dollar as it was about mortgages in 2007. When the signals above flash, indicating that cross-border flow risk is materializing, it will be time to position defensively: short equities, long volatility, and short the US dollar.
The crisis is not a matter of "if," but "when" these structural flows begin to reverse. Awareness of this mechanism is the single greatest edge an investor can have today.

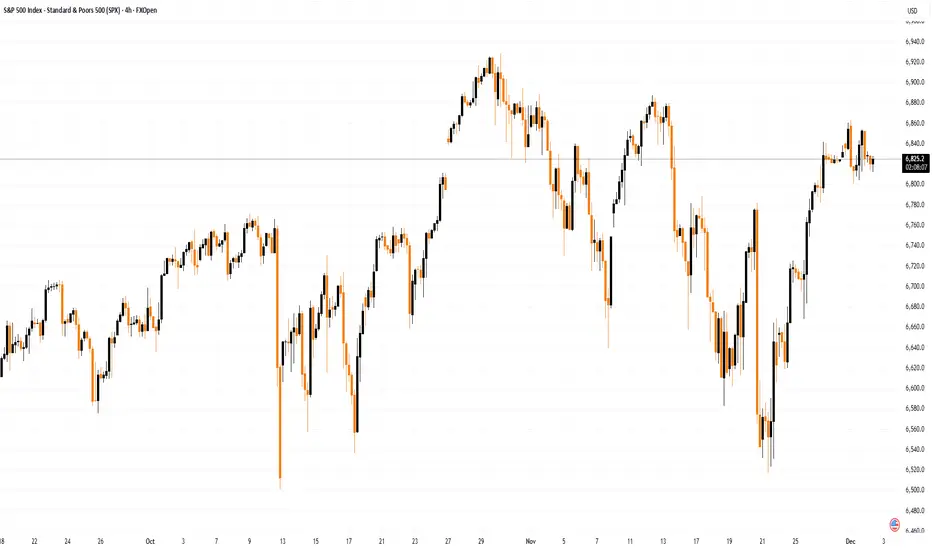
S&P 500 Index: Early December Chart AnalysisS&P 500 Index: Early December Chart Analysis
December is traditionally a favourable month for the S&P 500 :
→ Since the 1950s, December has ended higher in over 70% of years.
→ Average monthly gain is around +1.0%.
Will the index rise in 2025? Much depends on the Federal Reserve meeting on 10 December, as well as other factors, including geopolitical developments. Interest is also piqued by an upcoming statement from Trump at the White House (today, 22:00 GMT+3), though the topic remains undisclosed.
Technical Analysis of the S&P 500 Chart
Demand-side perspective:
→ The rebound from November’s low was aggressive, rising roughly +5% in 10 days.
→ Price climbed above the blue trendline that has acted as support since summer.
→ The recent dip (marked by the red trajectory) could be a temporary correction, forming a Bull Flag pattern.
Supply-side perspective:
→ The red trajectory has not yet been breached.
→ Recent price movements show a strong bearish Head and Shoulders pattern, along with signs of a Quasimodo formation, emerging around the attempt to break the upper boundary.
In the short term, the former resistance at 6785 may now act as support. Overall, the S&P 500 is likely to adopt a wait-and-see stance, adjusting as economic news, delayed by the government shutdown, is released.
This article represents the opinion of the Companies operating under the FXOpen brand only. It is not to be construed as an offer, solicitation, or recommendation with respect to products and services provided by the Companies operating under the FXOpen brand, nor is it to be considered financial advice.
Bulls Hang Tough - US Data and Holiday Trading Make or BreakThanksgiving week delivered a nice rally to help November finish higher than October
It's now December and we have a myriad of US News hitting the headlines before Christmas and New Year's bring us into 2026
ADP Non-Farm
US PMI
US Core PCE
Non-Farm
CPI / PPI
FOMC (December Rate Cut Likely)
Price action is truly key. November ended with a nice stable rally with broad market pumps encouraging an equal weight comeback trade for now (nearly 60% of S&P stocks > 50 period moving average, and 60% of S&P stocks > 200 period moving average)
If the markets avoid a major slip or disruption to end the year, animal spirits may remain optimistic enough to keep the party going in 2026 and continue to climb the wall of worry as sentiment remains pessimistic
US Market Key Levels
1) Oct 10 and Nov 20 candle lows
2) 200 period moving average
3) February 2025 all-time highs area
Sector rotation is pretty clear. Broader market rotation is pretty clear, but overall the markets need to continue to show stable and steady earnings growth and trends and keep the AI narrative glowing with a positive outlook

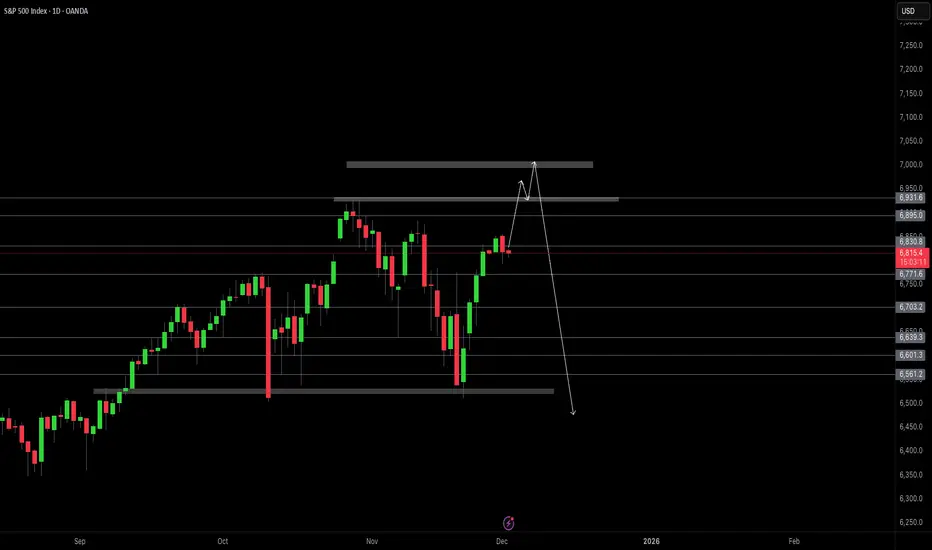
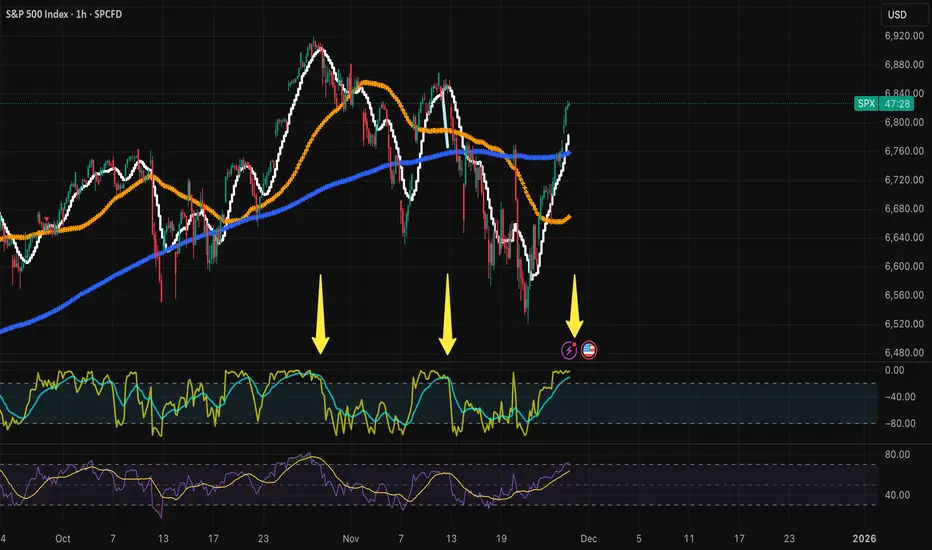
Hindenburg Omen Is Flashing AgainThe Hindenburg Omen has triggered, and it’s lining up with what the market breadth data has been whispering for months. If you look at the bottom pane, you’ll see the percentage of stocks above their major moving averages has been sliding for about six months.
So even though the index has kept pushing to new highs, fewer stocks are moving with it. A small group of mega-caps is doing all the heavy lifting, while the broader market slowly weakens underneath.
Historically, that’s exactly the kind of environment where the Hindenburg Omen becomes relevant. It doesn’t promise a crash, but it flags when internal conditions have deteriorated enough to allow one. Several past signals have occurred before meaningful corrections.
Why This Matters Now
The next couple of weeks are important. CPI, PPI and labour data between now and 10 December will shape expectations heading into the FOMC meeting. If the Fed changes tone on monetary policy, liquidity, or the path of rates, it will feed directly into sector rotation and capital flows.
That’s why I’m not committing to any major trades right now. The signals are mixed, breadth is weakening, leadership is narrow and policy risk is rising. Capital preservation comes first until we get a clear direction from the data and the Fed.
Sometimes the smartest move is patience. Let the data confirm the story. The market isn’t going anywhere.

$SPX Break Above Trendline, ATH ComingSPX came down earlier this Asian session, hit my algo bias zone low at 6794 and is now back to trendline resistance. Breaking above and holding above the trendline will bring us to new ATH and 6980.

S&P500 Next stop.. 6925The S&P500 index (SPX) is about to complete the Right Shoulder of the Inverse Head and Shoulders (IH&S) pattern that took it from the bottom of the 1D MA100 (green trend-line) contact to having recovered the 0.786 Fibonacci level of the whole correction.
The next technical Target is of course the 6925 All Time High (ATH). Since however we are about to form a 4H MA50/100 Bullish Cross, a technical pull-back is expected as both previous such crosses since August 13, resulted into a short-term Top.
If the IH&S completes its technical expansion, then after this correction, a test of the 2.0 Fibonacci extension at 7200 is possible.
---
** Please LIKE 👍, FOLLOW ✅, SHARE 🙌 and COMMENT ✍ if you enjoy this idea! Also share your ideas and charts in the comments section below! This is best way to keep it relevant, support us, keep the content here free and allow the idea to reach as many people as possible. **
---
💸💸💸💸💸💸
👇 👇 👇 👇 👇 👇

S&P500 crashes! Due relief rally or further pain?Nvidia delivered impressive earnings, but the stock reversed and closed nearly 3% lower, triggering heavy selling across tech and risk assets as odds for a December rate cut have collapsed to just 34%, with policy uncertainty amplified by the cancelled October NFP report. Despite a strong market and rising unemployment in September's NFP report, traders remained defensive and fuelled the declines.
Key drivers:
Nvidia beat earnings, but post-report selling intensified sector losses.
The Fed’s odds for a December rate cut have dropped to 34%, amplifying caution.
The abrupt cancellation of the October NFP means the market lacks fresh labour data, fuelling defensive positioning.
S&P 500, Nasdaq, and Bitcoin broke major supports, confirming risk-off conditions.
Right now, the S&P 500 has broken below channel support near 6,600 and failed to climb back in. If prices stay below this threshold, expect another sharp move lower targeting 6,500 and possibly 6,350. There’s potential for upside, given momentum divergence on the RSI 4-hour chart. If we see a short-term bounce and a return to the channel, a move toward 6,682 is possible, which sets up a tactical short opportunity.
Trade idea:
Entry: Midpoint of 23.6/38.2 Fibonacci (6,655–6,682 area)
Stop-loss: Above 61.8% Fib (6,775)
Take Profits: TP1 6,500 (recent low/support), TP2 6,440 (major support), TP3 trail stop to 6,170 (long-term support)
Risk-off drivers are in control. Earnings reversals, Fed uncertainty, and cancelled NFP data are fuelling this price action. Technically, it comes down to whether we see a return inside the channel for a relief bounce or a sharp continuation downward.
Watch your levels, remain nimble, and let fundamentals and technicals, not emotions, guide your trade.
Let me know your setups in the comments, and follow for more high-action technical and macro trade ideas.
This content is not directed to residents of the EU or UK. Any opinions, news, research, analyses, prices or other information contained on this website is provided as general market commentary and does not constitute investment advice. ThinkMarkets will not accept liability for any loss or damage including, without limitation, to any loss of profit which may arise directly or indirectly from use of or reliance on such information.

SPX500: Bullish Push to 6927?As the previous analysis worked exactly as predicted, FX:SPX500 is eyeing a bullish breakout on the 4-hour chart , with price rebounding from a key support zone near recent lows , converging with potential entry area that could ignite upside momentum if buyers defend against dips. This setup suggests a continuation opportunity amid the ongoing uptrend, targeting higher resistance levels with favorable risk-reward.🔥
Entry between 6700–6720 for a long position. Targets at 6880 (first), 6927 (second). Set a stop loss at a close below 6643 to limit exposure, yielding a risk-reward ratio of approximately 1:2 to first target and up to 1:2.5 overall. Monitor for confirmation via a bullish candle close above entry with rising volume, leveraging the index's resilience near ATH.🌟
Fundamentally , the S&P 500 is pushing toward new highs in November 2025, driven by bets on Fed rate cuts and strong global demand, though underlying issues like market concentration (top 10 companies over 40% of the index) and recent weekly dips (~2%) highlight volatility. Positive factors include liquidity, consumer strength, and earnings growth, with forecasts eyeing upside to 7000 amid election stability and AI investments. 💡
📝 Trade Setup
🎯 Entry (Long):
6700 – 6720
🎯 Targets:
• TP1: 6880
• TP2: 6927
❌ Stop Loss:
• Any 4H candle close below 6643
⚖️ Risk-to-Reward:
• ~1:2 to the first target
• Up to 1:2.5 if full target is hit
👇 Share your thoughts below! 👇

SPX - Hours Of Work To Buy 1 ShareHours of work needed to buy just one share of the S&P 500 just hit a new all-time high: 187 hours.
That’s:
150% more work than 2007
60% more than pre-COVID (2019)
10% more than “Liberation Day”
As I tell my kids:
Don’t look at the price tag.
Look at how many hours of your life — your blood, sweat, and effort — it takes to buy the thing.
Then decide if it’s actually worth it.
When the amount of work required keeps rising while what you get keeps shrinking, that’s not “innovation” or “AI magic.”
That’s over-speculation.
Buffett said it best:
Price is what you pay. VALUE is what you get.
Everyone screams about the price going up…
but nobody asks whether the VALUE justifies the hours of work required to own it.
That’s the truth — not the narratives.
THANK YOU for getting me to 5,000 followers! 🙏🔥
Let’s keep climbing.
If you enjoy the work:
👉 Boost
👉 Follow
👉 Drop a solid comment
Let’s push it to 6,000 and keep building a community grounded in truth, not hype.

SP500: Ready to Break Out and Forge New All-Time Highs S&P 500 indicates that the recent complex downward correction is complete, having bottomed at 6501.7.
The market is currently rallying and is testing the major upper trendline resistance. The analysis projects a minor, temporary pullback to gather momentum, potentially to the 6775.0 area. Following this consolidation, a decisive breakout above the trendline is anticipated. This will confirm the launch of a major new upward wave, expected to drive the S&P 500 to new all-time highs above 6928.
Stay Tuned :)
@Money_Dictators

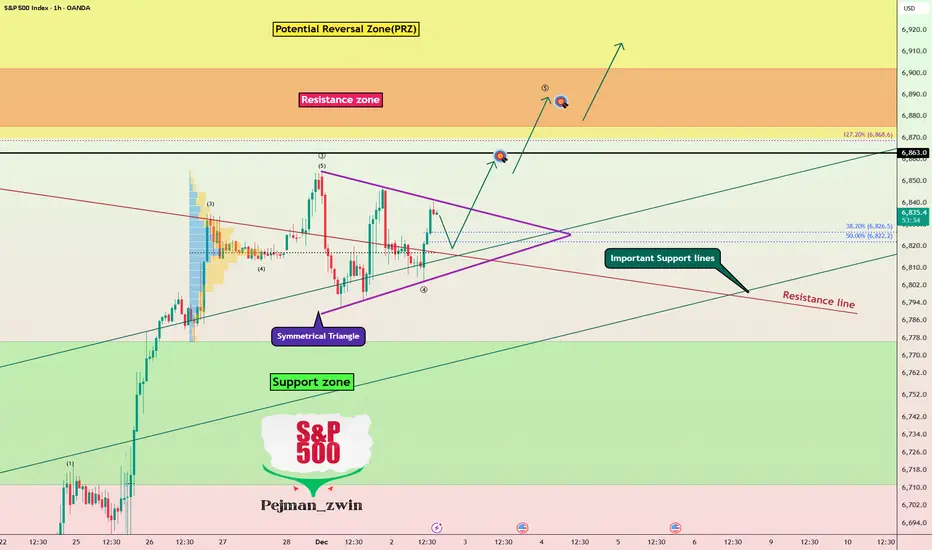
S&P 500 index Bull Run Continues — Symmetrical Triangle BreakoutThe S&P 500 index( SP:SPX ) has shown solid bullish momentum over the last 7 trading days, gaining more than +5% during this period.
The S&P 500 has once again moved back above Important Support lines, and it now appears to be breaking through a resistance line as well.
From a classical technical analysis perspective, the S&P 500 seems to be moving inside a symmetrical triangle pattern.
From an Elliott Wave standpoint, the S&P 500 looks to be completing Wave 4. A confirmed breakout above the upper line of the symmetrical triangle could validate the end of Wave 4.
I expect the S&P 500 to continue its upward movement and extend toward the Potential Reversal Zone(PRZ) and the Resistance zone ($6,902_$6,875).
What’s your view on the S&P 500 index and the broader U.S. stock market?
First Target: $6,859
Second Target: $6,887
Stop Los(SL): $6,774(Worst)
💡 Please respect each other's opinions and express agreement or disagreement politely.
📌S&P 500 Index Analyze (SPX500USD), 1-hour time frame.
🛑 Always set a Stop Loss(SL) for every position you open.
✅ This is just my idea; I’d love to see your thoughts too!
🔥 If you find it helpful, please BOOST this post and share it with your friends.
Bulls don't get too comfortable....fundamentals still not goodHave been tracking the swings recently and macros and it's worth noting that the fundamentals of the economy are still weak. The upcoming rate reduction is already priced in, and it won't change the employment / defaults / private credit environment and inflation. Expect a dip very very soon and red across the board. The economy is being propped up with hot air and it's just not sustainable. All the macros are screaming red and people are ignoring until it's too late.
#SQQQ could be an interesting hedge, but would pull out now from any long positions as the AI bubble is showing big cracks and people are deciding to look the other way until they get wiped out.
SPX: Investors bet on December's cutDuring Thanksgiving week, markets were in a positive, holiday mood, bringing US equities to higher grounds. The S&P 500 had a five-day positive streak, moving from 6.530 up to 6.850 points on Friday. The mood among investors has shifted again back toward a more risk-on stance, as the market is now about 80% confident that the Fed will cut interest rates at December FOMC meeting. Many stocks included in the index are now trading at new all time highest levels, some of which are General Motors, Hilton Worldwide, Walmart stores.
Tech companies also gained during the previous week, as confidence in AI was restored supported by some promising macro developments. Meta was one of the biggest winners, surging around 9% for the week. Microsoft was traded higher by more than 4%, however, Nvidia continues to lag in gains. Company shares continued to decline, losing around 2% on a weekly basis and highlighting uneven sentiment among the tech sector.
The week ahead brings PCE data for September. This indicator is the Fed's favourite inflation gauge, in which sense, Friday might bring some higher volatility. Nervousness will be increased, considering that these data will be taken into account by FOMC members when voting for a rate cut. On the opposite side, starting with the week ahead, we are entering into the last trading month of the year, when investors are seeking positive sentiment to book yearly profits.
