Trade ideas

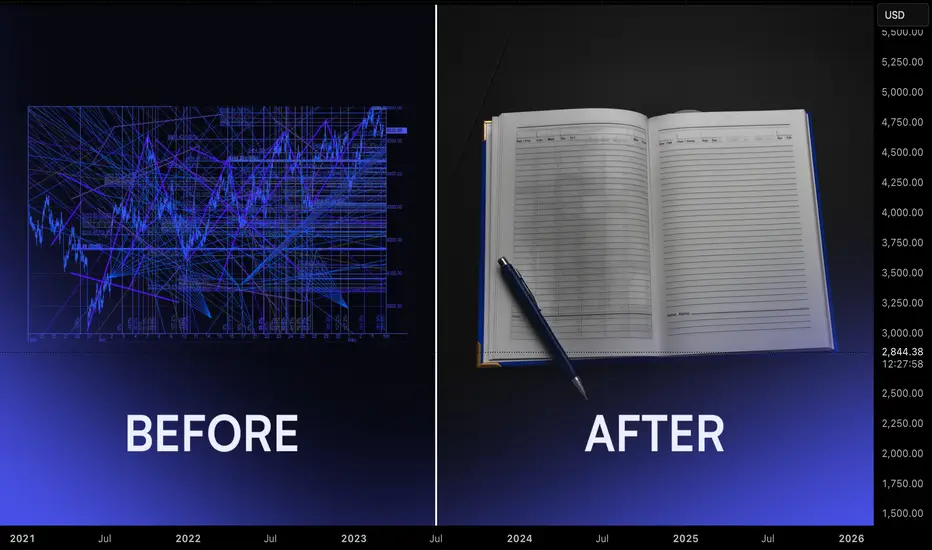
Journaling For Traders: Turning Random Results Into A Feedback Most traders spend years tweaking indicators and strategies while leaving their process undocumented. Without a journal, every trade feels new, every mistake repeats, and progress stays vague. A structured journal turns experience into data. It shows what you do well, what keeps failing, and which behaviours appear before your best and worst decisions.
The first step is simple: record every trade. Log the setup, market structure, entry reason, risk, and emotional state. Write whether you felt rushed, confident, bored, or frustrated. Do not only record wins or big losses. Incomplete data keeps blind spots alive.
The real value appears during weekly review. Set time aside after markets slow down and go through the trades as a batch. Look for recurring situations. You may notice that late-session entries perform poorly, that you increase size after wins, or that you cut trades early when size feels uncomfortable. These patterns are not visible inside a single session. They emerge only over a cluster of trades.
Next, extract insights. Group trades by setup, session, and emotional state. Identify your highest quality combinations. For example, trend continuation trades in London with fixed risk might show a strong performance profile while countertrend entries in low volume hours consistently underperform. This step separates what you think works from what actually delivers.
Finally, adjust strategy. Turn observations into rules. Reduce or remove the behaviours that repeatedly drain capital. Formalise the conditions that define your best trades. Add small process rules rather than full rewrites, then track the impact in the next review cycle. Over time, your playbook becomes evidence based rather than theoretical.
Journaling is not an extra task for perfectionists. It is the operating system behind professional execution. When you continuously record, review, extract, and adjust, your trading process compounds in quality even when individual weeks are difficult.
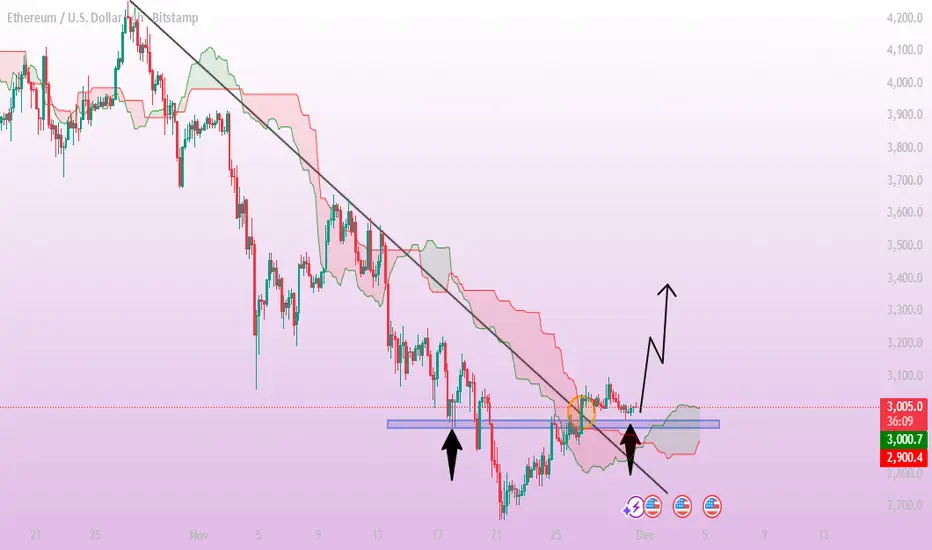
ETH/USD Long SetupThe Ethereum chart shows price moving above the downward trendline and stabilizing around a key zone marked on the chart. This area previously acted as an important level, and ETH is now holding above it, suggesting strength in the current structure. Price is also supported by the cloud, indicating a potential shift in momentum. If ETH continues to maintain stability above the highlighted zone, the next upward move may develop toward higher levels. Target 1 is 3,220, where the next significant price reaction is likely. If bullish momentum continues, Target 2 is 3,380, aligning with previous market structure and projected upward movement. Holding above 3,000 remains essential for confirming the upward outlook.
If you found this XAUUSD analysis helpful, don’t forget to LIKE 👍 and COMMENT 💬!
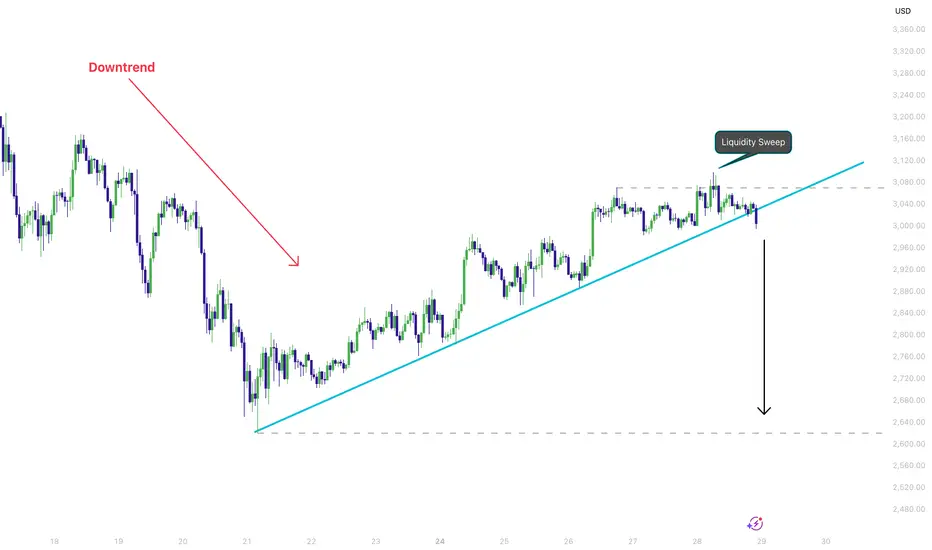
ETH Trendline Break After Liquidity Sweep – Watching 3080 → 2650ETH just broke beneath a clean ascending trendline that has held multiple reactions over the past several sessions. The most recent liquidity sweep around the 3080 level printed clear rejection, and the structure since that point has leaned progressively weaker.
With the trendline now broken, the chart opens room for ETH to revisit deeper inefficiencies, with the 2650 area standing out as the next major structural pocket. This aligns with the earlier 3080 sweep, which hinted at bearish intent before the break.
Key levels I’m watching:
• 3080 – prior liquidity sweep and rejection
• Trendline – now broken and potentially flipping into resistance
• 2600 zone – next major downside liquidity area
Not a trade signal, just sharing the technical structure I’m monitoring.
ETHUSD H1 | Bullish Bounce Off Key SupportMomentum: Bullish
Price is currently above the ichimoku cloud.
Buy entry: 2,867.08
- Pullback support
- 61.8% Fib retracement
- 100% Fib projection
Stop Loss: 2,777.16
- Overlap support
Take Profit: 2,972.69
- Swing high resistance
High Risk Investment Warning
Stratos Markets Limited (tradu.com/uk ), Stratos Europe Ltd (tradu.com/eu ):
CFDs are complex instruments and come with a high risk of losing money rapidly due to leverage. 70% of retail investor accounts lose money when trading CFDs with this provider. You should consider whether you understand how CFDs work and whether you can afford to take the high risk of losing your money.
Stratos Global LLC (tradu.com/en ): Losses can exceed deposits.
Please be advised that the information presented on TradingView is provided to Tradu (‘Company’, ‘we’) by a third-party provider (‘TFA Global Pte Ltd’). Please be reminded that you are solely responsible for the trading decisions on your account. Any information and/or content is intended entirely for research, educational and informational purposes only and does not constitute investment or consultation advice or investment strategy. The information is not tailored to the investment needs of any specific person and therefore does not involve a consideration of any of the investment objectives, financial situation or needs of any viewer that may receive it. Past performance is not a reliable indicator of future results. Actual results may differ materially from those anticipated in forward-looking or past performance statements. We assume no liability as to the accuracy or completeness of any of the information and/or content provided herein and the Company cannot be held responsible for any omission, mistake nor for any loss or damage including without limitation to any loss of profit which may arise from reliance on any information supplied by TFA Global Pte Ltd.

ETHUSDT SELL POSITIONEthereum is currently under strong selling pressure, and with the price hovering around $3,000, it could easily drop back below $2,600. However, for a more reliable entry, the 4-hour timeframe gap around $3,250–$3,350 offers a much better zone to look for a sell position.
If price reaches this area with a strong and impulsive move, there is a high probability (over 70%) that this sell setup will play out successfully. But if Ethereum approaches the $3,300 zone with weak momentum, the trade becomes a bit more risky, and the setup may require further confirmation before entering.

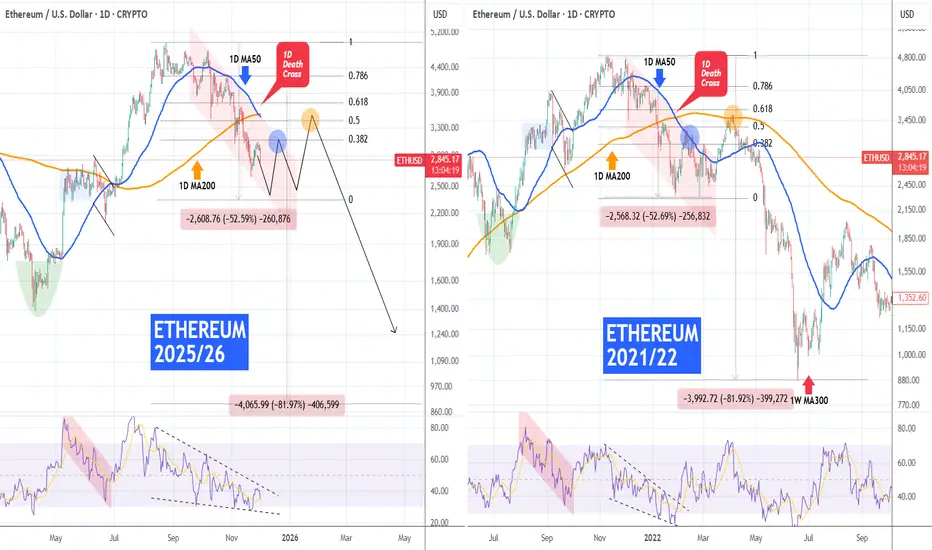
ETHEREUM made 1D Death Cross. Will it follow the 2022 BearCycle?Ethereum (ETHUSD) completed on Saturday its first 1D Death Cross in 9 months (since February 28 2025) and today the market is (so far) reacting violently to it with a strong sell-off.
The market didn't even manage to re-test its 1D MA50 (blue trend-line) on last week's rebound and if it follows the 2022 Bear Cycle, it may look for a bottom after completing a -52.50% decline from its Cycle Top. Technically, even the build up to the Cycle Top resembles the 2021/22 fractal and as you can see the similarities are even evident on their 1D RSI sequences.
As a result, if this 1st Bear Cycle wave for ETH bottoms around $2400, we could be expecting a first rebound to test the 1D MA50 (within the 0.382 - 0.5 Fibonacci range, i.e. around $3100) and get rejected, followed by one last to test the 1D MA200 (orange trend-line), within the 0.5 - 0.618 Fibonacci levels (i.e. above $3350) and get rejected to start the 2nd wave of the Bear Cycle.
Would you 'trust' this Bear Cycle build up?
---
** Please LIKE 👍, FOLLOW ✅, SHARE 🙌 and COMMENT ✍ if you enjoy this idea! Also share your ideas and charts in the comments section below! This is best way to keep it relevant, support us, keep the content here free and allow the idea to reach as many people as possible. **
---
💸💸💸💸💸💸
👇 👇 👇 👇 👇 👇
Everyone Gave Up on ETH – Perfect, Disbelief Phase ActivatedThe sentiment in crypto right now is as bad as—if not worse than—during the COVID crash or the FTX collapse. Anyone who was around back then remembers the “this is the end of crypto” vibes. It always feels apocalyptic in these moments, and this time is no exception.
Yet the fear index is hitting lows we haven’t seen since COVID… while Bitcoin is sitting between 80k and 100k. That combination is almost comical. History shows that when despair peaks like this, what feels like the end is usually just the beginning.
The chart above is a bar-pattern fractal on ETH I’ve been tracking privately for nearly a year. The moment I finally published it, price deviated hard—classic lol
Zooming in, here’s my current road map assuming we’re headed into a proper bull market in 2026:
- We just finished Wave 2
- Wave 3 (the longest and strongest) is starting now
→ Top around May 2026 at ~$11,000
→ Wave 4 retraces ~50% of Wave 3, retesting the previous ATH zone
→ Wave 5 takes us to $18,000–$25,000 sometime in Q4 2026 or early 2027
Invalidation level?
In the last two cycles, the real bear market began when price repeatedly rejected and failed to reclaim the 0.5 Fibonacci level. A clean break and hold above that zone has always kept the bull alive.
I’ve also been watching the Russell 2000 as a macro confirmation .
No breakout yet, but notice the deep pullbacks it always has right before the eventual clean break higher. We’re following the exact same script.
Conclusion
Technicals are still noisy and not fully confirmatory, but sentiment is screaming. Capitulation is extreme—90%+ of people have thrown in the towel. My inbox and comment sections are filled with “you’re insane” and “what are you smoking” messages. That level of universal bearishness, combined with the price action we’re seeing, is one of the strongest contrarian buy signals you can get.
When everyone is this convinced it’s over, going against the herd is usually the right play.

ETH Faces Heavy Rejection, Downside Risk IntensifiesETH printed a strong 4H bearish candle as soon as price retested the 3,030–3,100 supply zone, confirming that sellers still dominate this area. The sequence of lower highs remains intact, and the sharp break below 2,900 with increased volume signals a genuine sell-off rather than a routine shakeout.
Price is currently hovering around the 2,820–2,850 support, but buying interest is weak. The 2,750–2,780 pocket carries deeper liquidity and is a more realistic area for the market to stabilise if downward momentum continues.
Macro conditions also lean bearish: US yields are climbing, expectations for prolonged high rates from the Fed persist, regulatory pressure from the SEC remains, and whale flows to exchanges add further weight on crypto sentiment.
My view: ETH is more likely to slide toward 2,750–2,780 before any meaningful recovery. Only a 4H close above 3,030 would provide early signs of a short-term reversal.
ETHUSD Next Move Analysis
Price is trading inside an ascending channel, but momentum is weakening near the upper trendline.
Market recently rejected near the target zone (around 3260–3300), showing selling pressure.
A breakdown of the channel support can trigger a short opportunity.
Short Entry Idea
Entry: After price breaks below channel support
Target 1: Support zone around 3050–3000
Target 2: Deeper support around 2900
Bearish Confirmation
Rejection from the upper zone
Break of channel + retest
Weak bullish candles turning into bearish structure

Etherium is following the bear marketetherium couldn't push any further , that to low market cap and the following syndrome to bitcoin , overall market sentiment is bearish on the higher time frame . it's a set a forget

Ethereum Rejection at 50 EMA - Bears Take Control!ETH/USDT — Technical Analysis (1D Chart)
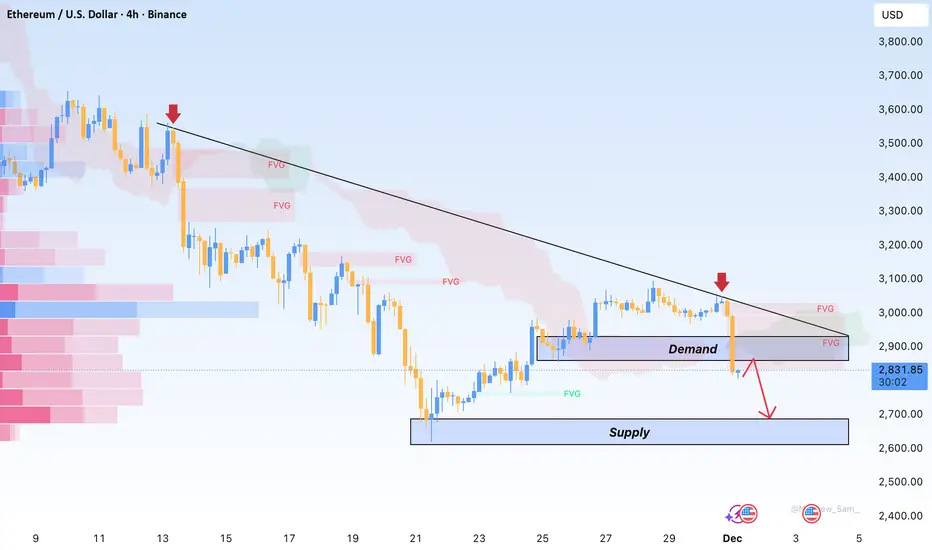
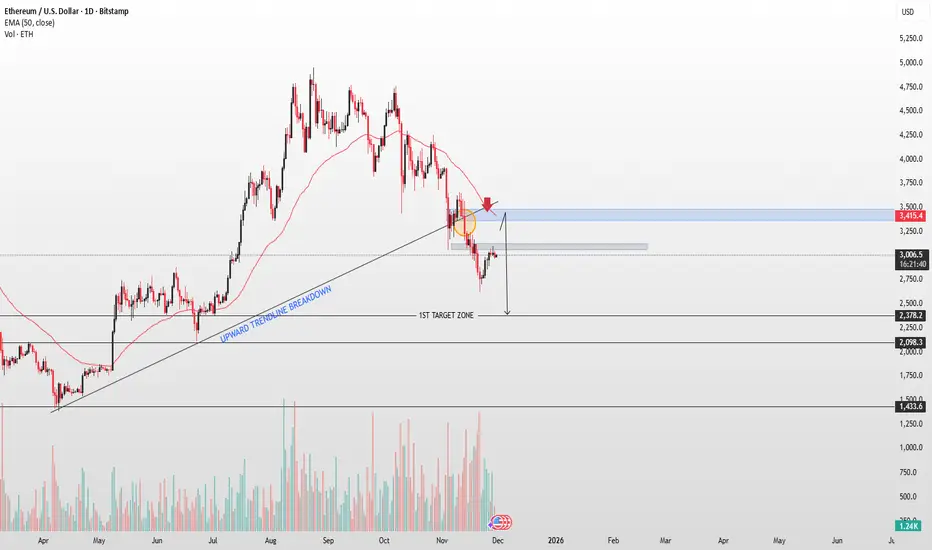
ETH is trading around $3,000 after breaking below its long-term upward trendline, showing a shift in market structure. Price attempted a retest of the broken trendline and the 50-day EMA ($3,415) but failed to reclaim it, forming rejection wicks in the highlighted zone a classic bearish retest.
Key Notes:
Structure: Lower highs and lower lows confirm a bearish continuation.
EMA: Price is trading below the 50-EMA, reinforcing downside pressure.
Resistance Zone: $3,250–$3,450 remains strong supply.
Immediate Bias: Bearish unless price closes above $3,450.
Downside Targets:
$2,750–$2,800 First demand area (marked 1st target zone)
$2,378 Major support
$2,098 Next swing-low support
A short-term relief bounce is possible, but the larger trend favours continuation lower unless ETH regains the broken trendline and EMA with conviction.
ETH/USD – Potential Bullish Reversal from Extreme POI.Analysis:
The chart suggests Ethereum is currently trading inside a strong Extreme Point of Interest (POI) after a series of Breaks of Structure (BOSS) to the downside. Price has entered a demand zone that may trigger a bullish reversal.
Key observations:
Downtrend Structure: Multiple BOSS confirmations show sustained bearish momentum leading into the Extreme POI.
Extreme POI (Demand Zone): Price is consolidating inside a deep demand area marked in red, indicating potential accumulation by buyers.
POI Reaction Expected: If price maintains support here, a bullish reversal is likely.
Fair Value Gaps (FVG):
Two major FVGs above act as logical bullish targets for price inefficiency fill.
Projected Price Path:
The drawn projection suggests:
Short-term bounce from POI
Breakout structure upward
Continuation toward higher FVG fills around $2,962, $3,130, and possibly $3,192 – $3,220.
Bias:
▶ Bullish, as long as price remains above the Extreme POI.
A breakdown below would invalidate the setup and continue the downtrend.
This is a strong smart-money style setup with a clean narrative:
Demand → Break of structure → FVG fill → Higher targets.

ETHUSD – Chart OutlookEthereum is maintaining a clear bullish structure, with price action continuing to form higher highs and higher lows. As long as the current upward momentum remains intact, the market favors continuation toward higher levels.
A potential long opportunity may develop from the 3000 zone, where buyers have shown strong interest previously.
If bullish momentum sustains from this area, the following upside targets can be monitored:
Target 1: 3080
Target 2: 3120
Target 3: 3170–3200 (extended bullish zone)
For risk management, a stop-loss around 2980 is suggested to protect against any downside invalidation.
This outlook is strictly based on market structure and momentum analysis. Always assess price behavior and manage risk according to your trading plan.

ETHUSD bullish reversal after a period of decline.That's an interesting setup for **ETH/USD**, suggesting a **bullish reversal** after a period of decline.
Based on the chart and the current market data I have (ETH is currently trading around **\$3,002.05** as of 10:50 UTC, November 29, 2025), here is the detailed analysis of the proposed long trade:
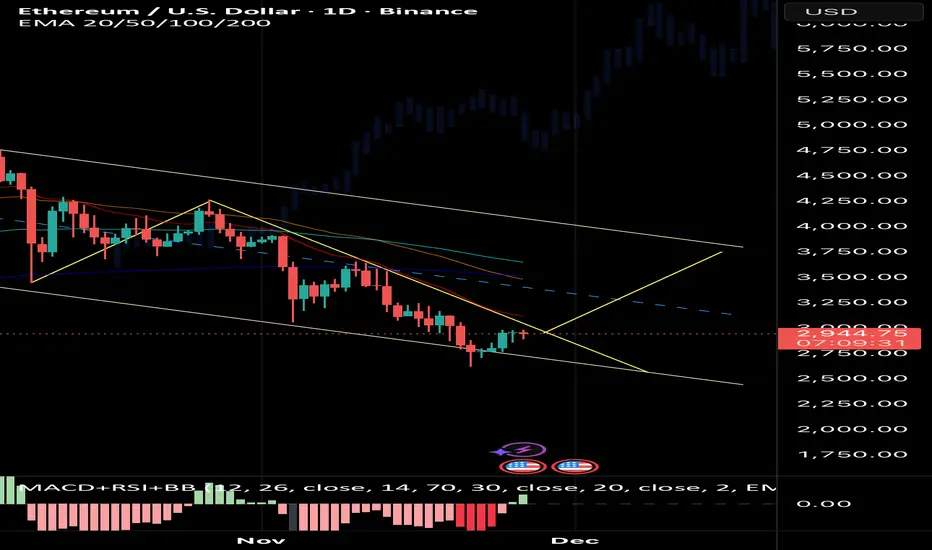
## 📈 Chart Analysis: ETH/USD * **Bearish Channel:** The price was clearly contained within a **descending parallel channel** (blue lines), confirming a strong downtrend over the recent period.
* **Key Breakout:** The most recent price action shows a significant **breakout above the upper trendline** of the descending channel, marked by the "BREAKOUT" annotation and the small red ellipse. This is a classic signal of a potential trend reversal.
* **Support/Accumulation Zone:** The red horizontal line around **\$2,989 - \$3,001** represents a critical level. The trade setup anticipates that this previous resistance/channel top will now act as **strong support** upon retesting.
* **Rising Support:** There is also a small, shorter-term rising trendline that forms a potential **ascending triangle** or rising structure near the breakout point.
## 🟢 Proposed Trade Setup (Long)
The chart suggests a **long (buy)** trade based on the breakout and a subsequent retest of the broken resistance level.
| Parameter | Value | Rationale |
| **Action** | **Buy / Long** | Trading the confirmed breakout from the descending channel. |
| **Entry Price** | **\~$3,001** (Purple Line) | Entering upon a successful retest and bounce off the former channel resistance/horizontal support. |
| **Stop Loss (Red Box)** | **\$2,775** | Placed below a recent swing low and the main support level, providing buffer against a false breakout (where price falls back into the channel). |
| **Take Profit (Green Box)** | **\$4,233** | A high-reward target based on projecting the potential move and targeting a previous major high/significant resistance level. |
| **Risk/Reward Ratio** | **Highly Favorable** (Visual Estimate) | The potential profit (distance to TP) is significantly larger than the potential loss (distance to SL), suggesting a very high Risk/Reward ratio.
## 🎯 Trade Execution Scenarios
1. **Ideal Entry:** Wait for the price to drop back slightly to **retest the breakout level** around **\$3,000** (the curved red arrow) and show signs of bouncing before entering the long position.
2. **Confirmation:** A strong rejection of the **\$2,900 - \$3,000** area would confirm the former resistance is now acting as support.
3. **Invalidation:** If the price drops below the stop-loss level of **\$2,775** and falls back deep into the descending channel, the bullish breakout is considered **invalidated**.
This setup aims to catch the start of a major bullish move fueled by the break of the dominant downtrend.
**Would you like me to find any recent news or analyst opinions on Ethereum that might support or contradict this bullish outlook?

VNShark OB | ETH — Sellers Take ControlETH is showing clear signs of institutional selling pressure.
Big Money has revealed its footprint after price broke below the VShark Order Block with strong volume — confirming that the higher-timeframe downtrend remains firmly intact.
Here’s the breakdown:
1️⃣ Higher-timeframe structure remains strongly bearish
ETH continues to follow the macro downtrend, with every rally failing to break key structure levels.
2️⃣ Price broke below the key VShark Order Block
This breakdown, combined with a notable volume spike, signals that buyers were overwhelmed — a classic displacement move driven by Smart Money.
3️⃣ A fresh VShark Sell Zone has formed above
This is the area where Big Money previously stepped in with visible selling pressure.
As long as ETH trades below this zone, sellers maintain full control.
🔵 VShark Sell Zone:
$2,965 – $3,108
4️⃣ Expectation: Bearish continuation
If ETH retests the Sell Zone and shows weakness or rejection, the downtrend is likely to resume.
#ETH #Ethereum #Crypto #SmartMoney #OrderBlock #OB #SupplyZone #VSharkOB #BigMoney #PriceAction #TechnicalAnalysis #CryptoTrading #Bearish #VolumeAnalysis

ETH to at least $3700 on breakoutThe measured move from the breakout of this triangle atleast takes us to 36-3700$. Will have to clear 3100$ first, if we reject here then this idea is voided.
ETH BULLISHPlease don’t judge the set up lol I’m still learning. I’d love some constructive criticism cause I know I got a rookie setup but I am bullish on ETH.

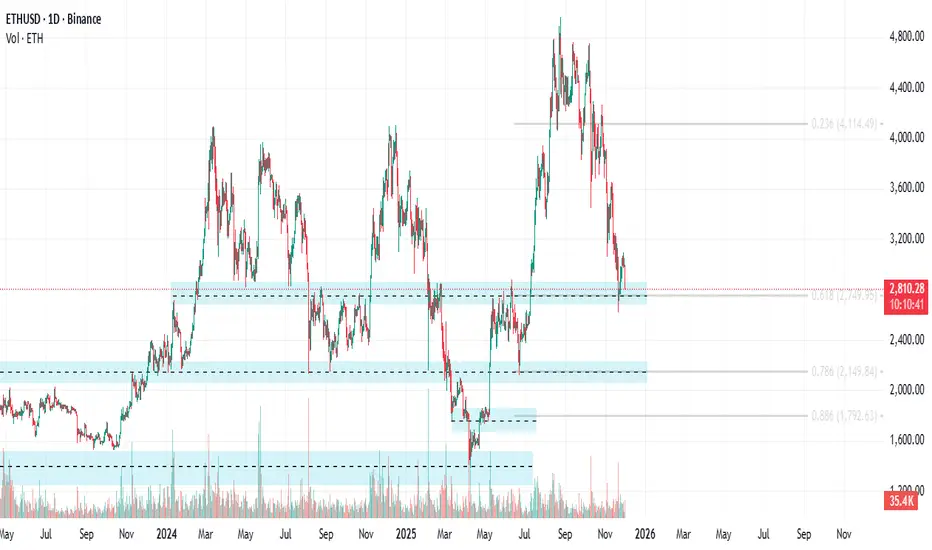
ETHSUD test area 0.618 fiboAfter breaking through resistance at $2750 in early July, Ethereum ( CRYPTOCAP:ETH ) is attempting to establish it as new support, which is also the 0.618 Fibonacci retracement area.
ETH UpdateNot buying this rally, I still see price reaching lower first. Too many stops sitting below just to overlook

Price break the resistance at 3050.00ETHUSD is looking like is about to change the character after a Bearish character week of sells, Buyers are looking to step up for long positions. Buy at 3,050.00 SL 2,990.67 TP at 3,230.00

Selena | ETHUSD 2H — Bullish Momentum Retest Setup |COINBASE:ETHUSD
After a strong sell-off, ETH formed a base around $2620 and reclaimed structure. The recent breakout and consolidation suggest accumulation before continuation. As long as price holds above $2940–$3000, bullish continuation remains favored toward the next supply zone
Key Scenarios
✅ Bullish Case 🚀
If price holds above $2940–$3000 support:
🎯 Target 1: $3200
🎯 Target 2: $3350–$3450 (major supply zone)
❌ Bearish Case 📉
A clean break below $2940 may invalidate the bullish structure and open deeper retracement.
Current Levels to Watch
Support Zone: $2940–$3000
Rising Channel Support
Liquidity Target: $3350–$3450
⚠️ Disclaimer: This analysis is for educational purposes only. Not financial advice.

$ETH - Under $1400 in 2026You may not believe this I don't either, but this is my Scenario number 1 right now.
