Gold idea Gold (XAU/USD) is respecting the rising support trend line and continues to push upward. Price is holding above 4215, showing bullish momentum. A breakout toward the resistance zone targets the 4300 level, where the next major reaction is expected.
Trade ideas

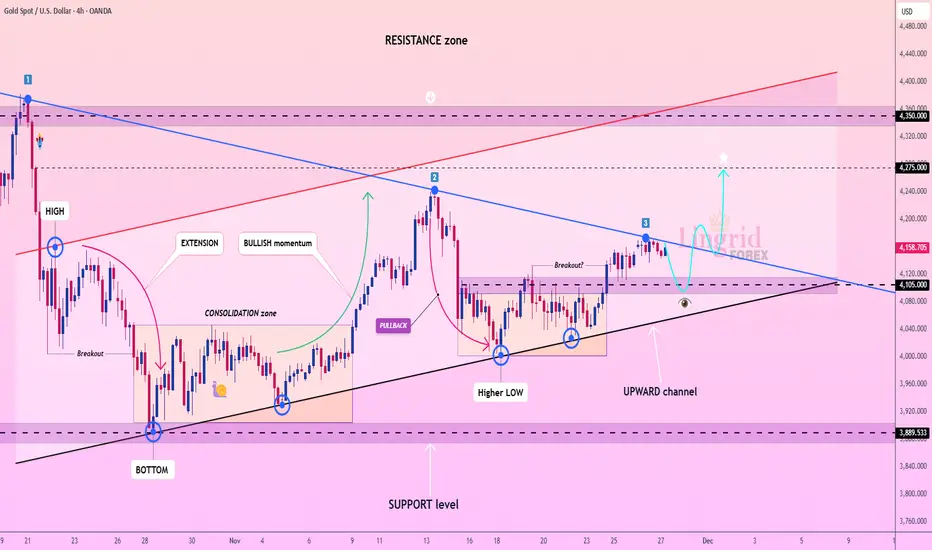
Lingrid | GOLD Trendline Break - Price AccelerationOANDA:XAUUSD is testing the downward trendline for the third touch, a historically significant point where price often attempts a breakout. The market structure has been steadily building higher lows from the 3,900 support level, while buyers continue to defend the bottom of the upward channel. Current consolidation just above 4,100 suggests accumulation rather than exhaustion, especially after price already produced a clean rebound from the channel floor.
If TVC:GOLD breaks and holds above major trendline, momentum may accelerate quickly toward 4,275, the mid-resistance barrier inside the broader supply zone. A successful continuation above this mark opens the way for a deeper squeeze, where major liquidity sits. With USD volatility cooling and safe-haven demand stabilizing, the bullish scenario remains favorable as long as price maintains bullish structure.
➡️ Primary scenario: breakout above trendline → continuation toward 4,275.
⚠️ Risk scenario: failure at trendline → drop back toward 4,000 support.
If this idea resonates with you or you have your own opinion, traders, hit the comments. I’m excited to read your thoughts!
Gold Buyers Regain Momentum — Aiming for 4,240 RetestHello traders! Let’s break down the current XAUUSD structure. Gold is trading within a broad ascending structure after forming a strong local bottom around the Support Line, where buyers entered the market and started to push the price higher. This upward movement follows a long corrective phase, during which the price respected the diagonal Support Line multiple times — confirming the presence of a stable bullish trend. Earlier, XAUUSD broke out of the Buyer Zone (4,110–4,120), retested it, and successfully held above it. This zone now acts as a key demand area and the primary level where buyers continue defending the trend. A previous bearish attempt failed here, forming a fake breakout and leading to a new bullish impulse. The price is now approaching the descending Resistance Line, which has repeatedly pushed gold lower during the recent correction. A clean breakout above this trendline may open the way for the price to move toward the major Resistance Level at 4,240.00, which also aligns with the first take-profit area (TP1). This Resistance Level has acted as a strong reaction zone multiple times, causing sharp pullbacks and marking the boundaries of the Seller Zone. Buyers will likely face significant opposition here once again. If gold respects the Buyer Zone and maintains trading above 4,110, the bullish scenario remains intact, and the price may push toward TP1 → 4,240. A confirmed breakout above this level would signal continuation toward higher targets within the broader bullish structure. However, if XAUUSD fails to hold the Buyer Zone and breaks below 4,110, the bullish outlook becomes invalid. In this case, the price may revisit the lower trendline or enter a deeper correction toward previous support areas. For now, the structure remains moderately bullish, with buyers dominating as long as the price stays above demand and respects the ascending Support Line. Please share this idea with your friends and click "Boost" 🚀

SMT secret smart money signal - All you need to knowHey whats up guys, in this post I want to show you how I use SMT divergence in my own trading to filter fake breaks and catch precise reversals. This is one of those things most traders never really dig into. Once you see it properly, you will not be able to unsee it.
It was popularized by ICT, but it is essentially Dow theory through a bit different perspective.
📌 What is SMT (Smart Money Tool )
It's a crack in correlation between two markets that normally move together.
One market takes the high or low. The correlated market does not. That difference is SMT divergence. And that why sometimes it's enough if only one instrument from those two highly correlated takes low and other doesn't.
Before SMT we need correlation.
Some markets like to move together. They will never be perfectly identical, especially on the lower timeframes, but the general swing structure is similar.
- EURUSD & GBPUSD
- AUDUSD $ NZDUSD
- XAUUSD & XAGUSD
- BTCUSD & ETHUSD
- NQ & ES & YM
You can find some more variations like EURJPY & GBPJPY etc.. But if you want to focus on precision your watchlist should contain just a few instruments. Not 20 unless you are position trader and your entry timeframe is Daily.
📌 Bearish SMT on positively correlated instrument's
One market makes a higher high. The other prints a lower high or equal highs.
📌 Bullish SMT. on positively correlated instrument's
One market makes a lower low. The other makes a higher low or equal low. 📌 Negative SMT Correlation
Its same only one pair is inverted which is DXY. We could say that in the Forex it would basically every currency with DXY. But No !!
‼️ Dont use DXY for correlation with AUDUSD and NZDUSD. Yes obviously they are affected by the DXY (Dollar) movement, but as these two are not included in the DXY. They are lagging. Yes at some point DXY affects them too, but just don't use them for the SMT. as SMT is like a quiet signal from smart money. One market shows the truth. The other is used as a trap. After this trap mostly sharp expansion happens. Its a signal for a timing that its ready.
📌 EURUSD and GBPUSD Example
GU - just shallow manipulation but creates clean OB
EU - Deeper manipulation but OB created later. ‼️ SMT is not a strategy
On its own that does not give you an edge. The key is what it says about the willingness of big players to push price. If DXY runs above a previous highs and EUR and GBP refuses to take out its opposite lows , that is lack of commitment to continue that move. Someone is offside. Dumb money sells late or buys late, smart money quietly positions on the other side.
📌 EURUSD and DXY Example
DXY makes higher high above monthly highs, EUR fails to take lows. Correlation disconnected. EUR is stronger and if its within CLS range reversal can occur. what does GBP at the same moment? also failed to make a lower low hence is stronger than USD. If it aligns with the strategy reversal is confirmed.
📌 This is how I traded this setup below.👇 Click to the chart to see how it played out 📌 SMT is a way to read who is actually in control. It helps me see if a break of structure is real continuation or just a liquidity raid dressed as a breakout.
📌 Where to use it for efficiency
You can find small SMT differences all day on lower timeframes. Try to trade every one and you will bleed slowly. I care about SMT only at important areas.
- CLS ranges - Weekly , Monthly , Daily
- Previous week low, previous week high, clear swing extremes.
- Key levels from my higher timeframe analysis
- HTF Fair value gaps and order blocks that fit my narrative.
📌 XAU & XAG Example
Both in the uptrend and created nice CLS range. Gold made a just shallow manipulation but is it enough ? Let's have a look to the silver we can see that silver made much deeper manipulation so it can confirm our Gold trade. Also notice that how exactly after the temporary correlation disconnection the expansion move started. These disconnections are trap and mostly followed by strong expansion move. 📌 Here is the setup I posted here and traded 👇 📌 Which pair I choose to trade
When I see SMT between two correlated markets, I decide which one I want to use.
The weaker market is the one that takes the high or low and disrespects the level. That is where late traders are stuck. This market has advantage for tight stop just beyond the stop hunt.
⁉️So which one would you chose on the SMT signal bellow the range ?https://www.tradingview.com/x/8pWYJbLP/ let me know in the comments.
The stronger market is the one that respects the level and refuses to sweep the extreme and you need to have conviction in the HTF trend so you can confidently place SL below un-manipulated lows. This one usually respects fair value gaps and order blocks better and often gives cleaner candles and stronger pushes.
📌 SMT Fills
Two correlated markets are moving together. One fills its fair value gap, the other leaves a part of it open. That difference can give you an extra reason for a reaction. It is like one chart did the work of cleaning up inefficiency, the other did not, and price tends to respect the one that is cleaner.
📌 BTC & ETH Timing and Gap fills
We can see SMT on the top where BTC made higher highs but ETH failed to do so = crack in correlation. Now focus on ETH it has created on Order block which signaled reversal, while BTC didnt had it yet = Your advantage seeing what is not seen yet.
📌 GAP fills
Look at the FVG on the BTC it was not filled fully and BTC made higher high, while ETH filled gap full and made lower low. Also BTC gave you Order block while ETH not yet again you have
📌 The SMT trap and how I avoid it
A lot of traders get hurt by SMT because they treat it like a magic reversal button.
They see euro taking a low and dollar failing to take a high, or Bitcoin taking a high and Ethereum failing to match it, and they jump in without any extra confirmation. Sometimes it works. Many times price just keeps pushing, prints another leg, and wipes them out.
Use it only at specific levels to confirm your strategy and give you extra edge in seeing confirmation on highly corelated pairs before it plays out.
SMT alone never gives me permission to trade. I want at least one strong confirmation candle at my level and, for bigger trades, a clear Change in order flow.
Adapt useful, reject useless.
David Perk - Aka Dave FX Hunter

Gold Slows at Channel Top — Market Targets 4,150 Before Move UpHello traders! Here’s my technical outlook on XAU/USD based on the current market structure. After breaking out of the broader consolidation phase, gold continued to move within a rising channel, forming consistent higher highs and higher lows along the Support Line. Buyers maintained strong momentum as the price pushed toward the Resistance Line, which aligns with the major Resistance Level near 4,240. However, after reaching this upper boundary, the market showed clear signs of exhaustion, indicating that buyers are struggling to push further into the resistance zone. This reaction suggests that the price may soon initiate a corrective move. At the moment, XAU/USD is trading inside a narrowing rising structure, with the Support and Resistance Lines converging, creating compression. As long as the price holds above the local Support Level around 4,150, the bullish structure remains intact. A pullback from the Resistance Line toward this area is the most likely short-term scenario before buyers attempt another push. This zone aligns with the first target TP1, which also acts as a key reaction zone from previous price behavior. A successful rebound from support could allow bulls to regain strength and attempt another test of the 4,240 resistance. If a breakout occurs, it would open the door for further bullish continuation. However, if the price fails to hold the Support Line or breaks back below the 4,150 zone, the structure may shift to a deeper correction, exposing gold to lower support areas. Please share this idea with your friends and click Boost 🚀

Lingrid | GOLD Weekly Analysis: Breakout Confirmed, What’s Next?OANDA:XAUUSD concluded a week by breaking above the key levels and reclaiming the $4,200, signaling a continuation of bullish momentum after a period of compression. This breakout from the consolidation pattern suggests that buyers have regained control and are pushing price toward the November high. The 4H chart shows a clear higher low formation, which is a classic sign of underlying strength in an uptrend. However, this victory is not yet complete; it is now entering a critical phase where it must prove its strength by holding above the broken levels and overcoming the formidable resistance area above.
TVC:GOLD has broken out of a triangle pattern, which is trend continuation pattern. Historically, such patterns lead to a measured move upward, targeting the height of the triangle’s base added to the breakout point. While this offers a bullish target near $4,330, a potential pullback from point C might occur before the final leg higher. This pullback scenario is common and should be viewed as a buying opportunity rather than a reversal signal. The monthly chart confirms the broader bullish bias, with price trading well above the monthly low and approaching the October high, a key psychological and technical hurdle that will require strong conviction to overcome.
Looking ahead, the path forward is not guaranteed. The immediate support is now around $4,160, which must hold firm to validate the breakout. A failure to hold this level could lead to a retest of the $4,100 range, potentially triggering a deeper correction. Additionally, next week’s high-impact economic data such Non-Farm Employment Change, Core PCE, and Unemployment Claims—will be pivotal. Strong US data could pressure gold by strengthening the dollar, while weaker-than-expected numbers could fuel the rally. For now, the bias is bullish, but caution is warranted as the market approaches next major test.
If this idea resonates with you or you have your own opinion, traders, hit the comments. I’m excited to read your thoughts!

Gold H1 – Will 4278–4280 Trigger a Drop Into 4170 Today?🟡 XAUUSD – Intraday Smart Money Plan | by Ryan_TitanTrader (01/12)
📈 Market Context
Gold continues its impressive rally as markets price in a potential rate cut by the Federal Reserve (Fed) in December. Spot gold recently surged past $4,230/oz — hitting a multi-week high — as the US Dollar Index (DXY) weakened.
The backdrop is increasingly dovish: fading USD strength, soft U.S. macro data, and dovish comments from Fed officials have fueled speculative buying in gold.
Technically, gold remains elevated, hovering inside a rising channel — similar to what’s shown on your chart. Price compression following strong displacement suggests a consolidation before the next institutional move.
🔎 Technical Framework – Smart Money Structure (H1)
Current state = Accumulation / Distribution within rising channel
Liquidity zones & key triggers
• Premium liquidity zone (sell-opportunity): ~ 4278–4280 (near upper channel resistance) — aligns with your SELL zone.
• Discount liquidity zone (buy-origin / re-entry zone): ~ 4172–4170 (near lower channel support / trendline) — aligns with your BUY zone.
• Equilibrium / chop zone: mid-channel / recent consolidation zone — avoid trading blindly here unless structure breaks.
Expected Smart Money sequence
Sweep → CHoCH/MSS → BOS → Displacement → Retest (FVG/OB) → Expansion
Given the macro tailwinds (weak USD, rate-cut odds), gold remains primed for a directional move once structure confirms.
🎯 Trade Plans for Today
🔴 SELL GOLD 4278 – 4280 | SL 4288
• Thesis: A liquidity sweep at channel top / premium zone followed by engineered bearish displacement — capturing liquidity before a reversal.
• Entry rules (must wait for confirmation):
• Price touches 4280 zone
• Bearish CHoCH / MSS + BOS down on M5–M15
• Entry ideally on FVG fill or after order-block retest post-BOS
• Targets:
1. 4245 – 4240 area (first reaction)
2. 4225 – 4215 (mid-channel retest)
3. 4175 – 4172 (lower channel + buy zone)
🟢 BUY GOLD 4172 – 4170 | SL 4162
• Thesis: Discount-origin tap near lower channel support / trendline — smart money likely to accumulate for next leg up, especially amid dovish Fed sentiment.
• Entry rules (must wait for confirmation):
• Price dips into 4170 zone
• Bullish CHoCH / MSS + BOS up on M5–M15
• Strong bullish wick + FVG fill or OB retest confirmation
• Targets:
1. 4225 – 4230 (first reaction / mid-channel)
2. 4255 – 4265 (upper mid-channel)
3. 4278 – 4280+ (premium liquidity retest)
⚠️ Risk Management & Notes
• Avoid trading inside the mid-channel chop zone without structural confirmation — no “blind” entries.
• Do not treat sweeps (top or bottom) as trend entries — these are often traps.
• Use tight SL (structure invalidation), avoid averaging in consolidation.
• Given potential volatility from macro headlines or a USD bounce, consider reducing lot size.
Summary
Gold is currently riding macro tailwinds — weak USD + Fed rate-cut odds — but from a technical perspective, it’s compressed inside a rising channel. The day’s price action may be a classic Smart Money liquidity hunt: either a sweep at 4278–4280 leading to a sharp drop toward 4170, or a retracement to 4170 that sets up a fresh bull leg.
Only trade after structural confirmation (CHoCH / BOS + retest) — avoid “trend-hop” entries.
📍 Follow @Ryan_TitanTrader for daily Smart Money updates.

Gold 30-Min — Volume Sell Reversal Triggered⚡Base : Hanzo Trading Alpha Algorithm
The algorithm calculates volatility displacement vs liquidity recovery, identifying where probability meets imbalance.
It trades only where precision, volume, and manipulation intersect —only logic.
✈️ Technical Reasons
/ Direction — SHORT / Reversal 4191 Area
☄️Bearish rejection confirmed through sharp candle body.
☄️Lower-high forming beneath resistance supply region.
☄️Volume decreasing confirms exhaustion in price rally.
☄️Sellers regained imbalance with heavy top rejection.
☄️Algorithm detects fading demand and shift to control.
⚙️ Hanzo Alpha Trading Protocol
The Alpha Candle defines the day’s real control zone — the first battle of momentum.
From this origin, the Volume Window reveals where the next precision strike begins.
⚙️ Hanzo Volume Window / Map
Window tracked from 10:30 — mapping true market behavior.
POC alignment exposes institutional bias and breakout potential zones.
⚙️ Hanzo Delta Window / Pulse
Delta window monitors real buying vs. selling power behind each move.
Tracks volume aggression to expose who controls the candle — buyers or sellers.
When Delta aligns with Volume Map, momentum becomes undeniable.

Gold - This is the bullrun top!⚰️Gold ( OANDA:XAUUSD ) is slowly reversing now:
🔎Analysis summary:
Starting back in the end of 2015, Gold established another major bullish cycle. Ever since the rounding bottom breakout, Gold has been rallying higher and higher. But at this exact moment, Gold retests major resistance and is slowly starting to create a reversal.
📝Levels to watch:
$4,000
SwingTraderPhil
SwingTrading.Simplified. | Investing.Simplified. | #LONGTERMVISION

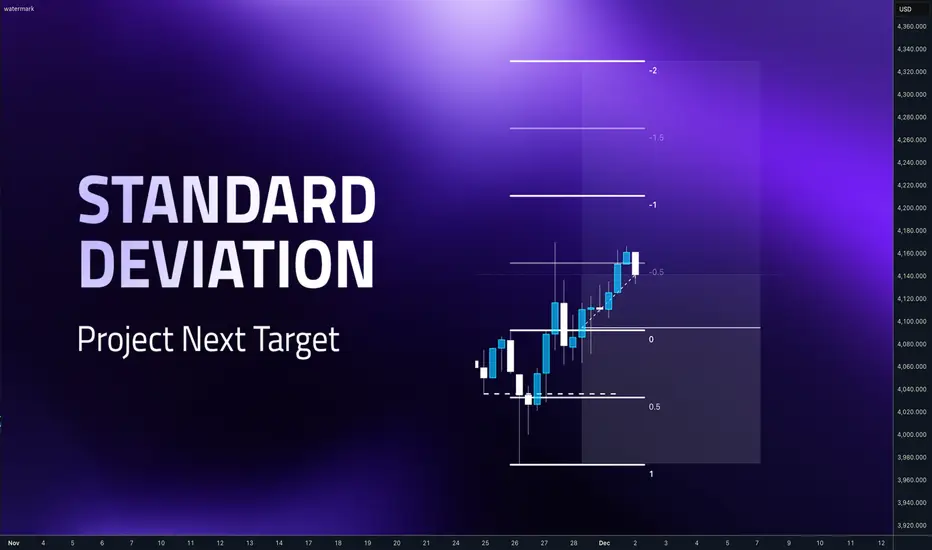
Standard Deviations - How to be exit before the pullbackHey whats up guys, in this post Ill show you easy method which can help you to set your targets, stay in the positions, prevent cutting position too early or hold for too long. You will basically have more objectives to stay in trade and give it a frame to which key levels you should use. Standard deviations are projection deviations of the manipulation leg. Which is the price swing that sweeps liquidity and then changes the order flow. In simple words, it is the move that takes out stops and then flips the structure - Order block.
📌 Fibonacci tool settings
We will be measuring deviations from the order block and here is the Fibonnaci settings
0 - 1 is where you measure the manipulation leg and then you got your projections.
Zone between 2 - 2.5 is my main focus for taking partials of full profits Price obviously can go further but between 2 - 2.5 is where I tend to take something of the table. Because my longterm statistics says most of my trades has 2.3 RR. 📌 What to do at 2- 2.5
Obviously don't start doing what Im saying here on your next trade. First test it and if you find it useful, never put any idea from someone from the internet to your money without verifying by yourself then add it to your arsenal or reject it. If your strategy has fixed TP based on structure stick with it. Standard deviations can be just a little helper. Let's look at few examples.
1️⃣ Example: GBPUSD
This is the example which has Benn posted here on TV And as you can see it has made some gain, didn't hit full TP and reversed, back to the entry. But look where it reversed - Exactly at the 2 - 2.5 I saw it has my average profit and it was Friday so I closed it . as we can see it was a good decision to close position fully here and not sticking to to the full target. Im not saying that closing trader before the initial target is good decision, but considering that its Friday and I got my average 2.3 gains. Its a no brainer to take what the market offers to me. 2️⃣ Example: EURUSD
My strategy is has two defined targets. 50% of the range and full range. After taking 50% partial at 50% I should be targeting opposing range low after the sweep of the liquidity highs. So I should hold the trade until the target. But as it was a Friday and price been between 2 - 2.5 means my trade was around 2.3 RR in profit, which is my average reward so I decided to close it completely and as we can see it was a good decision as the price just completely reversed before hitting my target. 3️⃣ Example: XAUUSD
This is model 2 entry on Weekly range and Model 1 on Daily CLS range. Let's not overcomplicate. Look at the order block our initial point for the measuring our target and check where is the 2 Std. Projecting 2 St.D gave me confidence that CLS highs could be reached easily as it all was aligned with HTF trend so I held the trade for the whole week. Exited little bit bellow, but as it was reaction on LTF OB and Friday, I didnt want to hold in the trade over the weekend. 4️⃣ Example :EURUSD
Another EURUSD trade example after sweeping a low and creating order block We can that 2 STD aligns with CLS highs so its perfect target and we can see sharp expansion to the 2 St. D then price started retracing and consolidating, If we targeting bigger targets we would be for 2 days in this choppy range now. 📌This tool is not a strategy it self its just something what can help us to set reasonable targets while we don't have to face big pullbacks. Im not saying you should go only for 2.3 RR as I do. If you can hold traders for 3RR and more you are great trader.
📌However I found that when Im targeting 3R and more, I must face pullback and watch how my gains go back to the markets which I dont like. Im still human and have emotions and you know how it feels when you have a great trade developing and then in a blink of the eye its back on your entry.
📌Also by targeting just 2.3 RR is a clean shot and I realized that I can increase my risk per trade for such setups because they are hitting TP more often than 3RR trades. So in the end it's less stress and better profits. But it's all about a personal preferences.
Let me know what is your average RR and reason you targeting it.
David Perk aka Dave Fx Hunter
XAUUSDHello Traders! 👋
What are your thoughts on GOLD?
Gold is once again moving toward its previous all-time high after completing a corrective move.
While the medium-term and long-term outlook remains bullish, we do not expect gold to break into new highs in the short term.
The current upward movement appears to be a corrective rally, and we anticipate a bearish reaction from the marked resistance zones.
Gold is currently moving within a channel, and the maximum upside expectation in this phase is a move toward the channel top, which also aligns with the previous all-time high resistance zone.
From this confluence area, we expect the rally to stall and a pullback toward lower support levels to begin.
If gold breaks above the channel top and prints a new all-time high, this analysis becomes invalid, signaling stronger bullish momentum than anticipated.
Don’t forget to like and share your thoughts in the comments! ❤️

Gold Ready for a Breakout – Watch This Zone!Gold is currently trading inside a well-defined symmetrical triangle, developing multiple BOS and CHoCH signals that indicate growing bullish momentum. After rejecting the lower trendline, price is now approaching a potential breakout zone.
A retest of the triangle’s upper boundary could trigger a clean bullish continuation toward the 4,248 level, which aligns with previous structural highs.
Keep an eye on the retest and confirmation candle before entering.
Bias: Bullish above structure / Neutral inside the triangle

GOLD 1H CHART ROUTE MAP UPDATE & TRADING PLAN FOR THE WEEKHey Everyone,
Please see our 1h chart levels and targets for the coming week, which is still active and in play.
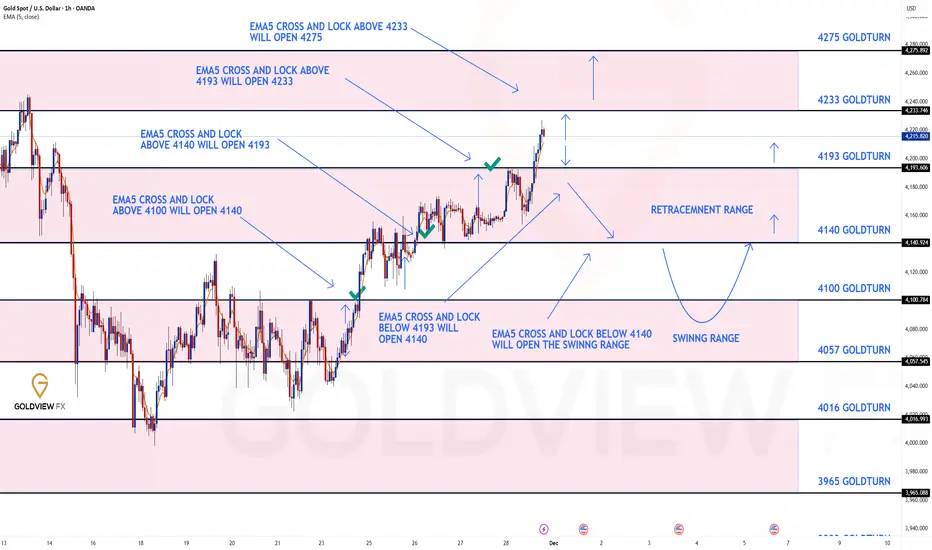
We are seeing price play between two weighted levels with a gap above at 4233 which is locked and a gap below at 4193 as support. We will need to see ema5 cross and lock on either weighted level to determine the next range.
We will see levels tested side by side until one of the weighted levels break and lock to confirm direction for the next range.
We will keep the above in mind when taking buys from dips. Our updated levels and weighted levels will allow us to track the movement down and then catch bounces up.
We will continue to buy dips using our support levels taking 20 to 40 pips. As stated before each of our level structures give 20 to 40 pip bounces, which is enough for a nice entry and exit. If you back test the levels we shared every week for the past 24 months, you can see how effectively they were used to trade with or against short/mid term swings and trends.
The swing range give bigger bounces then our weighted levels that's the difference between weighted levels and swing ranges.
BULLISH TARGET
4233
EMA5 CROSS AND LOCK ABOVE 4233 WILL OPEN THE FOLLOWING BULLISH TARGETS
4275
BEARISH TARGETS
4193
EMA5 CROSS AND LOCK BELOW 4193 WILL OPEN THE FOLLOWING BEARISH TARGET
4140
EMA5 CROSS AND LOCK BELOW 4140 WILL OPEN THE SWING RANGE
4100
4057
As always, we will keep you all updated with regular updates throughout the week and how we manage the active ideas and setups. Thank you all for your likes, comments and follows, we really appreciate it!
Mr Gold
GoldViewFX
GOLD → Distribution phase. Focus on 4150...FX:XAUUSD is trading at a one-and-a-half-week high, supported by a weaker dollar and growing expectations of Fed policy easing. More news ahead...
US PPI inflation showed signs of slowing (2.7% y/y). Retail sales and consumer confidence were weaker than expected. The probability of a Fed rate cut in December rose to 85%. Fed members (Williams, Waller, Miran) supported the possibility of easing
However, progress in Russia-Ukraine negotiations is limiting growth
Today, attention is focused on data on jobless claims and durable goods orders
The combination of soft monetary policy, geopolitical risks, and structural demand from the Central Bank creates a favorable backdrop.
Resistance levels: 4156, 4211
Support levels: 4146, 4111
Gold continues to recover after breaking out of consolidation and holding above 4110. Focus on the next trading range (consolidation) of 4156 - 4111. If the bulls keep the price above 4146 - 4156, the next target could be 4211 - 4245.
Best regards, R. Linda!

XAU/USD | Another Bullish Leg Possible! (READ THE CAPTION)By analyzing the #Gold chart on the 4 hour timeframe, we can see that price made a strong bullish jump today, pushing all the way up to $4264 before showing signs of exhaustion and pulling back. This reaction is typical after such an aggressive move, especially when price taps into short-term liquidity pockets and meets intraday supply zones.
Right now, TVC:GOLD is trading around $4228, which keeps the overall bullish structure intact. The key level to watch remains $4187, as long as price holds above this zone and doesn’t break it with a strong 4H candle close, the bullish scenario stays valid. This level is acting as both structural support and a demand area from the last impulsive move, so buyers will likely attempt to defend it.
As long as we stay above that support, we can expect the market to build another wave of bullish momentum. The next upside targets remain the same, with potential reaction zones at:
• $4240
• $4250
• $4260
• $4272
Each of these levels represents short-term liquidity pockets and minor supply areas where price may pause, react, or give another continuation setup. If bullish pressure stays strong, TVC:GOLD can attempt another push into the upper range after clearing intraday resistance levels.
Overall, the trend is still bullish as long as $4187 holds, and higher targets remain in play unless we see a deeper breakdown or a sharp shift in momentum.
Please support me with your likes and comments to motivate me to share more analysis with you and share your opinion about the possible trend of this chart with me !
Best Regards , Arman Shaban

THE KOG REPORTTHE KOG REPORT:
In last week’s KOG Report we said we would be looking either price to push up into our red box and give us a short, or, price to attempt that 4040 level and bounce, giving us the opportunity to go long. We got in on that long, and then just carried it for most of the week, resulting in not many updates apart from the continued path and a successful week to close.
It was a bit nervy with the ranging, but our hot spots worked well, gave us added confidence and of course the algo performed exceptionally.
A fantastic week in Camelot, not only on Gold but the numerous other pairs we trade and analyse.
So, what can we expect in the week ahead?
Key levels here for the open are 4228 resistance and 4210 support. These are the levels that need to be monitored on the 15min red boxes for the break. A break above and we should see that high on the chart completed and potential for bears to come in and attempt the correction. While that flip is still active, above 4210 there is more upside to be had but the level sticking out to us this week is the 4260-70 region. This is the level that needs to break open and hold for us to go higher.
The issue I have at the moment is our liquidity indicators are suggesting a higher high but once that is made, there is a chance we get a sharp reversal and a clean rejection from one of these resistance levels can lead to a very aggressive decline all the way back down into the low 4000’s again. It’s a new day of a new month so caution is needed, the market may open with gaps, if that’s the case, best not to chase them, let it settle and then look for the set up.
RED BOXES:
Break above 4230 for 4237, 4247, 4250 and 4260 in extension of the move
Break below 4210 for 4199, 4195 and 4165 in extension of the move
Please do support us by hitting the like button, leaving a comment, and giving us a follow. We’ve been doing this for a long time now providing traders with in-depth free analysis on Gold, so your likes and comments are very much appreciated.
As always, trade safe.
KOG

XAUUSD: Gold Continues to Rise on Rate Cut ExpectationsGold continues its upward trend from yesterday, with the current price at 4,159.455 USD. The chart shows that gold is moving within a stable upward channel, and if it maintains above this support level, there is a high likelihood that the price will continue towards the 4,190,000 USD level.
Why is gold continuing to rise?
Weaker-than-expected U.S. retail sales data has reinforced the forecast that the U.S. Federal Reserve (Fed) will cut interest rates in December 2025. This has weakened the USD, which in turn reduces yields and increases gold's appeal as a safe-haven asset. These factors, combined with expectations of rate cuts, suggest that gold has the potential to continue rising sharply.
Next Scenario:
If the price of gold stays above the 4,120,000 USD support zone, there is a high probability it will break through the 4,190,000 USD resistance level. The potential for continued upward movement could push gold to 4,230,000 USD in the near future.
With strong support and a favorable market backdrop, XAUUSD is likely to continue this upward trend, especially as labor market data from the U.S. is released.

XAUUSDHello Traders! 👋
What are your thoughts on GOLD?
Gold corrected upward as expected, reaching the top of the descending channel and the resistance zone, where it showed a clear price rejection.
In this region, gold is expected to show some consolidation and liquidity buildup, followed by a renewed bearish move toward the lower marked levels.
Political and geopolitical developments — especially talks and the possibility of a peace agreement between Ukraine and Russia — may accelerate this bearish movement.
As long as price fails to break above the resistance zone and the channel top, the short-term outlook remains bearish, and any upward correction should be viewed only as a pullback.
Don’t forget to like and share your thoughts in the comments! ❤️

Lingrid | GOLD Pullback Trading Opportunity from Support ZoneOANDA:XAUUSD is retracing into the 4,190–4,200 support band after an extended bullish run within the upward channel. The broader structure remains firmly bullish, with higher lows and higher highs forming along the rising trendline and each dip being absorbed by buyers. Price is now testing zone below the previous-day low, creating a classic buy pullback setup inside a continuation trend.
If TVC:GOLD stabilizes above the trendline and reclaims intraday momentum, the next upside rotation could drive the metal toward the 4,290 resistance shelf, aligned with the higher boundary of the channel. Maintaining support above 4,190 keeps the bullish sequence intact and favors further acceleration.
➡️ Primary scenario: pullback holds above 4,190 → continuation toward 4,290.
⚠️ Risk scenario: a clean break below channel exposes 4,100 and delays bullish continuation.
If this idea resonates with you or you have your own opinion, traders, hit the comments. I’m excited to read your thoughts!

Top 4 Price Action Signals For Beginners. Forex, Gold Trading
I will reveal 4 accurate price action signals that even a newbie trader will manage to easily recognize.
Watch carefully because these signals alone will help you to make a lot of money trading Forex, Gold or any other financial market.
Change of Character
Change of character is a strong signal that indicates a trend violation and a highly probable market reversal.
In a bearish trend, the change of character will be a bullish violation of the level of the last lower high.
Check how the change of character accurately indicated a bullish reversal on EURJPY pair.
In a bullish trend, a bearish violation of the level of the last higher low will signify a change of character and a highly probable bearish reversal.
Bearish violation of the last higher low level and a change of character on USDJPY gave a perfect bearish signal.
Breakout of Consolidation
No matter what time frame you trader, you probably noticed that quite often the markets become weak and start consolidating .
Most of the time, the prices tend to consolidate within horizontal ranges.
Breakout of one of the boundaries of the range can give you a strong trading signal.
Check how the price acted on GBPCHF.
The breakout of the support/resistance of the range always gave an accurate signal, no matter what was the preceding direction of the market.
Trend Line Breakout of a Pattern
There are a lot of trend line based bullish and bearish price action patterns: the ranges, the wedges, the triangles, the channels.
What unites these patterns is that the violation of the trend line of the pattern gives a strong trading signal.
A bullish breakout of a resistance line of a falling wedge, a bullish flag and a symmetrical triangle will give us a strong bullish signal.
Just look how EURUSD bounced after a bullish breakout of a resistance line of a falling wedge pattern.
While a bearish breakout of a support line of a rising wedge, a bearish flag or a symmetrical triangle will indicate a highly probable bearish continuation
Here is how a bearish breakout of the support of a symmetrical triangle formation helped me to predict a bearish movement on Gold.
Neckline breakout of a horizontal pattern
There are a lot of different price action patterns.
One element that unites many of them is the so-called horizontal neckline.
In bearish price action patterns like double top, head and shoulders, descending triangle, triple top, etc. a horizontal neckline represents a support from where buyers are placing their orders.
Bearish violation of such a neckline will be considered to be an important sign of strength of the sellers and a strong bearish signal.
In bullish price action patterns like double bottom, inverted head and shoulders pattern, ascending triangle, cup & handle, etc. a horizontal neckline represents a resistance where sellers a placing their orders.
Its bullish violation will a strong bullish signal.
Below is a perfect example how a bullish breakout of a neckline of an inverted head and shoulders pattern on Bitcoin triggered a strong bullish rally.
Here is how a breakout of a neckline of a double top on USDCAD confirmed an initiation of a bearish correctional movement.
The most important thing about these price action signals is that it is very simple to recognize them. You should learn the basic price action rules and a couple of classic price action patterns, it will be more than enough for you to identify confirmed bullish and bearish reversals on any time frame and any trading instrument.
❤️Please, support my work with like, thank you!❤️
I am part of Trade Nation's Influencer program and receive a monthly fee for using their TradingView charts in my analysis.

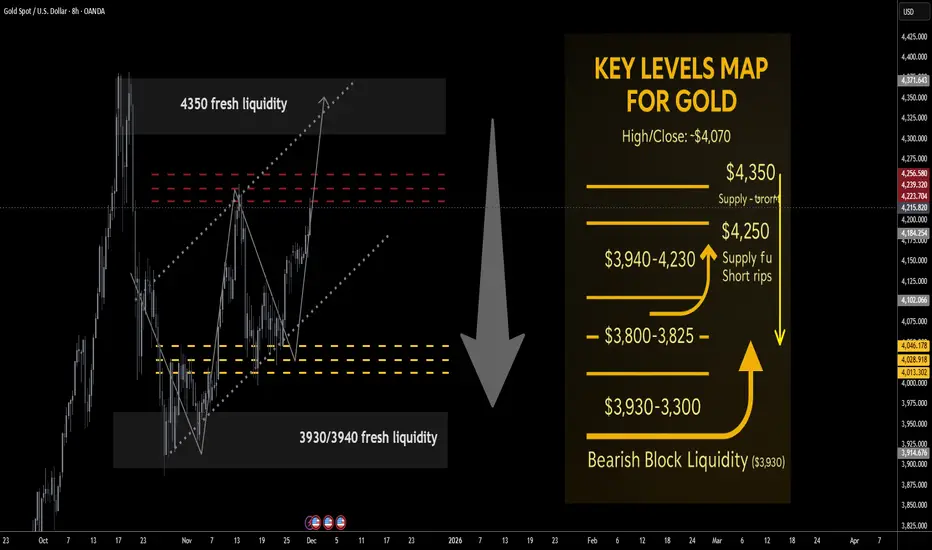
Gold next week Key S/R Levels and Outlook for Traders🔥 GOLD WEEKLY SNAPSHOT — BY PROJECTSYNDICATE
🏆 Swing High / Swing low:
$4,350 → ~$3,930 — clean rejection from the $4,350 bear-liquidity pocket, weekly close back inside prior range and below $4.1k.
📈 Trend:
Structural uptrend still intact above ~$3,900, but near-term momentum has flipped distributive: rallies into $4,250–$4,350 look like supply, not fresh markup. Upside is seen as asymmetric to the downside from overhead resistance.
🛡 Supports:
• $4,060–$4,020: first demand / reaction band below the close.
• $4,000–$3,960: psychological shelf; first downside target on failed rallies.
• $3,940–$3,930: bullish block liquidity — key structural demand; loss of this area risks a deeper de-leveraging leg.
🚧 Resistances:
• $4,200–$4,230: immediate supply from the weekly close; first “sell-the-rip” area.
• $4,250–$4,280: primary bearish liquidity / core short zone.
• $4,300–$4,350: exhaustion band; $4,350 = recent swing high / bear block.
• Stretch: $4,380 prior spike; only expected on an overshoot / stop run.
🧭 Bias Next Week:
Fade strength rather than chase upside.
Base idea: short rips into $4,220–$4,320, scale adds toward $4,350, looking for reversal back into $4,060 → $4,000–$3,960.
• A weekly close above $4,380 would invalidate the short-the-rip bias and open room toward the higher Street targets.
________________________________________
🔝 Key Resistance Zones Short-Side Focus
• $4,200–$4,230: first supply from the weekly close; good area for initial probe shorts.
• $4,250–$4,280: primary bearish liquidity / main take-profit area for trapped late longs.
• $4,300–$4,350: extension / exhaustion band; includes the $4,350 swing high and core “blow-off” liquidity pocket.
• $4,380: prior spike high / stretched stop-run; only expect in a squeeze.
________________________________________
🛡 Support Zones Downside Objectives / Where Shorts Start Covering
• $4,060–$4,020: first reaction band below; scale out partial profits here.
• $4,000–$3,960: key psychological shelf; second profit zone and likely area of responsive dip-buyers.
• $3,940–$3,930: bullish block liquidity; final target for aggressive shorts, and the spot where higher-timeframe bulls are expected to defend. A sustained break below would be a regime change.
________________________________________
⚖️ Base Case Scenario
• Rallies into $4,220–$4,320 encounter selling as late longs de-risk and fresh shorts engage.
• Price fails to sustain above $4,300–$4,350, leaving a wick / rejection on the higher timeframes.
• From there, rotation lower toward $4,060, then $4,000–$3,960 as the primary downside objective.
• Only if the $3,960–$3,930 block cracks cleanly do we start talking about a deeper flush into $3,880–$3,850 as a secondary scenario.
________________________________________
🚀 Breakout / Invalidation Trigger
• Bearish framework invalidation:
o A strong daily/weekly acceptance > $4,380 would suggest bears are trapped and open the door toward $4,450+, in line with the newly raised Street forecasts.
o In that case, shift from short-the-rip to neutral / buy shallow pullbacks until a new top structure forms.
________________________________________
💡 Market Drivers to Watch This Week
• Fed communication and front-end real yields – any hawkish surprise or delay in cuts could extend the correction; dovish surprise risks another squeeze.
• USD index swings around data / politics – sharp dollar bounces favour your short bias from resistance.
• Central-bank headlines (reserve diversification, sanction risk) – supportive in the background but less impactful intraday; use them as context, not trade triggers.
• Geopolitical flare-ups – can create squeezes into your sell zones; be ready for fast spikes into $4,300–$4,350 rather than waiting for slow grinds.
________________________________________
🔓 Bull / Bear Trigger Lines
• Structural bull line:
• Above $3,930–$4,000: long-term bull structure intact; even if you’re tactically shorting rips, treat deep flushes into this band with respect — this is where bigger players are likely accumulating.
• Bear expansion line:
• Below $3,930: opens scope for a faster liquidation wave toward $3,880–$3,850; would indicate that the 2025 blow-off is transitioning toward a broader consolidation or mean-reversion phase.
________________________________________
🧭 Strategy
Use overhead resistance as a place to sell strength, not initiate fresh longs. Expect limited upside and a reversal from liquidity above the market.
1️⃣ Primary Short Setup – Fade the Rips
• Entry zones:
o First scale: $4,220–$4,250
o Add / build: $4,250–$4,280 (primary bear-liquidity block)
o Final add / exhaustion: $4,300–$4,350 (only if tape shows blow-off / stop-run behaviour).
• Stops / invalidation:
o Tactical: hard stop above $4,380.
o More conservative traders can run a soft line at $4,350 and hard stop just beyond $4,380.
• Targets:
o TP1: $4,060–$4,020
o TP2: $4,000–$3,960
o Stretch TP3 (runner): $3,940–$3,930 bullish block.
________________________________________
🌍 Macro Tailwinds
• • Policy / Real Yields
Markets are leaning into lower US real rates and more cuts through 2026, with talk of “fiscal dominance” and persistent deficits. This keeps the medium-term backdrop supportive for gold even after the parabolic run.
• • FX / USD Dynamics
A softer, more volatile dollar driven by rate-cut expectations and concerns over US fiscal sustainability continues to underpin gold on dips, even if short-term dollar squeezes can trigger sharp pullbacks.
• • Flows: Central Banks Still the Backbone
Central banks remain heavy net buyers, with H1 and Q3 data showing robust additions and EM reserve managers diversifying away from sanction-risk USD assets. Recent commentary links record highs to this central-bank bid plus tight physical markets.
• • Flows: ETF & Investor Participation
After several years of outflows, ETF demand has turned back to net inflows, adding to central-bank buying and reinforcing the idea of a higher structural floor in the ~$3.9k area even after corrections.
• • Geopolitics & Safe-Haven Premium
Gold’s 2025 surge is still anchored in elevated geopolitical risk (Russia–NATO tensions, US–China frictions, tariff headlines), plus anxiety about frozen reserves and sanctions. This keeps the safety bid sticky even when positioning looks crowded.
• ________________________________________
GOLD (XAU/USD) : Strong Bullish ConfirmationGOLD is going to continue rising in an uptrend
that the pair established.
A completion of a consolidation and the formation of a new local Higher High
indicate a highly probable bullish continuation soon.
Next resistance - 4180 - 4200

XAUUSD (Gold) Next Buying Move Analysis Read the CaptionPrice is reacting from the rising trendline after retesting the support zone. If the current bullish push fails to break above the previous high, gold may pull back toward the support level around the purple zone before any next move.
A break below that zone can open room for deeper correction.
Please support with Boost and comments Really i need your feedback.
