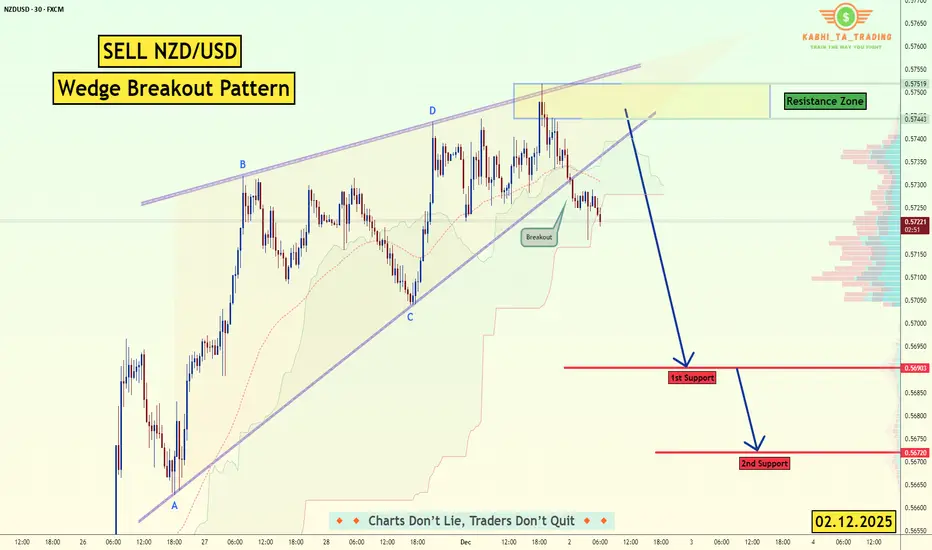
NZD/USD - Wedge Breakout (02.12.2025)📝 Description🔹 Setup Overview OANDA:NZDUSD
NZD/USD has broken below a Rising Wedge structure — a bearish continuation signal.
After retesting the lower trendline, price rejected sharply from the Resistance Zone, confirming seller strength.
Today’s fundamentals add further downside pressure, making this setup align with market sentiment.
📌 Trading Plan 📍 Bearish Scenario (Primary Plan)
Sell Opportunities: After retest of the broken wedge trendline.
Target 1: 0.5690 (1st Support)
Target 2: 0.5670 (2nd Support)
#NZDUSD #Forex #PriceAction #WedgePattern #BearishSetup #FXAnalysis #TradingView #TechnicalAnalysis #Fundamentals #USDStrength #ChartAnalysis #Kabhi_TA_Trading
⚠️ Disclaimer
This analysis is for educational purposes only — not financial advice.
Always manage your risk & use proper stop-loss levels.
👍 If you found this analysis helpful:
💬 Comment your views❤️ Like the post🔁 Share to support the work!
Trade ideas

NZDUSD - Trio Rejection… Now Waiting for the Retest!📈NZDUSD has just rejected a strong TRIO retest zone , marked by the blue circle — the intersection of the demand zone, the falling channel support, and the oversold lower trendline. This confluence has already generated a strong bullish reaction.
⚔️Now, after the initial bounce, we will be waiting for price to retest the red demand zone. That’s where we will be looking for long setups, aligning with the new bullish momentum that formed after the trio rejection.
🏹As long as NZDUSD stays above the major green demand area , the bullish correction toward the upper orange trendline remains the most likely scenario. A strong reaction from the red zone would confirm buyers stepping back in.
Will NZDUSD give us the clean retest entry? 🤔
⚠️ Disclaimer: This is not financial advice. Always do your own research and manage risk properly.
📚 Stick to your trading plan regarding entries, risk, and management.
Good luck! 🍀
All Strategies Are Good; If Managed Properly!
~Richard Nasr

NZDUSD: Time for Pullback 🇳🇿🇺🇸
NZDUSD looks too overbought after a formation
of a huge fair value gap.
I see a clear weakness of the buyers after
a test of a historic daily key level.
Expect a pullback at least to 0.5669
❤️Please, support my work with like, thank you!❤️
I am part of Trade Nation's Influencer program and receive a monthly fee for using their TradingView charts in my analysis.

NZDUSD downtrend continuation below falling resistanceThe NZDUSD currency pair continues to display a bearish outlook, in line with the prevailing downward trend. Recent price action suggests a corrective pullback, potentially setting up for another move lower if resistance holds.
Key Level: 0.5675
This zone, previously a consolidation area, now acts as a significant resistance level.
Bearish Scenario (rejection at 0.5675):
A failed test and rejection at 0.5675 would likely resume the bearish momentum.
Downside targets include:
0.5565 – Initial support
0.5540 – Intermediate support
0.5520 – Longer-term support level
Bullish Scenario (breakout above 0.5675):
A confirmed breakout and daily close above 0.5675 would invalidate the bearish setup.
In that case, potential upside resistance levels are:
0.5695 – First resistance
0.5715 – Further upside target
Conclusion
NZDUSD remains under bearish pressure, with the 0.5675 level acting as a key inflection point. As long as price remains below this level, the bias favours further downside. Traders should watch for price confirmation around that level to assess the next move.
This communication is for informational purposes only and should not be viewed as any form of recommendation as to a particular course of action or as investment advice. It is not intended as an offer or solicitation for the purchase or sale of any financial instrument or as an official confirmation of any transaction. Opinions, estimates and assumptions expressed herein are made as of the date of this communication and are subject to change without notice. This communication has been prepared based upon information, including market prices, data and other information, believed to be reliable; however, Trade Nation does not warrant its completeness or accuracy. All market prices and market data contained in or attached to this communication are indicative and subject to change without notice.

NZDUSD Setting Up for a Bullish RecoveryNZDUSD Setting Up for a Bullish Recovery
NZDUSD has been in a clear downtrend, repeatedly forming rising wedge patterns that resulted in strong bearish continuations. Each time the pair attempted to climb, the structure broke down and continued lower — and the most recent move is no exception.
Right now, the pair is retesting an important structure zone near 0.5685, a level where price has previously reacted strongly. This zone could act as a potential support where buyers attempt another push upward.
The price may retest the support area before resuming its upward trend. If that happens, NZDUSD could rally toward the first target at 0.5770 and 0.5830
You may find more details in the chart!
Thank you and Good Luck!
❤️PS: Please support with a like or comment if you find this analysis useful for your trading day❤️

SELL NZDUSD - Great trade ahead..For many weeks NZDUSD has been dropping to the downside and is in a very clear downtrend. NZDUSD has tried to gain support but each time it holds onto support, it breaks through to the downside. NZDUSD recently tried to hold onto the latest support zone but once again it broke through. It also recently retested a resistance level but couldn't break It which means it's time to sell and take profit at the very next support level.

NZDUSD - Short Term Buy IdeaH1 - Strong bullish move.
Currently it looks like a pullback is happening.
Until the two Fibonacci support zones hold I expect the price to move higher further.
If you enjoy this idea, don’t forget to LIKE 👍, FOLLOW ✅, SHARE 🙌, and COMMENT ✍! Drop your thoughts and charts below to keep the discussion going. Your support helps keep this content free and reach more people! 🚀
----------------------------------------------------------------------------------------------------------------

Stop!Loss|Market View: NZDUSD🙌 Stop!Loss team welcomes you❗️
In this post, we're going to talk about the near-term outlook for the NZDUSD currency pair☝️
Potential trade setup:
🔔Entry level: 0.57355
💰TP: 0.57796
⛔️SL: 0.57134
"Market View" - a brief analysis of trading instruments, covering the most important aspects of the FOREX market.
👇 In the comments 👇 you can type the trading instrument you'd like to analyze, and we'll talk about it in our next posts.
💬 Description: By the end of the week, the US dollar remains under pressure for the short term, so a rise to 0.58000 is also expected for NZDUSD. A potential buy trade could be initiated by breaking the upper limit of the current accumulation in the triangle pattern that has formed at 0.57300.
Thanks for your support 🚀
Profits for all ✅

NEW BREAKOUT - NZDUSDHello traders,
the NZDUSD price has formed a rectangle pattern.
Currently, the resistance level is broken!
So, I expect a bullish move from this breakout.
🎯 TARGET: 0.57770

NZD/USD BEARISH BIAS RIGHT NOW| SHORT
Hello, Friends!
The BB upper band is nearby so NZD-USD is in the overbought territory. Thus, despite the uptrend on the 1W timeframe I think that we will see a bearish reaction from the resistance line above and a move down towards the target at around 0.554.
Disclosure: I am part of Trade Nation's Influencer program and receive a monthly fee for using their TradingView charts in my analysis.
✅LIKE AND COMMENT MY IDEAS✅

NZDUSD Will Go Higher! Buy!
Here is our detailed technical review for NZDUSD.
Time Frame: 9h
Current Trend: Bullish
Sentiment: Oversold (based on 7-period RSI)
Forecast: Bullish
The market is testing a major horizontal structure 0.571.
Taking into consideration the structure & trend analysis, I believe that the market will reach 0.577 level soon.
P.S
We determine oversold/overbought condition with RSI indicator.
When it drops below 30 - the market is considered to be oversold.
When it bounces above 70 - the market is considered to be overbought.
Like and subscribe and comment my ideas if you enjoy them!

NZDUSD – Outlook for the Coming Month1. Monthly View
On the monthly timeframe, NZDUSD remains firmly bearish and is still trapped inside a broad range between 0.61204 and 0.54851. If this bearish tone continues, the lower boundary at 0.54851 becomes vulnerable and could break. Until we see a decisive shift in structure, the pair continues to favor downside conditions.
2. Weekly View
The weekly chart is telling the same story — consistent downward movement with no meaningful reversal attempts. Price has not broken a single lower high for weeks, showing that sellers remain in full control. As long as those lower highs stay intact, the weekly structure will keep pulling the market lower.
3. Daily View
The daily timeframe is where things get interesting. Every time price has dropped, NZDUSD has attempted a pullback, but these pullbacks have become smaller and weaker over time — a sign of decreasing bullish strength.
A swing low has formed on the daily chart. If the market intends to move higher, it should not close below this daily swing low, although it can still dip below it slightly to sweep liquidity before reversing. This level will play a crucial role in confirming whether buyers are stepping in or not.
4. 4-Hour View
On the 4H timeframe, I already caught a short-side setup earlier when the bearish structure was clean. But from the current position, I can also see early signs of a potential reversal — though it’s not confirmed yet.
If NZDUSD fails to break the previous lower highs, the reversal idea becomes weak. However, some lower highs are starting to break, and at the same time, we’ve also seen higher lows getting violated. Despite that, there’s still no candle body closing below the daily swing low, which keeps the possibility of a bullish attempt alive.
Another scenario is possible:
If NZDUSD neither breaks the major lower highs nor breaks the newly forming higher lows, the pair could slip into a sideways consolidation. But whichever direction it chooses to break out from that consolidation, the resulting move is likely to be strong.
Final Thoughts
NZDUSD is sitting at an important point in structure. While the higher timeframes remain bearish, the lower timeframes are hinting at the possibility of a shift — but only if key levels break with conviction. The daily swing low is the line in the sand; as long as price protects it, a more substantial pullback or even a trend reversal could unfold.
I’ll be watching how price behaves near these critical zones. A clean break of lower highs would support the bullish case, while a daily close below the swing low would put sellers back in full control.
Note: This is purely my personal analysis. Before investing or trading, always form your own view and manage your risk responsibly. I’m not responsible for any profit or loss — I’m simply sharing what I’m observing in the market.
-------------------------------------------------------------------------------------------------------------
Thanks for checking out this analysis! If you enjoyed it, hit that follow button so you don’t miss future updates. And if this breakdown helped you out, drop a like 👍 and share your thoughts in the comments 💬—I always appreciate the feedback!

NZDUSD: Bullish Push to 0.593?FX:NZDUSD is eyeing a bullish rebound on the daily chart , with price approaching a key support zone near cumulative sell liquidation, converging with downward short-term and long-term trendlines that could spark upside momentum if buyers defend the level amid recent consolidation. This setup hints at a reversal opportunity after the downtrend, targeting higher levels with strong risk-reward.🔥
Entry between 0.56060–0.56780 for a long position (entry at current levels with proper risk management is recommended). Target at 0.59300 . Set a stop loss at a close below 0.55680 , yielding a risk-reward ratio of approximately 1:2.5 . Monitor for confirmation via a bullish candle close above entry with rising volume, leveraging the pair's potential recovery post-pullback.🌟
Fundamentally , NZDUSD is holding near 0.5723 as of November 28, 2025, after surging to 0.5715 following the RBNZ's 25 bps rate cut to 2.25% on November 27, with signals of no further easing ahead amid resilient labor markets and inflation concerns. The pair has risen about 2.65% since late last week from a low of 0.55910 on November 20, driven by renewed NZD strength and rising US rate cut bets that could weaken the USD further, though forecasts suggest testing support near 0.5675 with volatility persisting due to diverging central bank policies. 💡
📝 Trade Setup
🎯 Entry (Long):
0.56060 – 0.56780
🎯 Target:
• 0.59300
❌ Stop Loss:
• Daily close below 0.55680
⚖️ Risk-to-Reward:
• ~1:2.5 overall
👇 Share your thoughts below! 👇

NZD/USD Gave Fake Breakout , Long Setup Valid To Get 200 Pips !Here is my 4H Chart on NZD/USD , We Have A Fake Breakout and then the price Back above my old support and we have a very good bullish Price Action on 2 And 4 Hours T.F Also the price playing very good around my support and i`m waiting the price to retest the broken area and giving a good bullish price action on smaller time frames to can get a confirmation to enter , So i see it`s a good chance to buy this pair if it go down a little to retest the broken area and then we can buy it and targeting 100 to 150 pips . and if we have a daily closure again below my old support then this idea will not be valid anymore .
Reasons To Enter :
1- Perfect Breakout .
2- Clear bullish Price Action .
3- Bigger T.F Giving Good bullish P.A .
4 - Perfect 15 Mins Closure .
5- The Price Respect The support Again .

NZD/USD: Bearish Drop to 0.5500?FX:NZDUSD is signaling a bearish drop on the 1-hour chart , with price respecting a short-term downward trendline, approaching cumulative short liquidation near a good entry point, and testing daily support zones that could accelerate downside if breached. This setup highlights potential for continuation lower amid weakening Kiwi momentum.
Entry zone between 0.5618-0.5632 for a short position. Targets at 0.5557 (first) and 0.5500 (second) .🎯 Set a stop loss on a close above 0.5645 to manage risk, offering a total risk-reward ratio greater than 1:4 . 🌟 Look for confirmation with a bearish close below entry and increasing volume, driven by USD strength over NZD.
Fundamentally , the Kiwi has bounced slightly to above 0.5600 from seven-month lows but faces headwinds from Fed-RBNZ policy divergence, with recent breakdowns below key supports like 0.5610 signaling further weakness—near-term levels include 0.5607 support and 0.5692 resistance. 💡
📝 Trade Setup
🎯 Entry Zone (Short): 0.5618 – 0.5632
🎯 Targets:
• TP1: 0.5557
• TP2: 0.5500
❌ Stop Loss: Close above 0.5645
⚖️ Risk-to-Reward: Greater than 1:4
What's your view on this setup? Drop your thoughts below!

NZDUSD to continue in the upward move?NZDUSD - 24h expiry
There is no clear indication that the upward move is coming to an end.
Although we remain bullish overall, a correction is possible with plenty of room to move lower without impacting the trend higher.
Risk/Reward would be poor to call a buy from current levels.
A move through 0.5750 will confirm the bullish momentum.
The measured move target is 0.5800.
We look to Buy at 0.5700 (stop at 0.5665)
Our profit targets will be 0.5775 and 0.5800
Resistance: 0.5750 / 0.5775 / 0.5800
Support: 0.5725 / 0.5700 / 0.5675
Risk Disclaimer
The trade ideas beyond this page are for informational purposes only and do not constitute investment advice or a solicitation to trade. This information is provided by Signal Centre, a third-party unaffiliated with OANDA, and is intended for general circulation only. OANDA does not guarantee the accuracy of this information and assumes no responsibilities for the information provided by the third party. The information does not take into account the specific investment objectives, financial situation, or particular needs of any particular person. You should take into account your specific investment objectives, financial situation, and particular needs before making a commitment to trade, including seeking, under a separate engagement, as you deem fit.
You accept that you assume all risks in independently viewing the contents and selecting a chosen strategy.
Where the research is distributed in Singapore to a person who is not an Accredited Investor, Expert Investor or an Institutional Investor, Oanda Asia Pacific Pte Ltd (“OAP“) accepts legal responsibility for the contents of the report to such persons only to the extent required by law. Singapore customers should contact OAP at 6579 8289 for matters arising from, or in connection with, the information/research distributed.
NZDUSD: Another Key Level 🇳🇿🇺🇸
I have accurately predicted a pullback from a key level on NZDUSD yesterday.
Today, we have a test of another one.
I expect a pullback from that to 0.5706 level.
❤️Please, support my work with like, thank you!❤️
I am part of Trade Nation's Influencer program and receive a monthly fee for using their TradingView charts in my analysis.

NZDUSD 10HThe price has finally broken out of the downtrend and is now in a pullback phase. If the correction reaches a suitable zone and gets confirmation, we can get ready for a long position.

The Market Doesn’t Lie — But It Always Tests Your Nerve📈 NZD/USD TECHNICAL OUTLOOK — BUY FROM SUPPORT, TARGET THE BREAKOUT
1. Market Structure Overview
NZD/USD is currently correcting inside a descending pullback after a strong bullish impulse.
The structure is forming:
- A higher–low sequence, showing buyers are still in control
- A clear Support Zone where price previously reacted strongly
- A Resistance Zone above acting as the obstacle before a bullish breakout
Current price action is simply a retracement phase, not a bearish reversal.
2. Key Zone to Watch — LOOK FOR LONG
Your chart correctly marks the Entry Zone at the Support Zone.
Here’s why it’s high probability:
✓ Confluence for BUY
- Previous demand reacted sharply
- Market is forming a potential double-bottom or liquidity sweep
- Price is approaching the end of its corrective wave
- Momentum loss on the bearish leg
This area is where institutions typically accumulate long orders.
3. Main Scenario (High Probability)
[/b ]BUY FROM SUPPORT → BREAKOUT → FULL BULLISH CONTINUATION
When price taps the Support Zone:
-Look for rejection
- Look for a higher low
- Enter LONG on confirmation
- Stop loss below structure (as marked)
Take-Profit Levels:
- TP1: Mid-range / mini resistance
- TP2: Major Resistance Zone
- TP3: Full extension (your highest TP zone)
This matches your drawn black path:
Dip → higher low → breakout → strong bullish continuation.
4. Secondary Scenario (Lower Probability)
Price consolidates at Support but does not break higher immediately.
Even if so — this still favors accumulation, not selling.
As long as price stays above the Support Zone → the bias remains bullish.
5. Intraday Bias: BULLISH
- Structure: Uptrend
- Current move: Healthy pullback
- Key reaction zone: Support
- Best trade: BUY on rejection
- Risk management: SL below the liquidity sweep zone
This is a clean, textbook continuation setup.

THE BEST TRADE IN 2025, CLEANEST PA I'VE EVER SEEN! NZDUSD!!Not gonna lie , this is the cleanest Structure i've seen and probably cleanest reversal on daily time frame in discount. So now only what i have to do is wait till pull back in daily FVG and discount and open long position till end of the year.
All information on the chart
Follow me for more interesting ideas and updates

NZD/USD - A market that is too bearish to consider buysFor me personally, i will just skip the fact that the most recent price action was bullish just because if i zoom out the chart, the price was everytime reacting from the most highest supply.
Right now, price just entered inside the supply zone from the bearish orderflow (daily chart), took liquidity and just waiting for any kind of reaction to sell this market to a new LL.

