USD/JPY - H4 - Breakdown Watch!(29.11.2025)📝 Technical Description FX:USDJPY
USD/JPY has been moving inside a clean ascending channel on the H4 timeframe.
Price is now sitting inside the Reversal Zone, struggling to break above the channel’s mid-line resistance. A bearish correction is possible if the market fails to reclaim the upper zone.
This setup remains a pending order, and requires confirmation before execution.*
📊 Trading Plan (My View)🔻 Bearish Scenario (Primary Setup)
If price rejects the Reversal Zone, expect a bearish channel breakdown.
Target a correction toward the key support zones shown on the chart.
🎯 Key Levels
Reversal Zone: 156.300 – 156.500
Support Zone (Target): 153.093
⚠️ Today’s Fundamental Updates – 29 Nov 2025
1️⃣ Bank of Japan Policy Sentiment Shifts
BoJ Governor Ueda hinted that an interest rate increase may come sooner,
as the government boosts spending to stimulate the economy.
➡ This generally strengthens the JPY, increasing downside pressure on USD/JPY.
2️⃣ US Dollar Weakness Drivers
Rising expectations of rate cuts from the Federal Reserve.
Treasury yields softening due to recession worries.
➡ A weaker USD supports the bearish setup on USD/JPY.
📌 Summary
Strong channel resistance + bearish fundamentals on USD → JPY
= High-probability reversal correction setup once confirmation appears.
⚠️ Wait for breakout confirmation before entering.
⚠️ Disclaimer
This analysis is for education only.
Not financial advice. Always trade with proper risk management.
❤️ Support the Work
If this analysis helped you,👉 Please LIKE 👍 & COMMENT 💬
Your support motivates me to post more high-quality setups daily!
#usdjpy #forex #forexanalysis #priceaction #channelpattern #technicalanalysis
#fxsignals #tradingview #chartanalysis #jpy #boj #fundamentals #usdweakness #reversalpattern
Trade ideas

Can USDJPY Break the 157.9 Barrier This Week?💶 USDJPY – Weekly Smart Money Outlook | 30/11 | by Ryan_TitanTrader
📈 Market Context
• Price remains supported inside a 4H bullish trendline, showing multiple BOS footprints from the lower structure.
• The pair has delivered strong upside displacement but is now compressing near highs, forming a clear institutional accumulation box before the next weekly expansion.
• Liquidity pools are cleanly positioned:
o Premium side → above 157.9, ideal for buy-stop hunting before potential distribution.
o Discount side → under 155.34, resting sell-side liquidity for a sweep into demand.
• Expect liquidity engineering → displacement → expansion from the edges, not the middle.
🔎 Technical Analysis (4H / SMC View)
• Price rallied into equal highs then printed a sell-side sweep zone at 157.238–157.240, later rejecting and forming a local ChoCH pocket inside a descending micro-channel.
• The upper edge 157.905–157.907 is the key unmitigated 4H supply zone + liquidity magnet sitting above the recent high, making it an ideal “fake breakout → reversal” weekly scenario if defended by sellers.
• The lower edge 155.341–155.339 aligns cleanly under inducement lows and liquidity shelf – a textbook discount demand sweep pocket inside trend.
• Institutions are likely to run price into one side first:
o If swept above 157.9 → watch rejection for distribution
o If swept below 155.34 → watch expansion for continuation
🟢 Buy Zone: 155.341 – 155.339
• Entry: 155.341 – 155.339
• SL: 155.330
🎯 TP Targets
• TP1: 156.00 – 156.20 (internal liquidity pocket)
• TP2: 157.24 – 157.20 (equal highs + liquidity shelf)
• TP3: 157.90 – 158.40 (premium sweep zone)
Rationale (Buy)
• The zone sits in discount, protected by the bullish trendline.
• Positioned under inducement lows → ideal for sell-side liquidity sweep → bullish displacement.
• Best scenario confirmation:
o M15/M5 rejection wick + bullish engulfing
o Market prints BOS upward with strong candle expansion
🔴 Sell Zone: 157.905 – 157.907
• Entry: 157.905 – 157.907
• SL: 157.910
🎯 TP Targets
• TP1: 157.24 – 157.20 (initial liquidity release)
• TP2: 156.50 – 156.40 (equilibrium pullback)
• TP3: 155.34 – 155.30 (weekly return to demand)
Rationale (Sell)
• This is a premium supply pocket above equal highs, filled with breakout stops.
• Textbook scenario for liquidity sweep high → wick rejection → sell displacement.
• Strong confluence from the descending micro-trend + supply imbalance above structure.
⚠️ Risk Management Notes
• Only execute after confirmation inside zones (wick rejection, engulfing, or expansion candle).
• Do not chase mid-range (156.20 – 157.00) unless clear displacement prints.
• Take partial profits at each TP, then move SL to breakeven after TP1.
• Expect higher volatility during London ↔ US session overlap.
Summary
Weekly liquidity terrain is set at:
• 157.9 = Premium supply sweep zone (liquidity trap)
• 155.34 = Discount demand sweep zone (liquidity defense)
Bias will form after the sweep, not before. Wait for the grab → trade the reaction.
🔔 Follow @Ryan_TitanTrader for more weekly Smart Money insight ⚡

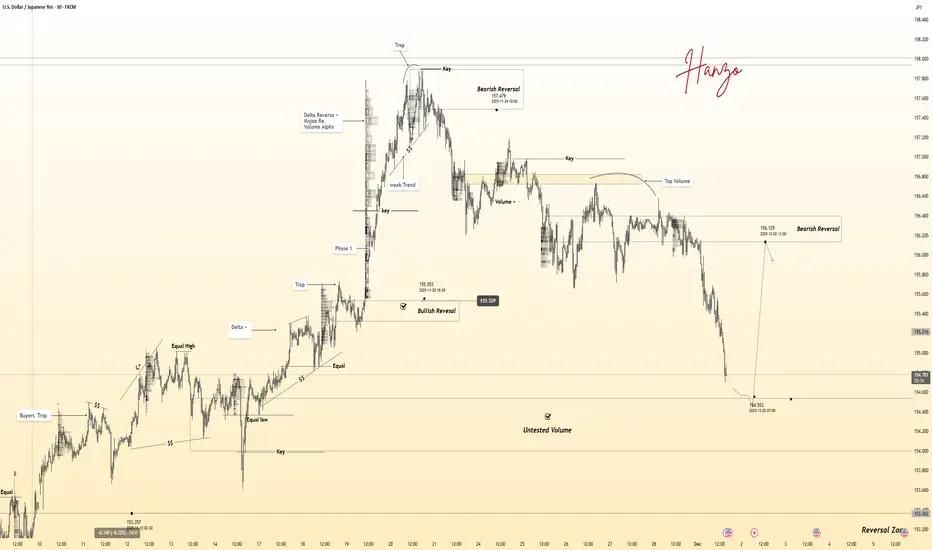
USDJPY -30Min — Volume Sell Reversal Triggered⚡Base : Hanzo Trading Alpha Algorithm
The algorithm calculates volatility displacement vs liquidity recovery, identifying where probability meets imbalance.
It trades only where precision, volume, and manipulation intersect —only logic.
✈️ Technical Reasons
/ Direction — SHORT / Reversal 4191 Area
☄️Bearish rejection confirmed through sharp candle body.
☄️Lower-high forming beneath resistance supply region.
☄️Volume decreasing confirms exhaustion in price rally.
☄️Sellers regained imbalance with heavy top rejection.
☄️Algorithm detects fading demand and shift to control.
⚙️ Hanzo Alpha Trading Protocol
The Alpha Candle defines the day’s real control zone — the first battle of momentum.
From this origin, the Volume Window reveals where the next precision strike begins.
⚙️ Hanzo Volume Window / Map
Window tracked from 10:30 — mapping true market behavior.
POC alignment exposes institutional bias and breakout potential zones.
⚙️ Hanzo Delta Window / Pulse
Delta window monitors real buying vs. selling power behind each move.
Tracks volume aggression to expose who controls the candle — buyers or sellers.
When Delta aligns with Volume Map, momentum becomes undeniable.

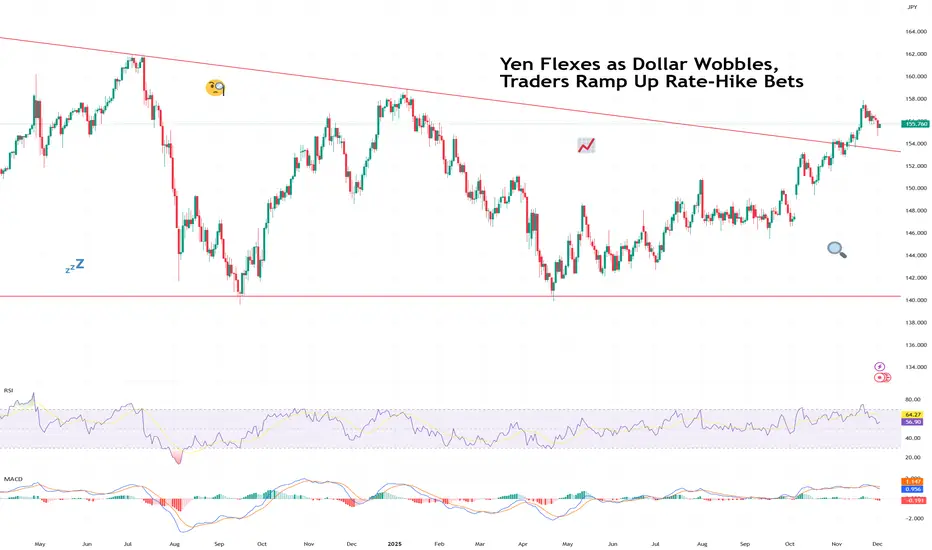
Yen Flexes as Dollar Wobbles, Traders Ramp Up Rate-Hike BetsThe yen came into Monday looking calm… and then proceeded to bench-press the dollar.
The FX:USDJPY pair slid under ¥155, hitting a session low of ¥154.65, after BoJ Governor Kazuo Ueda dropped one of the most powerful phrases in global FX:
“We will weigh the pros and cons of tightening.”
In Tokyo-speak, that’s basically suggesting “rate hike incoming!”
The greenback instantly shed over 100 pips (every day trader’s dream), a half-percent haircut that reminded traders just how exquisitely sensitive the yen is to hints of policy change after 30 years of ultra-loose money.
The next day, however, was a bit different. Early Tuesday morning, the pair gained back about half of what it lost the day before. Still, some things to note about Monday's slide:
It wasn’t just FX that reacted. The yen’s surge:
Knocked the Nikkei FX:JPN225 down 2%,
Pushed Japanese government bond yields to 17-year highs,
And forced traders to reprice Japan’s entire risk landscape in real time.
🕰️ The Market Has Been Waiting for This Moment
FX traders have been staring at the FX:USDJPY for months, waiting for a sign — any sign — that Japan was finally ready to pivot. In the meantime, officials have made a sport out of verbal interventions:
“We are watching FX moves with urgency.”
“We will not tolerate excessive yen weakness.”
“We have tools, and we are not afraid to use them.”
Translation: Stop shorting the yen, it stresses us out.
With Ueda openly weighing a rate hike at the December 19 Bank of Japan meeting, traders are scrambling to unwind one of the most crowded trades in global macro: the “short yen” position.
A country that’s really truly reluctant to raise rates is suddenly hinting at liftoff — or at least a step towards it.
📉 Dollar Wobbles as Macro Crosswinds Build
While Japan is drifting away from negative-rate territory, the US dollar faces a catalyst-packed December that could amplify or counter the yen’s breakout.
Four major US data releases stand between now and the BoJ’s meeting:
Dec 5: Fed’s preferred inflation gauge (PCE)
Dec 10: CPI inflation report
Dec 10: Fed interest-rate decision
Dec 16: Nonfarm payrolls (US jobs report)
If the Fed so much as hums a dovish note, yen strength could accelerate fast.
If Powell surprises with a hawkish tone, the dollar may find a floor.
Either way, this is the first time in years that both sides of the dollar-yen have meaningful rate catalysts.
🔄 A Trend Reversal in the Making?
Big macro traders — the same funds that spent the last year squeezing every drop out of the yen carry trade — are taking profits, reducing leverage, and even tiptoeing into long-yen bets.
When one of the world’s great one-way trades starts wobbling, liquidity thins, and volatility spikes.
This is precisely the environment where this volatile beast can swing 100 pips before your coffee cools.
And if Japan genuinely signals the start of a tightening cycle? Carry unwinds can get violent.
One central bank hint today can become a multi-month trend tomorrow.
🧭 So What Happens Next?
The yen’s flex this week may be just the opening act.
Everything now hinges on:
BoJ clarity on Dec 19
How soft (or not) US inflation comes in
Whether the Fed’s tone shifts on Dec 10
And how the labor market behaves into year-end
Watch the economic calendar and get ready for action. FX volatility is back on the menu.
Now that it’s happening, everyone’s asking the same question:
We’ll leave it to you : Was this a one-day pop — or the start of the yen’s long-awaited comeback tour? Share your views in the comments!
USDJPY Forming remains bullish.USDJPY is forming a potentially risky bullish setup after completing what appears to be an ABC corrective structure. The pair is showing temporary bullish momentum, supported by downside rejection, which signals buyers are still active.
Despite the short-term hesitation, the overall market structure remains bullish.
If price continues to follow this trajectory, the next key resistance zone to watch is 157.108 and second resistance 157.708
You may find more details in the chart,
Trade wisely best of luck buddies.
Ps; Support with like and comments for better analysis Thanks for Supporting.

USDJPY Next Analysis Move USDJPY Buy Setup
Price has bounced strongly from the channel’s lower boundary, showing clear bullish momentum. As long as price holds above the recent rejection zone, bulls remain in control.
Target: 157.00 zone
Structure: Breakout from descending channel + bullish continuation pattern
Bias: Bullish towards target level
Please Kindly Support with Boost and comments.

USDJPY 30-Min — Volume Buy & Sell Reversal Triggered⚡Base : Hanzo Trading Alpha Algorithm
The algorithm calculates volatility displacement vs liquidity recovery, identifying where probability meets imbalance.
It trades only where precision, volume, and manipulation intersect —only logic.
✈️ Technical Reasons
/ Direction — LONG / Reversal 154.550 Area
☄️Bullish momentum confirmed through strong candle body.
☄️Structure shifted with higher-low near key demand base.
☄️Volume expanding confirms order-flow alignment upward.
☄️Buyers reclaimed imbalance with sustained clean break.
☄️Algorithm detects rising momentum under low liquidity.
✈️ Technical Reasons
/ Direction — SHORT / Reversal 156.100 Area
☄️Bearish rejection confirmed through sharp candle body.
☄️Lower-high forming beneath resistance supply region.
☄️Volume decreasing confirms exhaustion in price rally.
☄️Sellers regained imbalance with heavy top rejection.
☄️Algorithm detects fading demand and shift to control.
⚙️ Hanzo Alpha Trading Protocol
The Alpha Candle defines the day’s real control zone — the first battle of momentum.
From this origin, the Volume Window reveals where the next precision strike begins.
⚙️ Hanzo Volume Window / Map
Window tracked from 10:30 — mapping true market behavior.
POC alignment exposes institutional bias and breakout potential zones.
⚙️ Hanzo Delta Window / Pulse
Delta window monitors real buying vs. selling power behind each move.
Tracks volume aggression to expose who controls the candle — buyers or sellers.
When Delta aligns with Volume Map, momentum becomes undeniable.
USDJPY -30Min — Volume Buy Reversal Triggered⚡Base : Hanzo Trading Alpha Algorithm
The algorithm calculates volatility displacement vs liquidity recovery, identifying where probability meets imbalance.
It trades only where precision, volume, and manipulation intersect —only logic.
Technical Reasons
/ Direction — LONG / Reversal 156.000 Area
☄️Bullish momentum confirmed through strong candle body.
☄️Structure shifted with higher-low near key demand base.
☄️Volume expanding confirms order-flow alignment upward.
☄️Buyers reclaimed imbalance with sustained clean break.
☄️Algorithm detects rising momentum under low liquidity.
⚙️ Hanzo Alpha Trading Protocol
The Alpha Candle defines the day’s real control zone — the first battle of momentum.
From this origin, the Volume Window reveals where the next precision strike begins.
⚙️ Hanzo Volume Window / Map
Window tracked from 10:30 — mapping true market behavior.
POC alignment exposes institutional bias and breakout potential zones.
⚙️ Hanzo Delta Window / Pulse
Delta window monitors real buying vs. selling power behind each move.
Tracks volume aggression to expose who controls the candle — buyers or sellers.
When Delta aligns with Volume Map, momentum becomes undeniable.

USDJPY Pauses Around 156.272, Waiting for DirectionHello everyone,
USD/JPY is currently consolidating near 156.272. Buyers lack momentum to push higher, while sellers aren’t strong enough to drive it lower. This sideways movement reflects market hesitation before the next directional move.
FVG gaps appear on both sides, showing unbalanced flows. The gap just below 156.272 is notable and could be filled soon. Volume clusters around 156.400 act as a key upper barrier.
If selling pressure increases and 156.272 is broken, 156.000 becomes the next test, with 155.800 further down as a potential target if the downtrend continues.
US economic data, Fed rate expectations, and BoJ signals will likely guide the next move for this pair. How do you see USD/JPY developing from here?

USDJPY: Bullish Recovery Possible—But Very High RiskUSDJPY: Bullish Recovery Possible—But Very High Risk
USDJPY is forming a very risky bullish setup after completing what looks like an ABC corrective structure.
Price is signaling temporary bullish momentum, but the overall structure remains fragile.
The first challenge is the nearby resistance around 156.37, where the price may face rejection before any continuation. If the price moves above 156.37, the likelihood of further increases should become higher.
Targets:
🔸 156.900
🔸 157.500
You may find more details in the chart!
Thank you and Good Luck!
❤️PS: Please support with a like or comment if you find this analysis useful for your trading day❤️

USDJPY Potential DownsidesHey Traders, in today's trading session we are monitoring USDJPY for a selling opportunity around 155.900 zone, USDJPY is trading in a downtrend and currently is in a correction phase in which it is approaching the trend at 155.900 support and resistance area.
Trade safe, Joe.

Lingrid | USDJPY Potential Long After PullbackFX:USDJPY perfectly played out my previous trading idea . Market is pulling back into the 155.88–156.00 zone, aligning with the upward trendline. The recent drop forms a clean ABC corrective pattern, and price is stabilizing right at the structural demand area that previously launched a strong bullish impulse toward the highs. Buyers are defending the trendline, showing early signs of absorption after a controlled retracement.
If this support cluster holds, it is positioned for a continuation toward 157.90, which corresponds to the resistance band and the previous higher high. The broader structure remains bullish, backed by higher-low formation and the intact upward channel, while yen fundamentals continue to lean weak due to ongoing BoJ caution.
➡️ Primary scenario: bullish defense at 155.88 → move toward 157.90.
⚠️ Risk scenario: a decisive break below the trendline will lead to channel border retest.
If this idea resonates with you or you have your own opinion, traders, hit the comments. I’m excited to read your thoughts!

USD/JPY – Bearish Flag Breakdown (25.11.2025)📝 Description 📌 Setup Overview FX:USDJPY
USD/JPY has completed a Bearish Flag on the M30 timeframe and price has now broken below the flag support with momentum.
The Ichimoku Cloud is acting as resistance, showing sellers stepping in again after a short pullback.
📉 Bias: Bearish continuation📍 Pattern: Bear Flag (Breakout confirmed)
🎯 Trading Plan
• Entry idea: After a clean breakout & retest confirmation below the flag base zone
• TP1: 156.055 (1st Support)
• TP2: 155.622 (2nd Support)
• SL suggestion: Above 157.000 (invalidates breakdown)
• RR potential: 1:2 — 1:3 depending on entry
🧠 Why this move makes sense
1️⃣ Price rejected Ichimoku cloud + structure resistance
2️⃣ USD weakness continues after recent pullback
3️⃣ JPY demand increases as risk sentiment cools ahead of key macro events
📌 What to expect
If price retests the flag support from below and rejects again, bearish momentum could accelerate toward 156.05 → 155.62.
💬 Your turn
Which target will hit first in your view — TP1 or TP2?
👇 Comment below — I reply to all comments.
🔖 SAVE this post so you don’t miss the trade update.
👍 LIKE if you want more Bear Flag & Triangle setups.
⚠ Disclaimer: For educational purposes only. Not financial advice. Trade based on your plan & risk management.
#USDJPY #forex #bearflag #priceaction #tradingview #technicalanalysis #chartanalysis #forexanalysis #ickycloud #supportandresistance #forextrading #marketstructure #smartmoney

USD/JPY — Poised for Bullish Reversal at Key Demand ZoneUSD/JPY is currently testing a major demand zone, a level where price has historically found strong buying interest. This area has acted as a structural support multiple times, making it a high-probability zone for a bullish reversal.
The recent price action shows slowing downside momentum, with smaller candles and wicks rejecting lower levels — signaling that buyers are stepping in. If the market holds this zone, we could see:
A bullish engulfing candle or pin-bar formation confirming rejection.
A strong upward impulsive move targeting previous swing highs.
Increased buying momentum as traders enter at a low-risk point.
For traders looking to go long, this setup allows for strategic entry near the support zone, with a stop-loss just below the demand area to manage risk. The upside potential aligns with prior highs, making it an attractive risk-to-reward opportunity.
Key Point: Wait for confirmation via a bullish candlestick pattern or a retest of the zone before entering to maximize probability of success.

USDJPY 1H – Range Breakdown & Retest SetupFX:USDJPY
After a sequence of lower highs, the market paused inside a consolidation range, creating liquidity buildup on both sides. A sweep of downside liquidity followed by strong rejection will confirm a shift in short-term momentum. If buyers protect support and price reclaims structure, an upside continuation toward key resistance zones becomes probable.
Key Scenarios
✅ Bullish Case 🚀
Hold above 155.815–155.900 entry zone →
→ 🎯 Target 1: 156.578
→ 🎯 Target 2: 156.735
→ 🎯 Target 3: 157.131
❌ Bearish Case 📉
Break and close below 155.680 invalidates bullish continuation:
→ Next support: 155.400
Current Levels to Watch
Resistance 🔴: 156.578 | 156.735 | 157.131
Support 🟢: 155.815 | 155.680 | 155.400
⚠️ Disclaimer: This analysis is for educational purposes only. Not financial advice.

USDJPY–AscendingTriangle Formation & Key ResistanceZone in FocusUSDJPY is currently respecting an ascending triangle structure as price continues to form higher lows while pressing against the upper trendline. The market recently reacted from the triangle base near 155.00, showing bullish momentum as it approaches the descending resistance trendline.
The chart also highlights a major resistance zone around 157.50–158.00, aligned with previous structural highs and Fib retracement levels. A breakout above this zone could indicate continued bullish momentum, while rejection may keep price consolidating within the triangle.
Ascending Triangle Pattern
Bearish Trendline & Potential Breakout Area
Resistance Zone: 157.50–158.00
Fib Retracement Markings
Structure Labels (BOS / CHoCH)
This setup helps monitor how price behaves near the trendline and key levels. Watching for market structure shifts can provide insight into the next directional move

USDJPYwe break down a high-probability sell setup on the USD/JPY pair using technical analysis from both the 15-minute From last week, we’ve been tracking a steady bearish structure on the USD/JPY, driven by continued weakness in the United States Dollar against the Japanese Yen.
analyze momentum behavior using the Bollinger Bands, where price is currently reacting from the upper band edge, signaling potential exhaustion of buyers and increasing the dominance of sellers.

A Perfect Buy sentiment is here This is the USDJPY with a good Bullish flag pattern on it ... Before the New York session I believe it's the perfect time to scale in and hold...
Let's envisage bullish move today and tomorrow.

USD/JPY) Bearish trend analysis Read The captionSMC Trading point update
Technical analysis of breakdown of the idea from your chart analysis (USD/JPY 1H):
---
Bearish Setup Explanation
The chart shows price consolidating inside a rising wedge, which is typically a bearish reversal pattern in an overall downtrend.
Two strong rejections (red arrows) from the supply zone around 156.35–156.45, confirming sellers’ presence.
50 EMA and 200 EMA are currently above price, acting as dynamic resistance, supporting bearish bias.
The price is currently sitting near wedge support, and the expectation is a breakdown below trendline support, leading to momentum selling.
---
Key Levels
Type Price
Resistance zone (Sell zone) 156.35 – 156.45
Current price 156.15
Breakdown confirmation Below 156.00
Main target 155.18
---
Trade Idea
Sell after breakout retest
If price breaks below 156.00, wait for a pullback retest to enter — safer confirmation.
TP1: 155.60
TP2 (Major target shown): 155.18
SL: above 156.45 zone (short term structure invalidation)
---
Reasoning
Strong supply zone rejection
Bearish wedge formation
EMA bearish alignment
Potential fundamental catalysts upcoming (red news icons marked)
Mr SMC Trading point
---
Bias Summary
Bearish short term
As long as price stays below 156.45, sellers remain strong.
---
If you want, I can:
Draw a cleaner version of this setup
Give fundamental expectation for USD/JPY for coming week
Provide invalidation/alternative bullish scenario
Please support boost 🚀 this analysis

USDJPY – Intraday Bearish Outlook from Structure ZoneReviewing USDJPY on the 15-minute chart.
Price has revisited an upper reaction zone and is currently showing hesitation around that area.
The gray region highlights the invalidation zone where the bearish idea weakens.
The orange region represents the downside observation area, aligning with earlier intraday reaction points.
This chart is shared for educational and market-study purposes only.
✅ Analysis (Based on Your Markup)
Price tapped into a previous supply-like zone where sellers reacted earlier.
The recent candle forming below this area suggests short-term pressure to the downside.
The gray box above is the invalidation range; if price pushes through it, the idea becomes less valid.
The lower marked level around 155.652 lines up with prior market reactions, making it a logical observation point for a potential move.

I see selling pressure, I would hold. This is not finance advice. Back test show no movement toward uptrends.

USDJPY Buys trade IdeaThis is a risky low confirmation buy setup. Anticipating for a continuous bullish Price Action when price mitigates the OB/Demand zone.
Manage risk well.

USDJPY H4The very important support has stabilized the price and since the chart trend is bullish, the buying idea is logical.
