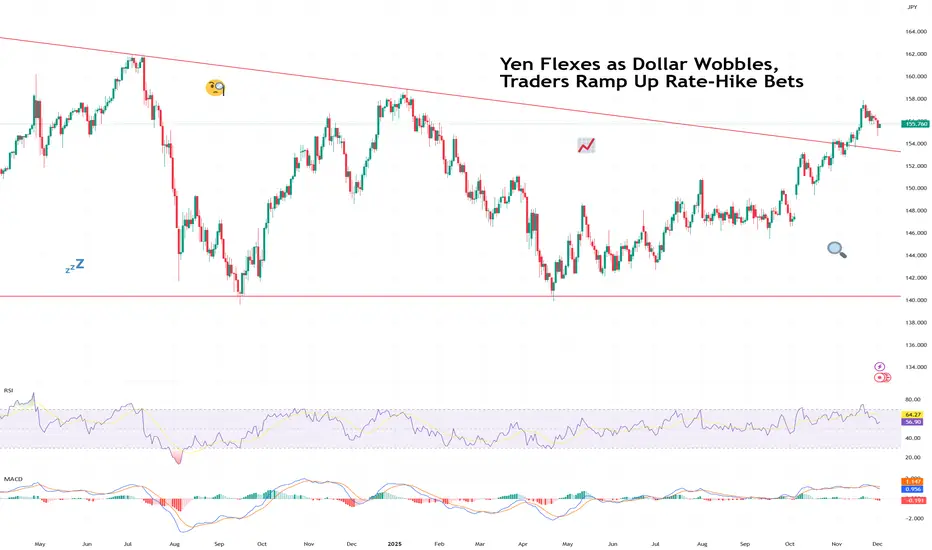
Yen Flexes as Dollar Wobbles, Traders Ramp Up Rate-Hike BetsThe yen came into Monday looking calm… and then proceeded to bench-press the dollar.
The FX:USDJPY pair slid under ¥155, hitting a session low of ¥154.65, after BoJ Governor Kazuo Ueda dropped one of the most powerful phrases in global FX:
“We will weigh the pros and cons of tightening.”
In Tokyo-speak, that’s basically suggesting “rate hike incoming!”
The greenback instantly shed over 100 pips (every day trader’s dream), a half-percent haircut that reminded traders just how exquisitely sensitive the yen is to hints of policy change after 30 years of ultra-loose money.
The next day, however, was a bit different. Early Tuesday morning, the pair gained back about half of what it lost the day before. Still, some things to note about Monday's slide:
It wasn’t just FX that reacted. The yen’s surge:
Knocked the Nikkei FX:JPN225 down 2%,
Pushed Japanese government bond yields to 17-year highs,
And forced traders to reprice Japan’s entire risk landscape in real time.
🕰️ The Market Has Been Waiting for This Moment
FX traders have been staring at the FX:USDJPY for months, waiting for a sign — any sign — that Japan was finally ready to pivot. In the meantime, officials have made a sport out of verbal interventions:
“We are watching FX moves with urgency.”
“We will not tolerate excessive yen weakness.”
“We have tools, and we are not afraid to use them.”
Translation: Stop shorting the yen, it stresses us out.
With Ueda openly weighing a rate hike at the December 19 Bank of Japan meeting, traders are scrambling to unwind one of the most crowded trades in global macro: the “short yen” position.
A country that’s really truly reluctant to raise rates is suddenly hinting at liftoff — or at least a step towards it.
📉 Dollar Wobbles as Macro Crosswinds Build
While Japan is drifting away from negative-rate territory, the US dollar faces a catalyst-packed December that could amplify or counter the yen’s breakout.
Four major US data releases stand between now and the BoJ’s meeting:
Dec 5: Fed’s preferred inflation gauge (PCE)
Dec 10: CPI inflation report
Dec 10: Fed interest-rate decision
Dec 16: Nonfarm payrolls (US jobs report)
If the Fed so much as hums a dovish note, yen strength could accelerate fast.
If Powell surprises with a hawkish tone, the dollar may find a floor.
Either way, this is the first time in years that both sides of the dollar-yen have meaningful rate catalysts.
🔄 A Trend Reversal in the Making?
Big macro traders — the same funds that spent the last year squeezing every drop out of the yen carry trade — are taking profits, reducing leverage, and even tiptoeing into long-yen bets.
When one of the world’s great one-way trades starts wobbling, liquidity thins, and volatility spikes.
This is precisely the environment where this volatile beast can swing 100 pips before your coffee cools.
And if Japan genuinely signals the start of a tightening cycle? Carry unwinds can get violent.
One central bank hint today can become a multi-month trend tomorrow.
🧭 So What Happens Next?
The yen’s flex this week may be just the opening act.
Everything now hinges on:
BoJ clarity on Dec 19
How soft (or not) US inflation comes in
Whether the Fed’s tone shifts on Dec 10
And how the labor market behaves into year-end
Watch the economic calendar and get ready for action. FX volatility is back on the menu.
Now that it’s happening, everyone’s asking the same question:
We’ll leave it to you : Was this a one-day pop — or the start of the yen’s long-awaited comeback tour? Share your views in the comments!
USDJPY
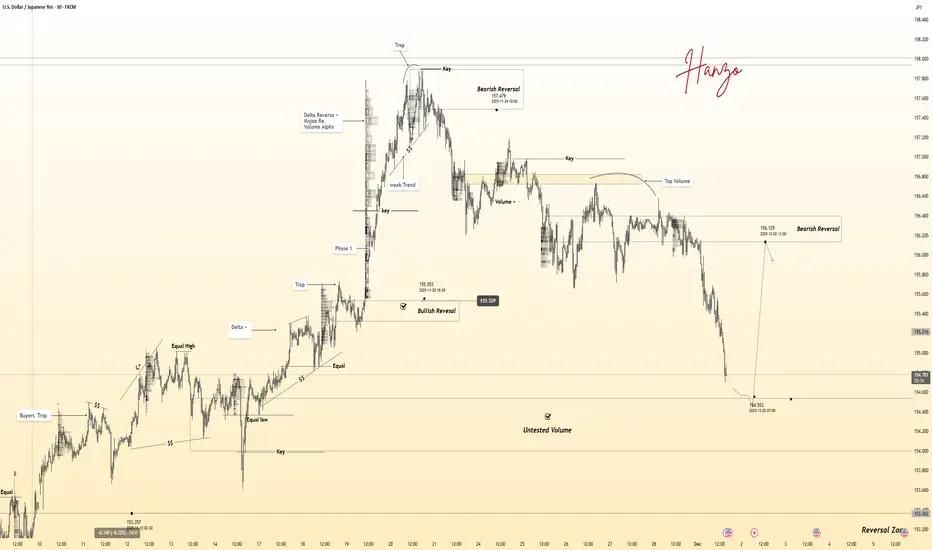
USDJPY 30-Min — Volume Buy & Sell Reversal Triggered⚡Base : Hanzo Trading Alpha Algorithm
The algorithm calculates volatility displacement vs liquidity recovery, identifying where probability meets imbalance.
It trades only where precision, volume, and manipulation intersect —only logic.
✈️ Technical Reasons
/ Direction — LONG / Reversal 154.550 Area
☄️Bullish momentum confirmed through strong candle body.
☄️Structure shifted with higher-low near key demand base.
☄️Volume expanding confirms order-flow alignment upward.
☄️Buyers reclaimed imbalance with sustained clean break.
☄️Algorithm detects rising momentum under low liquidity.
✈️ Technical Reasons
/ Direction — SHORT / Reversal 156.100 Area
☄️Bearish rejection confirmed through sharp candle body.
☄️Lower-high forming beneath resistance supply region.
☄️Volume decreasing confirms exhaustion in price rally.
☄️Sellers regained imbalance with heavy top rejection.
☄️Algorithm detects fading demand and shift to control.
⚙️ Hanzo Alpha Trading Protocol
The Alpha Candle defines the day’s real control zone — the first battle of momentum.
From this origin, the Volume Window reveals where the next precision strike begins.
⚙️ Hanzo Volume Window / Map
Window tracked from 10:30 — mapping true market behavior.
POC alignment exposes institutional bias and breakout potential zones.
⚙️ Hanzo Delta Window / Pulse
Delta window monitors real buying vs. selling power behind each move.
Tracks volume aggression to expose who controls the candle — buyers or sellers.
When Delta aligns with Volume Map, momentum becomes undeniable.
EUR/USD | Short, Long, Short ! (READ THE CAPTION)By analyzing the #EURUSD chart on the 6 hour timeframe, we can see that price is currently trading around 1.164. I expect a short pullback first, and after that EURUSD could climb again toward the 1.169 zone. Once price reaches the supply area I’m watching, another correction is likely. This analysis will be updated soon.
Please support me with your likes and comments to motivate me to share more analysis with you and share your opinion about the possible trend of this chart with me !
Best Regards , Arman Shaban

GBP/USD | Clean Drop Hit Target, Now Setting Up for the Next MovBy analyzing the #GBPUSD chart on the 2 hour timeframe, we can see that price dropped exactly as expected and successfully hit the 1.32130 target, even dipping briefly to 1.3200. After that move, GBPUSD bounced and is now trading around 1.325.
I expect a small pullback first, but after that the pair could push higher toward the 1.328 area. This analysis will be updated soon.
Please support me with your likes and comments to motivate me to share more analysis with you and share your opinion about the possible trend of this chart with me !
Best Regards , Arman Shaban

USDJPY 30-Min — Volume Buy Reversal Triggered⚡Base : Hanzo Trading Alpha Algorithm
The algorithm calculates volatility displacement vs liquidity recovery, identifying where probability meets imbalance.
It trades only where precision, volume, and manipulation intersect —only logic.
✈️ Technical Reasons
/ Direction — LONG / Reversal 155.450 Area
☄️Bullish momentum confirmed through strong candle body.
☄️Structure shifted with higher-low near key demand base.
☄️Volume expanding confirms order-flow alignment upward.
☄️Buyers reclaimed imbalance with sustained clean break.
☄️Algorithm detects rising momentum under low liquidity.
⚙️ Hanzo Alpha Trading Protocol
The Alpha Candle defines the day’s real control zone — the first battle of momentum.
From this origin, the Volume Window reveals where the next precision strike begins.
⚙️ Hanzo Volume Window / Map
Window tracked from 10:30 — mapping true market behavior.
POC alignment exposes institutional bias and breakout potential zones.
⚙️ Hanzo Delta Window / Pulse
Delta window monitors real buying vs. selling power behind each move.
Tracks volume aggression to expose who controls the candle — buyers or sellers.
When Delta aligns with Volume Map, momentum becomes undeniable.

USDJPY Potential DownsidesHey Traders, in today's trading session we are monitoring USDJPY for a selling opportunity around 155.900 zone, USDJPY is trading in a downtrend and currently is in a correction phase in which it is approaching the trend at 155.900 support and resistance area.
Trade safe, Joe.

USDJPY D11️⃣ Market Structure
USDJPY remains in a long-term uptrend, moving inside a clearly defined ascending channel.
Recently, price broke below the midline of the channel, indicating bullish exhaustion.
Current candle shows a corrective pullback upward, but still below previous highs → lower high formation likely.
2️⃣ Key Levels
Resistance Zones
157.46 – 157.87 → Major supply zone marked on your chart
This is where liquidity sits, and where price could make a fakeout before reversing.
Support Zones
151.00 area → 0.618 retracement
149.00 area → 0.786 retracement
148.00 – 147.50 → deep correction zone (0.90 level)
These align well with typical pullback depths in a trending market.
3️⃣ Expected Move (Based on Your Projection)
Your chart suggests:
✔️ A possible pullback up to ~157.0–157.4
✔️ Then a strong bearish reversal
✔️ Targeting 151.00 first (0.618)
✔️ With potential extension to 149.00–148.00
This aligns with:
Channel midline break
Bearish divergence near the top
Loss of bullish momentum
4️⃣ Technical Bias
📌 Bias: Bearish Reversal Pending
As long as USDJPY remains below 157.80, bearish scenario is valid.
A retest of the previous supply zone is likely before the drop.

Potential bearish reversal?USD/JPY is rising towards the resistance level, which is a pullback resistance that aligns with the 50% Fibonacci retracement and could reverse from this level to our take profit.
Entry: 156.32
Why we like it:
There is a pullback resistance level that aligns with the 50% Fibonacci retracement.
Stop loss: 157.56
Why we like it:
There is a swing high resistance level.
Take profit: 154.30
Why we like it:
There is an overlap support level that is slightly above the 61.8% Fibonacci retracement.
Enjoying your TradingView experience? Review us!
Please be advised that the information presented on TradingView is provided to Vantage (‘Vantage Global Limited’, ‘we’) by a third-party provider (‘Everest Fortune Group’). Please be reminded that you are solely responsible for the trading decisions on your account. There is a very high degree of risk involved in trading. Any information and/or content is intended entirely for research, educational and informational purposes only and does not constitute investment or consultation advice or investment strategy. The information is not tailored to the investment needs of any specific person and therefore does not involve a consideration of any of the investment objectives, financial situation or needs of any viewer that may receive it. Kindly also note that past performance is not a reliable indicator of future results. Actual results may differ materially from those anticipated in forward-looking or past performance statements. We assume no liability as to the accuracy or completeness of any of the information and/or content provided herein and the Company cannot be held responsible for any omission, mistake nor for any loss or damage including without limitation to any loss of profit which may arise from reliance on any information supplied by Everest Fortune Group.

USDJPY - Time to buy nowUSDJPY Is in a very clear uptrend and has been for a while! It is currently inside an upward channel and has recently broken the last major resistance zone which means it is extremely likely to keep heading to the upside for much longer (just a very minor resistance level which is causing slight delays for its bullish movements). The next target will be the fibonacci extension zone which is shown on the chart. USDJPY has struggled to break below support but has constantly been breaking through resistance levels. buy USDJPY now.

USD/JPY - H4 - Breakdown Watch!(29.11.2025)📝 Technical Description FX:USDJPY
USD/JPY has been moving inside a clean ascending channel on the H4 timeframe.
Price is now sitting inside the Reversal Zone, struggling to break above the channel’s mid-line resistance. A bearish correction is possible if the market fails to reclaim the upper zone.
This setup remains a pending order, and requires confirmation before execution.*
📊 Trading Plan (My View)🔻 Bearish Scenario (Primary Setup)
If price rejects the Reversal Zone, expect a bearish channel breakdown.
Target a correction toward the key support zones shown on the chart.
🎯 Key Levels
Reversal Zone: 156.300 – 156.500
Support Zone (Target): 153.093
⚠️ Today’s Fundamental Updates – 29 Nov 2025
1️⃣ Bank of Japan Policy Sentiment Shifts
BoJ Governor Ueda hinted that an interest rate increase may come sooner,
as the government boosts spending to stimulate the economy.
➡ This generally strengthens the JPY, increasing downside pressure on USD/JPY.
2️⃣ US Dollar Weakness Drivers
Rising expectations of rate cuts from the Federal Reserve.
Treasury yields softening due to recession worries.
➡ A weaker USD supports the bearish setup on USD/JPY.
📌 Summary
Strong channel resistance + bearish fundamentals on USD → JPY
= High-probability reversal correction setup once confirmation appears.
⚠️ Wait for breakout confirmation before entering.
⚠️ Disclaimer
This analysis is for education only.
Not financial advice. Always trade with proper risk management.
❤️ Support the Work
If this analysis helped you,👉 Please LIKE 👍 & COMMENT 💬
Your support motivates me to post more high-quality setups daily!
#usdjpy #forex #forexanalysis #priceaction #channelpattern #technicalanalysis
#fxsignals #tradingview #chartanalysis #jpy #boj #fundamentals #usdweakness #reversalpattern

USDJPY H1 | Bearish Reaction Off Key ResistanceMomentum: Bearish
Price is currently within the bearish ichimoku cloud.
Sell entry: 155.967
- Strong pullback resistance
- 78.6% Fib retracement
- 127.2% Fib extension
Stop Loss: 156.459
- Swing high resistance
Take Profit: 155.517
- Overlap support
High Risk Investment Warning
Stratos Markets Limited (tradu.com/uk ), Stratos Europe Ltd (tradu.com/eu ):
CFDs are complex instruments and come with a high risk of losing money rapidly due to leverage. 70% of retail investor accounts lose money when trading CFDs with this provider. You should consider whether you understand how CFDs work and whether you can afford to take the high risk of losing your money.
Stratos Global LLC (tradu.com/en ): Losses can exceed deposits.
Please be advised that the information presented on TradingView is provided to Tradu (‘Company’, ‘we’) by a third-party provider (‘TFA Global Pte Ltd’). Please be reminded that you are solely responsible for the trading decisions on your account. Any information and/or content is intended entirely for research, educational and informational purposes only and does not constitute investment or consultation advice or investment strategy. The information is not tailored to the investment needs of any specific person and therefore does not involve a consideration of any of the investment objectives, financial situation or needs of any viewer that may receive it. Past performance is not a reliable indicator of future results. Actual results may differ materially from those anticipated in forward-looking or past performance statements. We assume no liability as to the accuracy or completeness of any of the information and/or content provided herein and the Company cannot be held responsible for any omission, mistake nor for any loss or damage including without limitation to any loss of profit which may arise from reliance on any information supplied by TFA Global Pte Ltd.

USDJPY:Our First And Second Entries Are Active, Let's Take ThirdOur USDJPY trade has gained 1400 pips from our initial and second entry. We’re now looking for the third potential swing buy. We’ve identified a possible reversal point and have two target levels. Please adjust your take profit and stop loss according to strict risk management.
If you like our idea, please like and comment. Also, follow us for more!
Team Setupsfx_

USDJPY – Intraday Bullish Continuation Idea After Recovery MoveReviewing USDJPY on the 15-minute chart.
Price has shown a strong recovery after forming a deeper low and is now pushing above short-term structure.
The marked level below represents the invalidation area where the bullish idea weakens.
The blue projection indicates a possible continuation path if momentum remains in favor.
This is shared purely for chart study and market observation.
✅ Analysis (Based on Your Markup)
Price created a clear swing low before starting a steady upward recovery.
Multiple minor higher highs and higher lows formed, showing improving bullish momentum.
The horizontal level at 155.548 is highlighted as an invalidation point—if price drops below it, the idea loses strength.
Current structure suggests buyers may remain active as long as price stays above that zone.
The upward blue arrow illustrates a potential continuation scenario toward higher intraday levels.
Overall, the chart reflects a short-term bullish outlook, depending on price holding above the marked invalidation line.

USDJPY: Short Trading Opportunity
USDJPY
- Classic bearish setup
- Our team expects bearish continuation
SUGGESTED TRADE:
Swing Trade
Short USDJPY
Entry Point - 156.06
Stop Loss - 156.38
Take Profit - 155.51
Our Risk - 1%
Start protection of your profits from lower levels
Disclosure: I am part of Trade Nation's Influencer program and receive a monthly fee for using their TradingView charts in my analysis.
❤️ Please, support our work with like & comment! ❤️

EURUSD: descending channel🛠 Technical Analysis: On the 4-hour timeframe, EURUSD is clearly moving within a descending channel, with price currently testing a major confluence of resistance. This resistance cluster is formed by the channel's upper trendline, the 100 and 200 SMAs, and a horizontal static zone around 1.1607. The "Global bearish signal" (Death Cross) identified earlier remains valid, reinforcing the downtrend. The projected trade anticipates a rejection from this heavy resistance, pushing the price back down toward the lower support zones, with an ultimate target near the channel's bottom at 1.1380.
🌍 Fundamental Analysis: Market liquidity is thin today in the wake of the US Thanksgiving holiday, which can lead to unpredictable or muted price action. Focus is shifting to next week's high-impact data, including Eurozone 'Flash' Inflation (Dec 2) and the crucial US Non-Farm Payrolls report (Dec 7). These releases will be vital in shaping the market's expectations for future ECB and Federal Reserve interest rate decisions, directly impacting the EURUSD exchange rate.
❗️ Trade Parameters (SELL) ❗️
➡️ Entry Point: Sell on rejection from the resistance zone (approx. 1.1600 – 1.1630)
🎯 Take Profit: 1.1468, medium-term target at 1.1380
🔴 Stop Loss: Above the resistance structure (approx. 1.1671)
⚠️ Disclaimer: This is a potential trade idea based on current analysis; market conditions and price direction are subject to change based on news factors and volatility.

a HighRisk QuickScalp on #USDJPY📌 Market Insight: {#USDJPY }
⚠️ Risk Assessment: {High}
🚀 Approach:
Not a Quality setup right now ... and need a valid LTF entry . without it , should skip this setup ... NO RUSH
#Ash_TheTrader #Forex #GBPJPY #MarketAnalysis #TradingSetup #RiskManagement #GOLD #Scalper #NQ #EURUSD

FED-BOJ and Yields DivergingUSDJPY momentum seems to be easing after testing the 158.50 resistance. The Takaichi trade has gone on a bit too long in our view, pushing the yen into intervention territory. It may be early to say it is finished, but fundamental signs are showing more and more yen-positive hints.
Recent remarks from Bank of Japan (BOJ) governor Ueda increased the odds of a rate hike at the December meeting. Ueda said they will look at the pros and cons of a rate move and make an appropriate decision, adding that even with a hike, monetary policy would still remain on the accommodative side. Market pricing now shows rate hike odds at 80 percent.
On the US side, despite many members speaking against a cut, recent data and comments from Waller and Williams pushed market expectations back in favor of a December cut, with odds at 91 percent.
The BOJ and the Fed are moving in different directions, and although the rate gap is still very wide, it is slowly narrowing.
The bond market reflects these diverging paths as well. US 10-year yields have fallen to 4 percent from 4.80 percent since the start of 2025, while Japanese yields have risen to 1.82 percent from 1.10 percent. At least on the Japan side, the yield rally is expected to continue with new fiscal measures and persistently high inflation.
The spread between US and Japanese yields is narrowing, just like the gap between their central bank rates. Will this trigger a reverse carry trade in 2026? It is hard to say, but it is a real possibility and could be an additional positive factor for the Japanese yen.
For the moment, USDJPY’s upside potential is limited because the threat of intervention is so close, while the downward potential extends below 140. The diverging directions of the Federal Reserve and the Bank of Japan, along with the opposite moves in their yields, all support a downward move.
The question is when and where the trend change will begin. With USDJPY, it is very difficult to predict how long extreme moves can continue, but the 158.50 resistance was one of the levels that could stop the advance, and yen bulls may have already started the move.

USDJPY My Opinion! BUY!
My dear friends,
USDJPY looks like it will make a good move, and here are the details:
The market is trading on 155.33 pivot level.
Bias - Bullish
Technical Indicators: Supper Trend generates a clear long signal while Pivot Point HL is currently determining the overall Bullish trend of the market.
Goal - 156.16
About Used Indicators:
Pivot points are a great way to identify areas of support and resistance, but they work best when combined with other kinds of technical analysis
Disclosure: I am part of Trade Nation's Influencer program and receive a monthly fee for using their TradingView charts in my analysis.
———————————
WISH YOU ALL LUCK

USDJPY H1 | Bearish Reaction Off Pullback SupportMomentum: Bearish
Price is currently below the ichimoku cloud.
Sell entry: 155.958
- Strong pullback resistance
- 50% Fib retracement
- 78.6% Fib projection
Stop Loss: 156.426
- Multi-swing high resistance
Take Profit: 155.344
- Swing low support
High Risk Investment Warning
Stratos Markets Limited (tradu.com/uk ), Stratos Europe Ltd (tradu.com/eu ):
CFDs are complex instruments and come with a high risk of losing money rapidly due to leverage. 70% of retail investor accounts lose money when trading CFDs with this provider. You should consider whether you understand how CFDs work and whether you can afford to take the high risk of losing your money.
Stratos Global LLC (tradu.com/en ): Losses can exceed deposits.
Please be advised that the information presented on TradingView is provided to Tradu (‘Company’, ‘we’) by a third-party provider (‘TFA Global Pte Ltd’). Please be reminded that you are solely responsible for the trading decisions on your account. Any information and/or content is intended entirely for research, educational and informational purposes only and does not constitute investment or consultation advice or investment strategy. The information is not tailored to the investment needs of any specific person and therefore does not involve a consideration of any of the investment objectives, financial situation or needs of any viewer that may receive it. Past performance is not a reliable indicator of future results. Actual results may differ materially from those anticipated in forward-looking or past performance statements. We assume no liability as to the accuracy or completeness of any of the information and/or content provided herein and the Company cannot be held responsible for any omission, mistake nor for any loss or damage including without limitation to any loss of profit which may arise from reliance on any information supplied by TFA Global Pte Ltd.

USDJPY Sell SetupTechnical Context
Break of Structure → Price broke last week’s low at 155.64, extending down to 154.70, confirming bearish momentum.
Supply Zone Retest → Price is now retesting the 155.40–155.70 supply zone on the 1H chart, offering a potential short entry area.
🎯 Trade Plan 🎯
Entry : 155.50 (below supply zone, 1H)
Stop Loss : 155.72 (above supply zone, 1H)
Target : 154.95 (above demand zone, 1H)
Risk–Reward: ~3.5x
⚠️ Disclaimer ⚠️This journal entry is for educational and documentation purposes only. It does not constitute financial advice or a recommendation to trade. All trading involves risk, and past performance does not guarantee future results. Always conduct your own analysis and consult with a licensed financial professional before making trading decisions.

USDJPY Pulls Back After Retesting Major Resistance, Momentum ModUSD/JPY has retreated from the 157.00 resistance area after a brief attempt to break higher, with price slipping back below the short-term rising trendline drawn from the October swing lows. This marks the first decisive violation of that trendline since the rally began, suggesting that upward momentum may be cooling.
The 50-day SMA continues to trend higher and remains above the 200-day SMA, keeping the broader structure constructive. However, the recent candle rejections near resistance indicate hesitation at the top of the multi-month advance.
Momentum indicators reflect this moderation. The MACD histogram has been flattening, with the signal and MACD lines narrowing after weeks of positive alignment. Meanwhile, RSI has turned lower from the upper 60s, moving toward its mid-range zone, showing that buying pressure has softened without yet indicating oversold conditions.
Overall, the current pullback highlights a shift from aggressive upside momentum toward a more neutral or consolidative posture. How price behaves around the rising moving averages and prior trendline region may offer additional context for whether buyers maintain control or if the pair transitions into a broader corrective phase.
-MW

Short opportunity On usd jpyAccording to Bollinger bands strategy
Accroding Breakout of Uptrendline
According to Fibo retracement
According to Gap (147.800-149.100)
According To CCI
We expect an Big Short Move to

USDJPY Intraday Supply Zone ReactionThe chart highlights a clear rejection from an intraday supply zone, where price interacted with a previously tested upper boundary near 156.392.
After returning to this area, the market showed a strong downward response, creating a continuation move to the lower levels.
The marked zone reflects an area of interest where price has shown consistent reaction.
This setup is presented for structure observation, focusing on how price responds around key zones and levels.
