GOLD → Correction to support amid a bullish trend FX:XAUUSD retreated from the $4,245 level reached on Monday. A countertrend correction is forming ahead of the news. But buyers are not sleeping...
Weak US economic data has heightened expectations of an imminent Fed rate cut. The PMI index in the US manufacturing sector continued to contract. The market estimates the probability of the Fed easing policy next week at 87%.
However, rising US Treasury yields and fears that the Fed may send cautious signals after its December decision are limiting gold's growth.
Market attention is shifting to ADP employment data and the US services business activity index (ISM Services PMI), which will be released on Wednesday. They will provide new signals about the health of the US economy.
The correction in gold appears to be under control amid continuing macroeconomic uncertainty. The 4200, 4193-4173 level remains an important area of struggle between bulls and bears.
Resistance levels: 4211, 4245
Support levels: 4193, 4173
A false breakdown and the bulls holding the market above the above support zone could trigger growth within the trend.
Best regards, R. Linda!
Fundamental Analysis

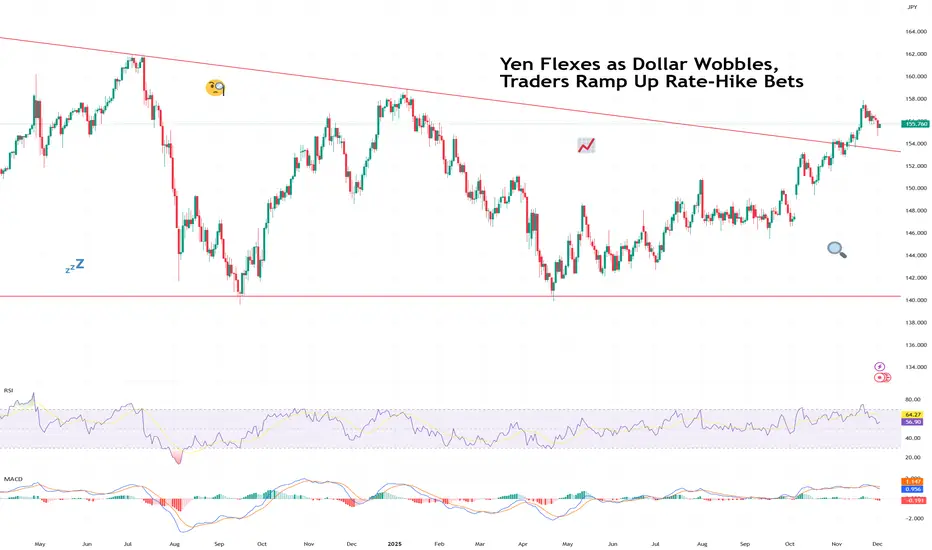
Yen Flexes as Dollar Wobbles, Traders Ramp Up Rate-Hike BetsThe yen came into Monday looking calm… and then proceeded to bench-press the dollar.
The FX:USDJPY pair slid under ¥155, hitting a session low of ¥154.65, after BoJ Governor Kazuo Ueda dropped one of the most powerful phrases in global FX:
“We will weigh the pros and cons of tightening.”
In Tokyo-speak, that’s basically suggesting “rate hike incoming!”
The greenback instantly shed over 100 pips (every day trader’s dream), a half-percent haircut that reminded traders just how exquisitely sensitive the yen is to hints of policy change after 30 years of ultra-loose money.
The next day, however, was a bit different. Early Tuesday morning, the pair gained back about half of what it lost the day before. Still, some things to note about Monday's slide:
It wasn’t just FX that reacted. The yen’s surge:
Knocked the Nikkei FX:JPN225 down 2%,
Pushed Japanese government bond yields to 17-year highs,
And forced traders to reprice Japan’s entire risk landscape in real time.
🕰️ The Market Has Been Waiting for This Moment
FX traders have been staring at the FX:USDJPY for months, waiting for a sign — any sign — that Japan was finally ready to pivot. In the meantime, officials have made a sport out of verbal interventions:
“We are watching FX moves with urgency.”
“We will not tolerate excessive yen weakness.”
“We have tools, and we are not afraid to use them.”
Translation: Stop shorting the yen, it stresses us out.
With Ueda openly weighing a rate hike at the December 19 Bank of Japan meeting, traders are scrambling to unwind one of the most crowded trades in global macro: the “short yen” position.
A country that’s really truly reluctant to raise rates is suddenly hinting at liftoff — or at least a step towards it.
📉 Dollar Wobbles as Macro Crosswinds Build
While Japan is drifting away from negative-rate territory, the US dollar faces a catalyst-packed December that could amplify or counter the yen’s breakout.
Four major US data releases stand between now and the BoJ’s meeting:
Dec 5: Fed’s preferred inflation gauge (PCE)
Dec 10: CPI inflation report
Dec 10: Fed interest-rate decision
Dec 16: Nonfarm payrolls (US jobs report)
If the Fed so much as hums a dovish note, yen strength could accelerate fast.
If Powell surprises with a hawkish tone, the dollar may find a floor.
Either way, this is the first time in years that both sides of the dollar-yen have meaningful rate catalysts.
🔄 A Trend Reversal in the Making?
Big macro traders — the same funds that spent the last year squeezing every drop out of the yen carry trade — are taking profits, reducing leverage, and even tiptoeing into long-yen bets.
When one of the world’s great one-way trades starts wobbling, liquidity thins, and volatility spikes.
This is precisely the environment where this volatile beast can swing 100 pips before your coffee cools.
And if Japan genuinely signals the start of a tightening cycle? Carry unwinds can get violent.
One central bank hint today can become a multi-month trend tomorrow.
🧭 So What Happens Next?
The yen’s flex this week may be just the opening act.
Everything now hinges on:
BoJ clarity on Dec 19
How soft (or not) US inflation comes in
Whether the Fed’s tone shifts on Dec 10
And how the labor market behaves into year-end
Watch the economic calendar and get ready for action. FX volatility is back on the menu.
Now that it’s happening, everyone’s asking the same question:
We’ll leave it to you : Was this a one-day pop — or the start of the yen’s long-awaited comeback tour? Share your views in the comments!
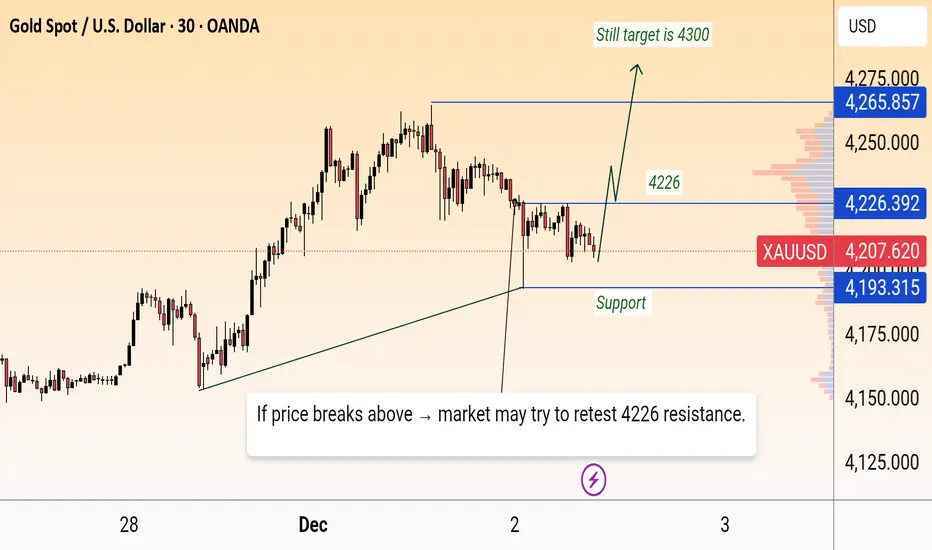
Gold updateGold is holding above the rising support trendline, showing early signs of strength after tapping the 4193 support zone. If buyers sustain momentum and break above 4226, price can move toward the higher resistance at 4265, with an extended upside target near 4300. However, staying below 4226 keeps the market in a choppy consolidation phase.
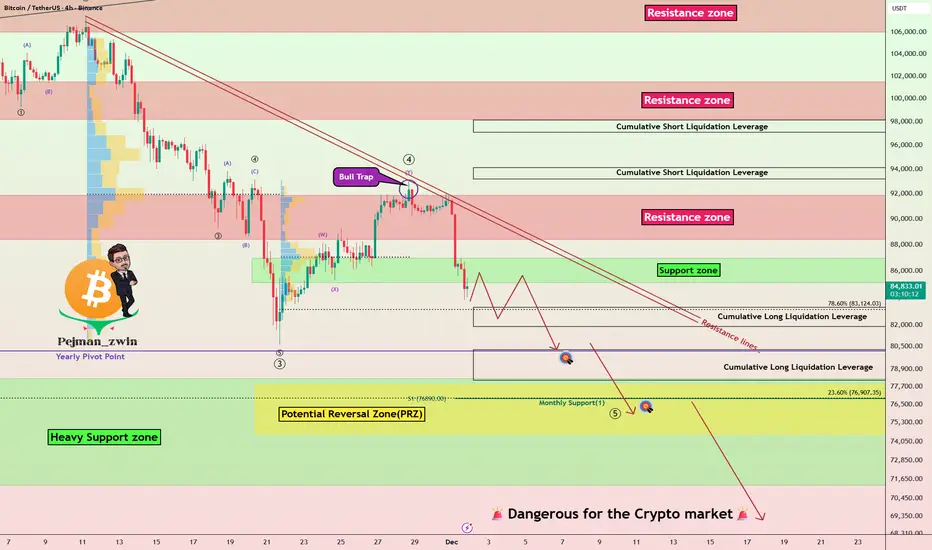
Bitcoin’s Worst November Ever — More Dump?In the past 24 hours, Bitcoin( BINANCE:BTCUSDT ) has dropped by more than -8%, marking its worst November performance ever, with a decline of about -17.67% this month alone.
Now, the question is whether Bitcoin will continue its downward trend or start to rebound. So, stay tuned!
At the moment, it seems that Bitcoin has successfully broken through the support zone($87,000-$85,130) and is moving toward the Cumulative Long Liquidation Leverage($83,273-$81,900).
From an Elliott Wave perspective, it appears that Bitcoin has completed its main wave 4, forming a bull trap, and is now in the process of completing the main wave 5.
On the fundamental side, we need to pay attention to a few key factors:
1-For one, the USDT.D% ( CRYPTOCAP:USDT.D ) is on the rise, and this could put downward pressure on the crypto market.
2-Another point is that the stock market is also trending upward, but unlike stocks, Bitcoin tends to react more negatively when the stock market declines.
3-The US 10-Year Government Bond Yield ( TVC:US10 ) also appears to be trending upward, causing riskier assets like stocks and Bitcoin to decline.
4-Additionally, geopolitical tensions, especially between the US and Venezuela over the past 72 hours, could also trigger further declines in Bitcoin if they escalate.
Considering all of this, I expect Bitcoin to continue its downward trend and test the heavy support zone($78,300-$71,280). The Potential Reversal Zone(PRZ) might serve as a rebound point for Bitcoin, but if the heavy support zone($78,300-$71,280) is broken, we could see a more severe sell-off in the crypto markets.
What do you think? Will Bitcoin drop below $70,000 or not? Let me know your thoughts!
Cumulative Short Liquidation Leverage: $97,100-$98,135
Cumulative Short Liquidation Leverage: $93,215-$94,130
Cumulative Long Liquidation Leverage: $80,263-$78,131
First Target: Cumulative Long Liquidation Leverage: $80,263-$78,131
Second Target: Potential Reversal Zone(PRZ)
Stop Loss(SL): $90,423
Points may shift as the market evolves
💡 Please respect each other's opinions and express agreement or disagreement politely.
📌Bitcoin Analysis (BTCUSDT), 4-hour time frame.
🛑 Always set a Stop Loss(SL) for every position you open.
✅ This is just my idea; I’d love to see your thoughts too!
🔥 If you find it helpful, please BOOST this post and share it with your friends.
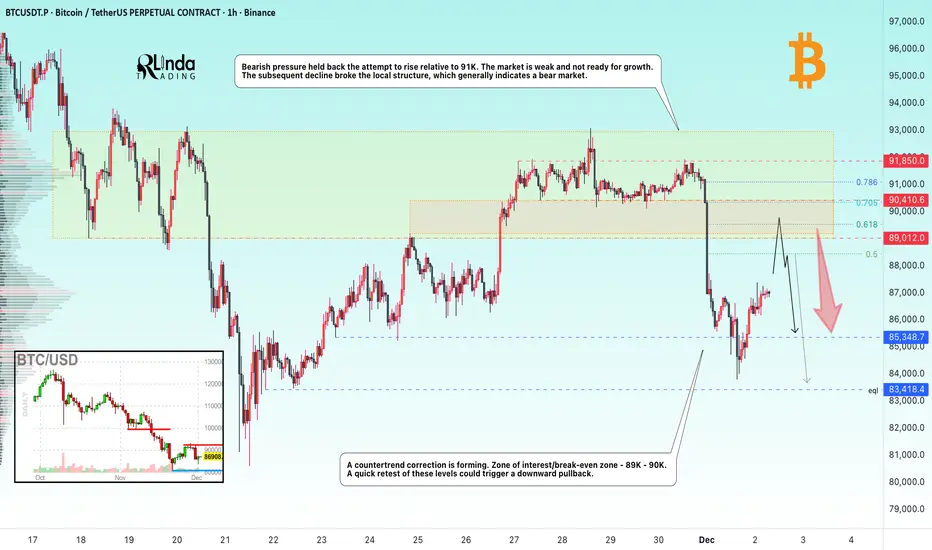
BITCOIN → The hunt for liquidity before the fallBINANCE:BTCUSDT.P continues to update lows within the global downtrend. The retest of 91K confirmed the dominance of bears...
The downtrend continues. The technical and fundamental situation for the crypto market is neutral to weak.
Bearish pressure held back the attempt to rise relative to 91K. The market is weak and not ready for growth. The subsequent decline broke the local structure, which generally indicates a bear market, but after updating the local minimum to 83700, a countertrend correction is forming. Zone of interest/break-even zone - 89K - 90K. A quick retest of these levels could trigger a downward pullback.
Resistance levels: 89K, 90K
Support levels: 85,400, 83,400
A retest of the range boundary and zone of interest could trigger a liquidity squeeze and a further decline if the bears keep the price below these boundaries.
Best regards, R. Linda!
EURUSD: Bearish Pressure Building at Critical ResistanceEURUSD: Bearish Pressure Building at Critical Resistance
EURUSD has once again reacted strongly to the major resistance zone that has held multiple times in the past. The pair tapped this level and immediately showed rejection, signaling that bullish momentum is weakening in this area.
After forming a symmetric consolidation structure and breaking upward, price is now struggling to sustain gains. The repeated rejection (highlighted) suggests that buyers are losing strength and a corrective move to the downside is likely.
If bearish pressure continues, the first target sits around 1.15300, followed by deeper retracement levels at 1.14700. A full correction toward the broader 1.14078 support zone is still possible if momentum accelerates.
As long as EUR/USD remains below this key resistance, the bearish path remains the more probable scenario. Only a clean breakout above the resistance zone would invalidate the setup and open the door for further bullish continuation.
You may find more details in the chart!
Thank you and Good Luck!
❤️PS: Please support with a like or comment if you find this analysis useful for your trading day❤️

AUDUSD: trendline breakout🛠 Technical Analysis: On the 4-hour timeframe, AUDUSD has broken above a key descending trendline and is currently testing immediate resistance near 0.65595. Although a "Global bearish signal" remains visible from the previous crossover, the recent price action suggests a bullish reversal if buyers can clear this short-term obstacle. The projected trade setup anticipates a confirmed breakout above this level, opening the door for a rapid rally toward the main resistance zone at 0.66200.
🌍 Fundamental Analysis: Volatility is expected to increase towards the end of the week amid Australian GDP data and key US data on Friday and Thursday. Traders are also exercising caution ahead of next week's Fed meeting, but this is more relevant to the medium-term outlook.
❗️ Trade Parameters (BUY) ❗️
➡️ Entry Point: Buy on breakout above short-term resistance (approx. 0.65600 – 0.65650)
🎯 Take Profit: 0.66200 (Major Resistance Zone)
🔴 Stop Loss: Below the recent consolidation (approx. 0.65369)
⚠️ Disclaimer: This is a potential trade idea based on current analysis; market conditions and price direction are subject to change based on news factors and volatility.

#BITCOIN: Still Expecting Price To Touch $60K To $65K! Bitcoin is likely to drop further down before we could see a strong bullish move taking price to all time high. This is our view only and it is not an guaranteed move; once price touch our reversal zone then we could see price going back to all time high. Good luck and trade safe!
Team Setupsfx_
Like And Comment Our Ideas For More Such Educational content! 📊🚀

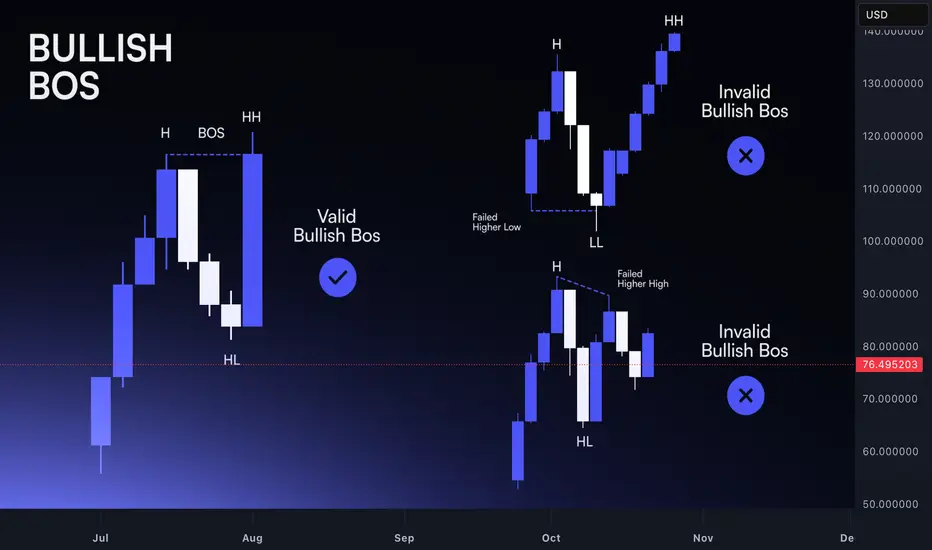
Break of Structure: Identifying Real Trend Shifts Markets move in phases, and structure is the clearest way to read those transitions. A trend doesn’t reverse because price slows down or because a candle looks different. It reverses when the underlying pattern of highs and lows breaks.
Understanding this sequence is what separates disciplined analysis from reactive guessing.
In an uptrend, buyers defend higher lows and push price into higher highs. As long as this structure holds, the trend is intact. Noise may create deep pullbacks or temporary hesitation, but the narrative remains unchanged.
The first sign of vulnerability appears when price fails to create a meaningful higher high. Momentum stalls, and the next push upward shows less conviction.
The real shift comes when a higher low is taken out. This is the break of structure. It shows that buyers no longer control the market, and sellers have absorbed enough liquidity to push through a prior defensive point.
This is not a prediction; it’s an objective change in the market’s behaviour. A single candle doesn’t define it. The sequence does.
For downtrends, the logic is the same in reverse. Lower highs and lower lows define control. When price fails to print a clean lower low and then breaks a prior lower high, the trend loses integrity. Structure reveals the turning point before sentiment catches up.
However, not every break is a real shift. Crypto produces countless intraday spikes that violate levels without altering the broader narrative.
The difference lies in context. A valid break is supported by:
– Clear momentum into the break
– Liquidity taken before the shift
– Follow-through after the level is broken
– A retest that confirms the new direction
These factors filter out noise and highlight genuine transitions. Watching price break structure is not enough; you must also assess whether the move fits within the larger story of the trend.
A break of structure doesn’t mean instant reversal. It means the previous trend has ended. The next phase might be consolidation, re-accumulation, or immediate reversal, but the bias shifts the moment structure changes.
Traders who read structure objectively adjust earlier and avoid fighting a direction that no longer has control.
Once you internalize how highs and lows interact, spotting real shifts becomes a structured process instead of an emotional reaction. Structure turns confusion into clarity and gives you a reliable framework for navigating both trends and transitions.
EU's Consolidation ExpandsHere on FX:EURUSD we can see that Price has been trading between a Rising Resistance and Falling Support or Higher Highs and Lower Lows.
This forms an Expanding Range!
Currently the range is between:
- High: 1.16232
- Low: 1.15912
Until we get a clear cut Breakout of either leg, this Price Action will remain in a battle of Tug-O-War between Bears and Bulls.
*The Breakout will need to be accompanied by a large amount of volume to verify!
Fundamentally, both EUR and USD have impactful news coming out this week with the ECB recently stating they could be at the end of their easing cycle with cuts and the Federal Reserve looking at an 87% chance of another Interest Rate Cut at the Dec. 10th meeting.
Stay vigilant!

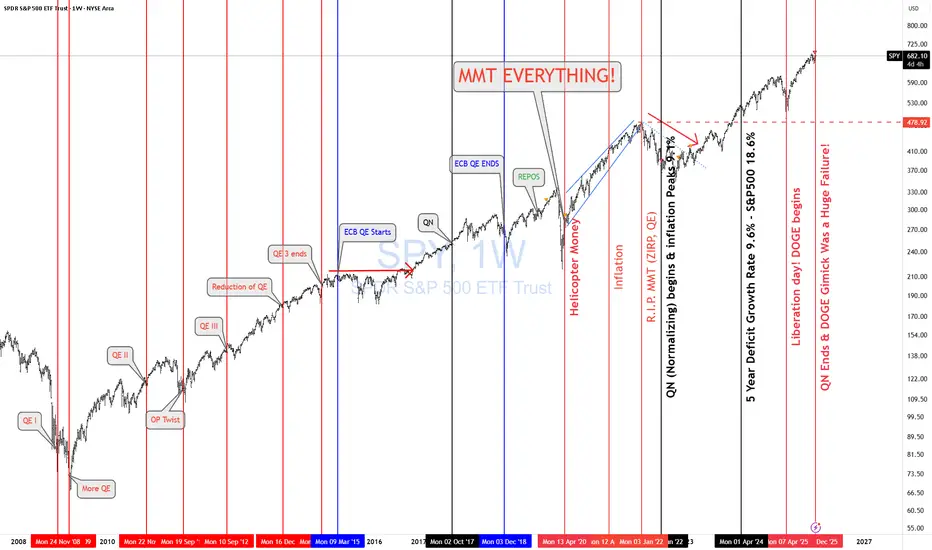
SPY & Macro HistoricalToday FED ended QN (Quantitative Normalizing NOT "T" = tightening. 1st, you normalize, then you tighten. Right??)
The Fed is continuing to let mortgage-backed securities roll off its balance sheet, while the U.S. Treasury increases T-bill issuance (cash-like instruments). That combination means more gov securities are hitting the market even as the Fed’s balance sheet stays roughly unchanged.
More Treasury supply + no Fed buying = higher yields and tighter liquidity. More MBS roll-off = higher mortgage rates and pressure on housing. Treasury bills soak up cash, while longer bonds suffer.
🔥 REALMACRO summary:
The Fed is doing this to:
Get out of the mortgage market.
Strengthen the Treasury bill market (the foundation of dollar liquidity).
Keep bank reserves “ample” without restarting QE.
This combo lets them tighten just enough to cool asset prices, without breaking the plumbing again like in 2019.
The success of this experiment will largely determine how long the Fed can avoid returning to QE. If liquidity tightens too far as the economy continues to weaken, they’ll be forced back into some form of balance sheet expansion sooner rather than later.
Lastly, let's check how right I was when I posted "MMT Everything."
As of April 2020, US debt was $ 24T. Today, it is $38T, representing a total increase of $14T in 5 years.
✅ CAGR ≈ 9.6% per year
✅ S&P 500 CAGR (Apr 2020 → Today): ~18.6% per year
Both are completely unsustainable growth rates.
I nailed that back in April 2020. Trump & MMT "print and play" will be the death of us! SIGH!
Lastly, the DOGE gimmick was a complete and total failure as expected. No reduction in deficit and no fraud found. Imagine that!
As I keep saying, " NEVER INVEST IN TOXIC PEOPLE! THEY WILL ALWAYS BURN YOU IN THE END!" It's not political it's a FACT!
THANK YOU for getting me to 5,000 followers! 🙏🔥
Let’s keep climbing.
If you enjoy the work:
👉 Drop a solid comment
Let’s push it to 6,000 and keep building a community grounded in truth, not hype.
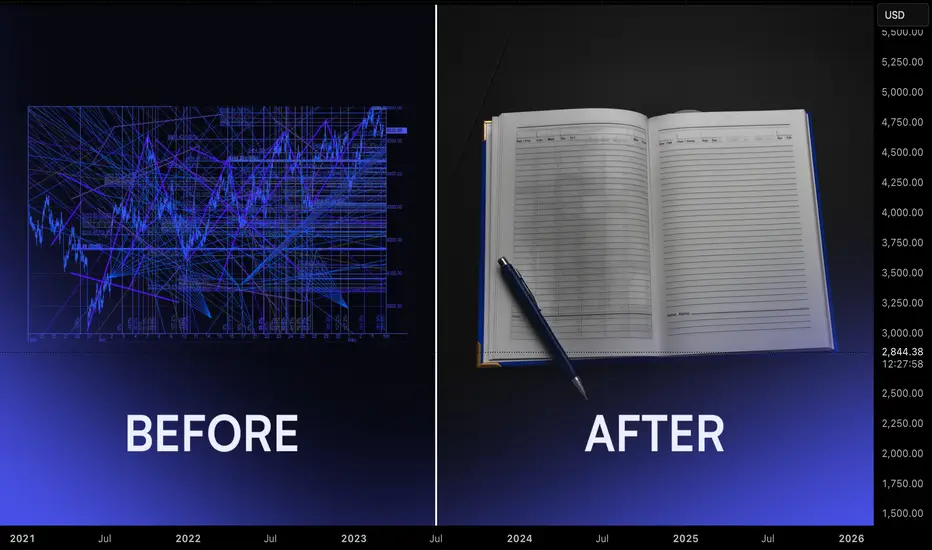
Journaling For Traders: Turning Random Results Into A Feedback Most traders spend years tweaking indicators and strategies while leaving their process undocumented. Without a journal, every trade feels new, every mistake repeats, and progress stays vague. A structured journal turns experience into data. It shows what you do well, what keeps failing, and which behaviours appear before your best and worst decisions.
The first step is simple: record every trade. Log the setup, market structure, entry reason, risk, and emotional state. Write whether you felt rushed, confident, bored, or frustrated. Do not only record wins or big losses. Incomplete data keeps blind spots alive.
The real value appears during weekly review. Set time aside after markets slow down and go through the trades as a batch. Look for recurring situations. You may notice that late-session entries perform poorly, that you increase size after wins, or that you cut trades early when size feels uncomfortable. These patterns are not visible inside a single session. They emerge only over a cluster of trades.
Next, extract insights. Group trades by setup, session, and emotional state. Identify your highest quality combinations. For example, trend continuation trades in London with fixed risk might show a strong performance profile while countertrend entries in low volume hours consistently underperform. This step separates what you think works from what actually delivers.
Finally, adjust strategy. Turn observations into rules. Reduce or remove the behaviours that repeatedly drain capital. Formalise the conditions that define your best trades. Add small process rules rather than full rewrites, then track the impact in the next review cycle. Over time, your playbook becomes evidence based rather than theoretical.
Journaling is not an extra task for perfectionists. It is the operating system behind professional execution. When you continuously record, review, extract, and adjust, your trading process compounds in quality even when individual weeks are difficult.
Why USD is a forex King !USD continues to show why it’s considered the king of the forex market—its strength sets the tone across major pairs. I’m watching how its momentum influences broader market structure

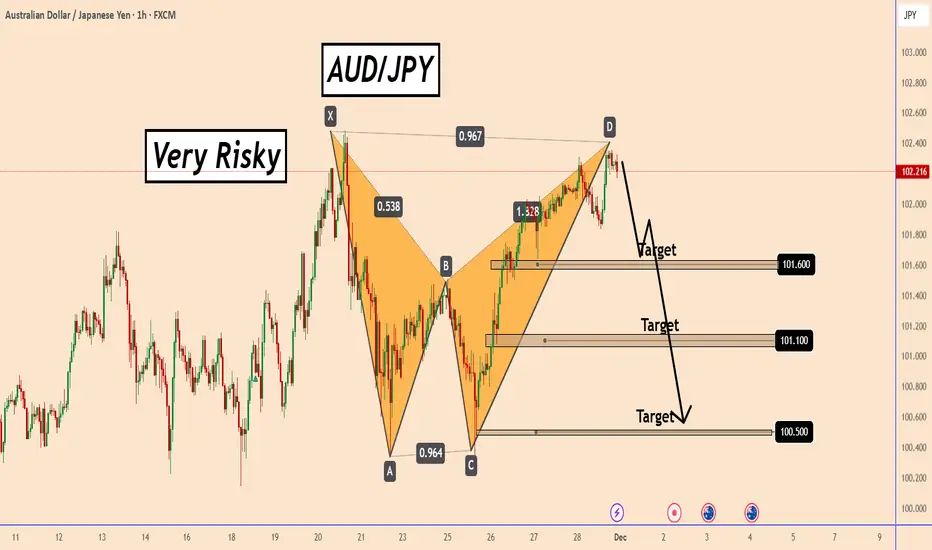
AUDJPY: Why is AUDJPY a higher-than-normal risk setup?AUDJPY: Why is AUDJPY a higher-than-normal risk setup?
AUDJPY has completed a clear bearish pattern; however, it remains a very high-risk trading setup.
The pattern suggests that the price could soon start falling to 101.60; 101.10 and 100.50.
The risk in this setup remains that the BOJ is unclear about what it is doing. The Japanese Prime Minister is supporting further weakening of the JPY and on the other hand the BOJ sent out some Forex Intervention messages and last week they said they should raise interest rates.
At the market opening on Monday, BoJ Governor Ueda is expected to speak. He could easily push the price up or down. However, this setup indicates potential weakness.
You may find more details in the chart!
Thank you and Good Luck!
❤️PS: Please support with a like or comment if you find this analysis useful for your trading day❤️
Bullish Analysis 15M-Gold Breakdown – XAU/USD
✨ Clean structure, institutional narrative, and a clear bullish roadmap.
🔹 1. Bearish Liquidity Mitigation (Sell-Side Liquidity)
The market completed its job by sweeping all sell-side liquidity below previous lows 🟠.
This provides the fuel institutions need to build long positions at discount levels. 🔥
🔹 2. Institutional Reversal from the POI
After the liquidity grab, price taps your POI at 4,190 and shows a sharp rejection 🔁.
This is a strong indication of bullish institutional intent. ✔️
🔹 3. Fake Out + Bullish BOS
The fake out was used to trap late sellers ❌ while big players loaded longs.
The following bullish BOS confirms the shift in character and trend direction. 📈
🔹 4. Projected Path Toward Buy-Side Liquidity
Price is now targeting upside liquidity and higher-timeframe inefficiencies. 🎯
🎯 Institutional Targets (TPs)
• TP1 – 4,230: internal liquidity sweep 💧
• TP2 – 4,254: FVG mitigation ⚡
• TP3 – 4,277: continuation of bullish impulse 📊
• TP4 – 4,300: major liquidity grab / expected HH 🏆

The MicroStrategy Bitcoin Bottom!Today MicroStrategy formed a beautiful daily chart bottoming tail on extreme volume.
Its truly a picture perfect reversal signal.
This reversal came on the back of BTC being very weak and still down 5% at market close.
Michael Saylor announced an addition of a 130BTC purchase, but also has set aside a billion dollar expense fund if he needed to sell some BTC.
The likely hood of MSTR having to sell BTC is very unlikely.
We traded MSTR today for a lovely gain. Riding 180 calls to the upside.

AUD/NZD: Post-RBNZ recovery may stall as rates test resistance The AUD/NZD is an interesting pair to watch. At the time of writing, it was testing key resistance here between 1.1450 to 1.1500 - major highs in previous years had been formed there. The exchange rate went above this zone a few weeks ago but failed to hold there. And last week it sold off after the RBNZ was hawkish as it signalled no more rate cuts were forthcoming. This means that on balance the risks are tilted to the downside so long as this area of resistance holds now. This is where the sellers might step in again after a brief bounce at the start of this week. I am not expecting a major sell-off, because the RBA is equally neutral, but a drop to low 1.13s should come as major surprise. That said, if no selling pressure is exerted here and soon, this would be a sign of trouble for the bears, especially if rates go on to break above the high of Wednesday's range at 1.1527 - if this level is crossed then this bearish scenario would become invalidated.
By Fawad Razaqzada, market analyst with FOREX.com

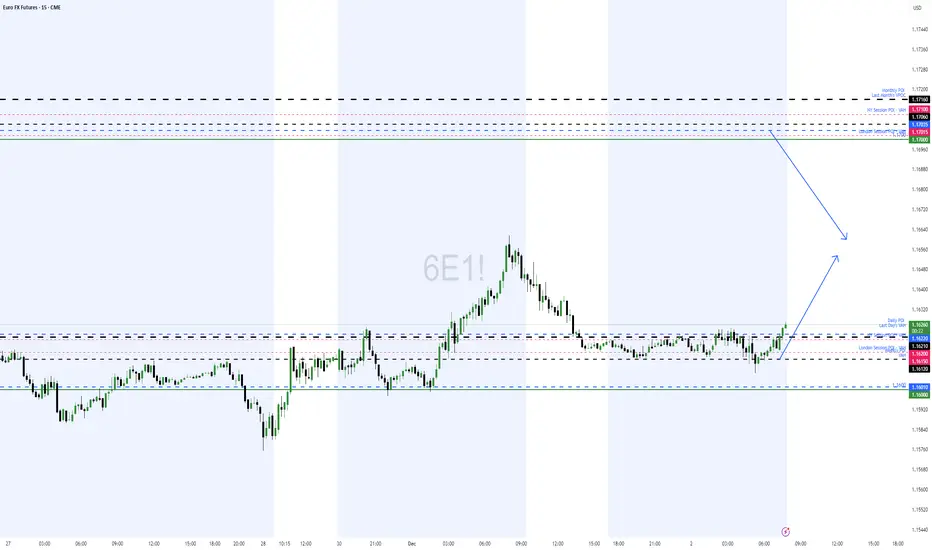
Value Suggest 6e is cheap. Looking at the monthly Vol profile o euro i see 1.162 as a key level to buy and price can be bought and sold at 1.175. but everything comes down to orderflow and what the buyers think.
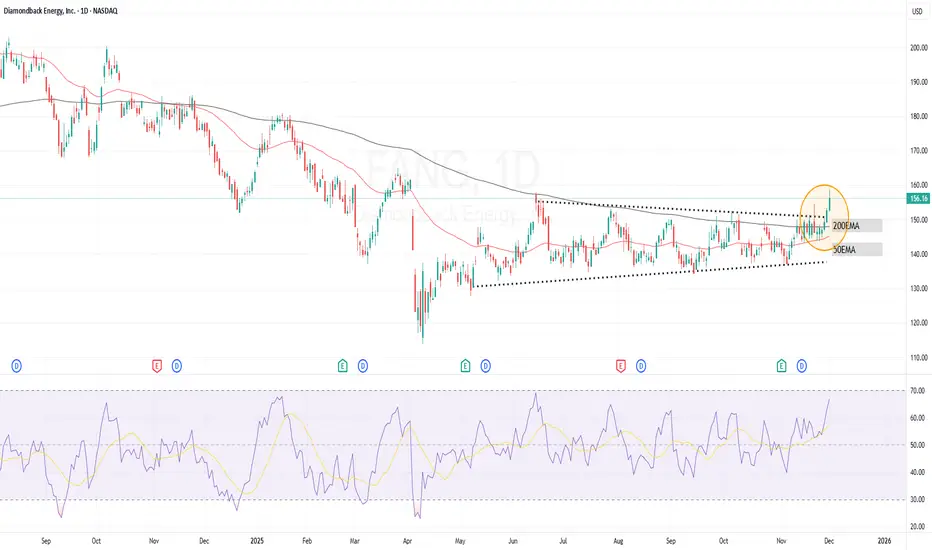
$FANG stock price analysis
Some of my students have asked me about the NASDAQ:FANG stock. So here is my analysis.
Fundamentally speaking, Diamondback Energy delivered a solid earnings beat this Q, with revenue and EPS exceeding expectations. Margins remain strong, free cash flow is healthy, and the company continues aggressive capital returns through dividends and substantial share buybacks.
Post-Earnings, the stock is attempting to reverse its prior downtrend. Operational performance appears stable, and reduced CAPEX suggests a disciplined, defensive stance prioritising cash flow over expansion.
Looking at the 1D chart, despite the channel breakout, the medium-term structure is not yet fully supportive of a buy. The 50EMA remains below the 200EMA, signalling an incomplete trend reversal. Price is improving, but confirmation is still lacking. Would wait for the 50EMA to cross over the 200EMA followed by consistent price action above the 50EMA, before thinking of any entry.
ETHUSDT UPDATEReaction to the support zone 1 was stronger than I expected.
The news about Ukrine also wasn't without impact.
If the daily candle closes above the previous three candles, it looks like a good setup for taking a long position.
I'll personally enter with about 15-20% of my usdt asset.

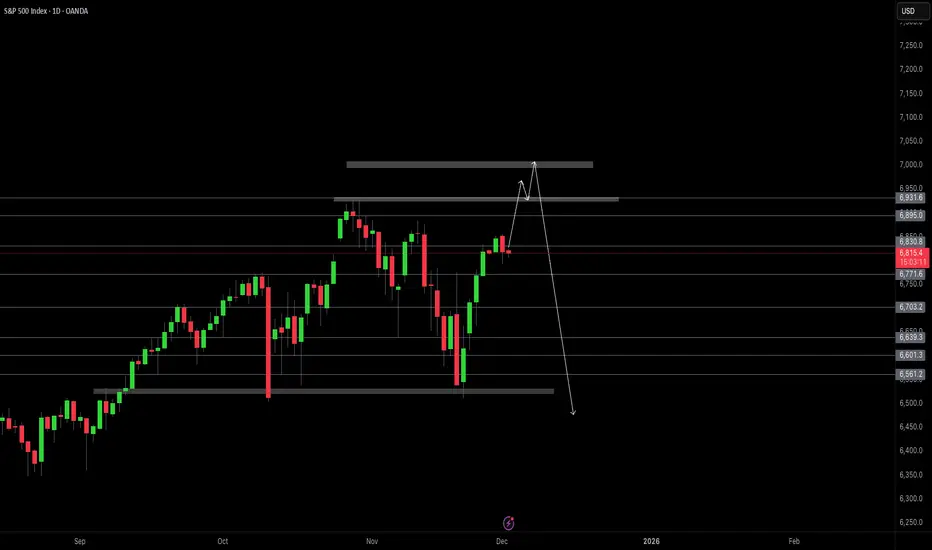
S&P500 Idea FOMCBias until Dec FOMC:
We will be looking to continue to ride the Fed rate cuts odds increased on the markets as that is still holding most weight at the moment and will most likely continue to do so until the FOMC decision on 11 December.
The markets have been primarily pricing in the rate cut expectations 30 days well before the actual FOMC decision, there during the actual Rate decision release, we barely get any impact and we get markets repositioning for any future guidance to come. Basically a case of ‘Buy the rumour and Sell the news’’ play.
- Because at the moment, we have been seeing rate cut probabilities increasing to 85% which has been holding most weight for Gold upside and giving the greedy intuitions a reason to further buy up risk assets.
However,
- This doesn't mean that Dec is a guaranteed rate cut, and during the December FOMC, the fed may either cut rates by 25bps or Hold rates, and if there future guidance remarks are hawkish since inflation is still elevated - then we can see Profit taking on risk assets. Therefor expect to see Gold bears, DXY bulls, BTC Bears, Stock bears.
So until the actual December FOMC, If December Rate cut probabilities are still elevated (80%+), then, we can still expect Buyers in control on Risk assets, so:
- DXY - Downside.
- GOLD - Upside , potentially retest upto previous ATH’s $4380’s. Then Profit taking post FOMC.
- US Stocks - Upside on SPX to make New ATH’s and bearish wave if Dec FOMC hawkish.
- BTC - Upside to 100k, prev supply zone before Correction bearish phase.
How to Build a Consistent Execution Checklist on TradingViewMost trading mistakes don’t come from bad strategy, they come from inconsistent execution.
An execution checklist removes guesswork and replaces it with structure.
When your actions follow a routine, your results stabilize.
TradingView gives you everything you need to build a checklist that stays visible, actionable, and tied directly to your chart.
1. Define Your Core Conditions
Before any trade, the bigger picture must be clear.
Start your checklist by answering three questions:
What is the higher-timeframe direction
Where is price relative to key levels
Is price approaching with strength or weakness
Use TradingView’s drawing tools to mark support, resistance, value zones, and session highs and lows.
Add a simple text note on the chart listing your core conditions so they are always visible.
If the market context fails this first screen, the trade is already invalid.
2. Build Confirmation Criteria
Once structure is confirmed, you move to evidence.
Mark confirmation areas directly on your chart:
Liquidity pools
Fair value zones or imbalances
Previous session highs and lows
Asian range or New York open
If your strategy uses indicators, document exact conditions:
Moving average position and slope
Volume behavior
VWAP location
Volatility expansion or contraction
Define rules that don’t change based on emotion.
Confirmation should prove your bias, not justify your urge to trade.
3. Validate Risk Before Execution
Every setup must survive a risk checkpoint before it’s allowed to go live.
Your checklist must answer:
Where is my invalidation level
How much capital am I risking
Does this violate any daily limits
Is the reward worth the risk
Use TradingView’s long or short position tool to visualize risk directly on the chart.
Save it as a template so your risk process stays uniform across all trades.
No trade is valid if risk isn’t clean.
4. Create a Pre-Execution Routine
A checklist only works if you actually follow it.
Add a short pre-trade process directly to your chart notes using checkboxes or bullet points:
Example execution checklist:
Market phase confirmed
Level identified
Confirmation present
Risk valid
Entry condition active
Walk through this list before clicking buy or sell.
If one item fails, the trade fails.
Over time, this routine removes emotional impulse completely.
5. Review and Refine Weekly
Your checklist isn’t static, it evolves.
Every week ask:
Where did I break my rules
What conditions led to losses
Which confirmations work best
What rules saved me from bad trades
Use TradingView’s trade replay and journaling features to review execution quality, not just profit.
Consistency improves when your system evolves with you.
Final Thought
A checklist doesn’t restrict your trading, it frees you from emotion.
When your process is clear, your confidence increases.
When your confidence increases, discipline follows.
Good traders make decisions.
Great traders execute procedures.
Stay Green!
Bitcoin rejection setup at 88k with downside targets.SETUPS
Timeframe 15 minutes.
Price 88,478.03 on the chart.
Clear red order block around 88k to 88.2k.
Higher resistance cluster near 90,507.
Support cluster around 86,982 and 85,017.
Light blue boxes mark fair value gaps and likely liquidity targets.
What I see
Price has rallied into a known supply zone.
Volume increased into the zone. That often signals liquidity testing.
Recent structure shows lower highs into resistance.
Below there are stacked supports that serve as logical profit targets.
Trade idea 1, aggressive short (enter now)
1.Entry 88,478.03 market short.
2.Stop 88,800.00. Risk per BTC = 321.97.
3.Target 1 86,982.43. Profit = 1,495.60. Reward to risk = 4.65 to 1.
4.Target 2 85,017.50. Profit = 3,460.53. Reward to risk = 10.75 to 1.
5.Execution notes Take partial at T1. Move stop to breakeven after first partial. Trail remaining position to protect profit.
Trade idea II, conservative short (wait for confirmation)
1.Wait for a clean rejection candle or wick into the red zone followed by a momentum candle down.
2.Enter on the break below the low of the rejection candle.
3.Stop above the wick high, use 88,800 as a reference.
4.Targets same as Trade 1.
5.This lowers false breakout risk and improves odds.
Alternate trade, breakout long
1.Trigger on a decisive close above 88,800 with expanding volume.
2.Entry 88,900 on retest or immediate on strong breakout.
3.Stop 88,200. Risk per BTC = 700.00.
4.Target 1 90,507.04. Target 2 90,521.42 to 92,928 range.
5.Use a stop tight and scale out into resistance.
Position sizing rule
1.Risk only a fixed percent of your account per trade. Typical range 0.5 to 2 percent.
2.Position size = (account equity * risk percent) / (per BTC dollar risk).
3.Use limit entries when possible and guaranteed stops.
Checklist before you act
1.Confirm volume supports the move.
2.Confirm candle structure shows rejection for shorts or follow through for longs.
3.Watch for quick liquidity sweeps above the order block. If you see a sharp wick up then strong rejection, that favors the short.
4.Avoid large position sizes into unclear structure.
Final note
This plan uses visible order blocks, fair value gaps, and liquidity areas on the 15 minute chart.
