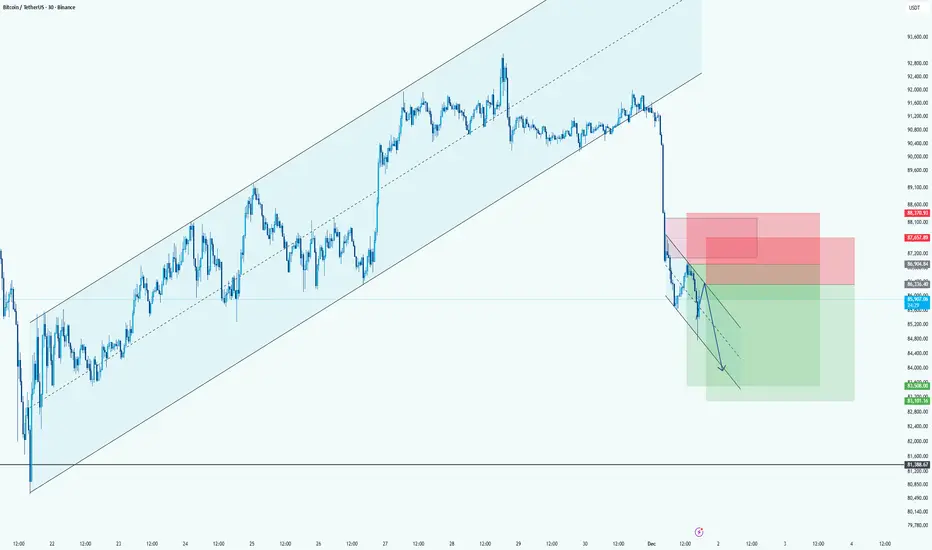
BTC: Bearish Continuation Setup After Major Channel BreakdownHi!
Price broke hard below the long-term ascending channel, confirming a clear shift from bullish to bearish momentum.
After the breakdown, BTC is moving in a small descending correction channel, creating a classic lower-high retracement toward supply.
Direction: Short
Entry Area: 87,200 – 88,300 (two stacked red zones)
Stop-Loss: Above 88,700–89,000 (top of supply)
Target: 83,000 – 84,800 (large green demand area)
Beyond Technical Analysis
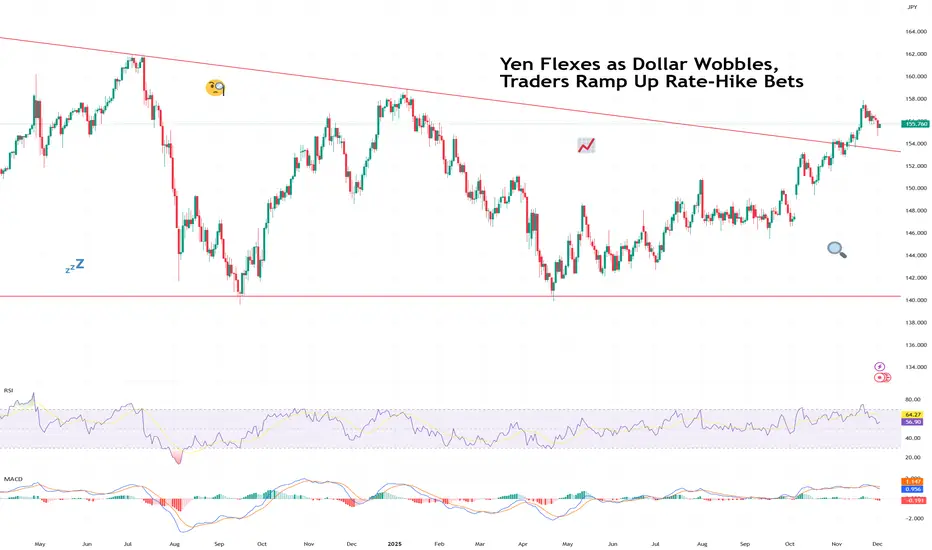
Yen Flexes as Dollar Wobbles, Traders Ramp Up Rate-Hike BetsThe yen came into Monday looking calm… and then proceeded to bench-press the dollar.
The FX:USDJPY pair slid under ¥155, hitting a session low of ¥154.65, after BoJ Governor Kazuo Ueda dropped one of the most powerful phrases in global FX:
“We will weigh the pros and cons of tightening.”
In Tokyo-speak, that’s basically suggesting “rate hike incoming!”
The greenback instantly shed over 100 pips (every day trader’s dream), a half-percent haircut that reminded traders just how exquisitely sensitive the yen is to hints of policy change after 30 years of ultra-loose money.
The next day, however, was a bit different. Early Tuesday morning, the pair gained back about half of what it lost the day before. Still, some things to note about Monday's slide:
It wasn’t just FX that reacted. The yen’s surge:
Knocked the Nikkei FX:JPN225 down 2%,
Pushed Japanese government bond yields to 17-year highs,
And forced traders to reprice Japan’s entire risk landscape in real time.
🕰️ The Market Has Been Waiting for This Moment
FX traders have been staring at the FX:USDJPY for months, waiting for a sign — any sign — that Japan was finally ready to pivot. In the meantime, officials have made a sport out of verbal interventions:
“We are watching FX moves with urgency.”
“We will not tolerate excessive yen weakness.”
“We have tools, and we are not afraid to use them.”
Translation: Stop shorting the yen, it stresses us out.
With Ueda openly weighing a rate hike at the December 19 Bank of Japan meeting, traders are scrambling to unwind one of the most crowded trades in global macro: the “short yen” position.
A country that’s really truly reluctant to raise rates is suddenly hinting at liftoff — or at least a step towards it.
📉 Dollar Wobbles as Macro Crosswinds Build
While Japan is drifting away from negative-rate territory, the US dollar faces a catalyst-packed December that could amplify or counter the yen’s breakout.
Four major US data releases stand between now and the BoJ’s meeting:
Dec 5: Fed’s preferred inflation gauge (PCE)
Dec 10: CPI inflation report
Dec 10: Fed interest-rate decision
Dec 16: Nonfarm payrolls (US jobs report)
If the Fed so much as hums a dovish note, yen strength could accelerate fast.
If Powell surprises with a hawkish tone, the dollar may find a floor.
Either way, this is the first time in years that both sides of the dollar-yen have meaningful rate catalysts.
🔄 A Trend Reversal in the Making?
Big macro traders — the same funds that spent the last year squeezing every drop out of the yen carry trade — are taking profits, reducing leverage, and even tiptoeing into long-yen bets.
When one of the world’s great one-way trades starts wobbling, liquidity thins, and volatility spikes.
This is precisely the environment where this volatile beast can swing 100 pips before your coffee cools.
And if Japan genuinely signals the start of a tightening cycle? Carry unwinds can get violent.
One central bank hint today can become a multi-month trend tomorrow.
🧭 So What Happens Next?
The yen’s flex this week may be just the opening act.
Everything now hinges on:
BoJ clarity on Dec 19
How soft (or not) US inflation comes in
Whether the Fed’s tone shifts on Dec 10
And how the labor market behaves into year-end
Watch the economic calendar and get ready for action. FX volatility is back on the menu.
Now that it’s happening, everyone’s asking the same question:
We’ll leave it to you : Was this a one-day pop — or the start of the yen’s long-awaited comeback tour? Share your views in the comments!
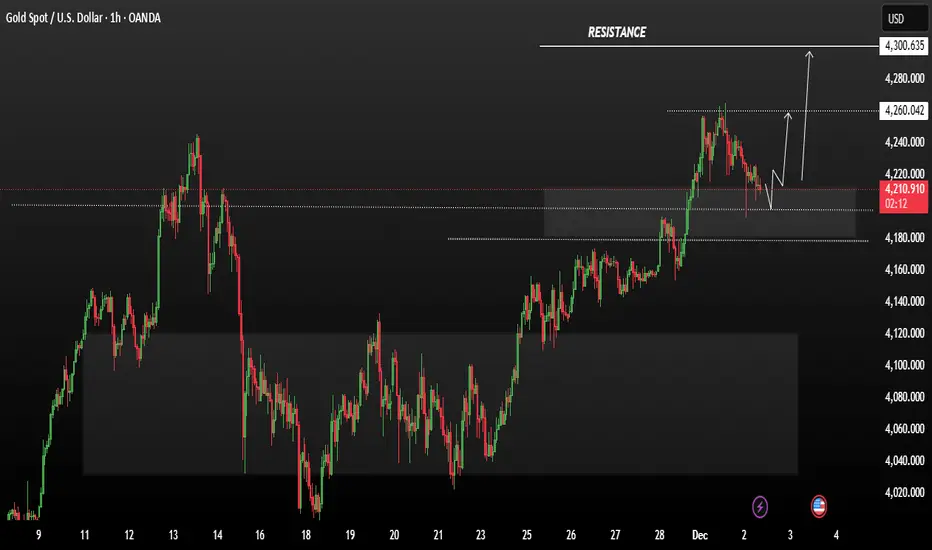
GOLD Consolidation bullish run momenmtumGold moved into consolidation after a bullish run. The metal pulled back to $4110/oz on Tuesday as investors booked profits following Monday’s six-week high. The market is now focused on U.S. interest rate expectations, with growing anticipation of a rate cut next week. Traders are also awaiting remarks from Federal Reserve Chair Jerome Powell later today for additional guidance on the Fed’s rate trajectory.
Price retested the 4205 zone and rebounded, indicating a healthy pullback within the uptrend If bulls successfully hold the 4210 support range, upward momentum could strengthen quickly On the upside, the next major resistance levels to watch are 4260 and 4300.
You may find more details in the chart.
Trade wisely best of luck buddies.
Ps; Support with like and comments for better analysis thanks for supporting.
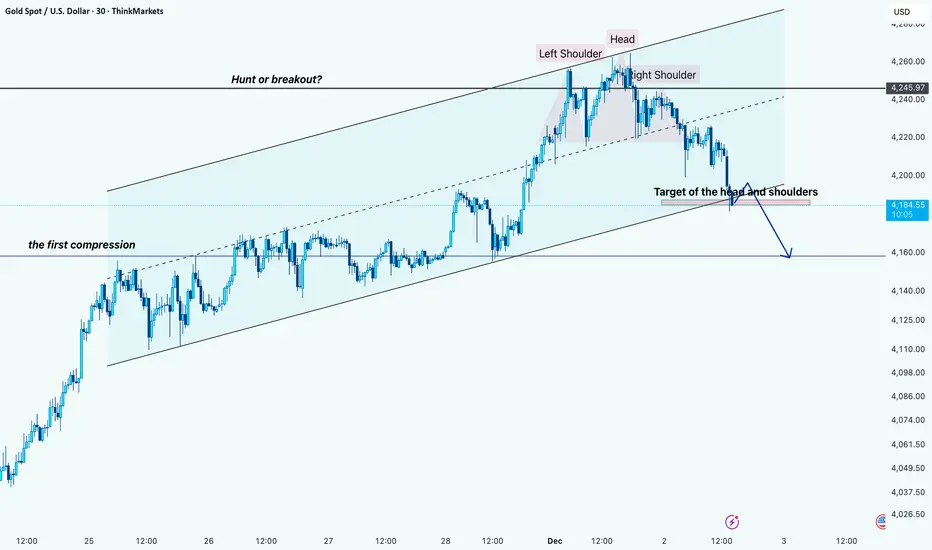
Gold Reversal in Motion: Head & Shoulders Breakdown Hi!
Market Structure
Gold has been moving inside a clean ascending channel, with price respecting both upper and lower boundaries for several days. Earlier in the trend, we saw the first compression phase along the dashed mid-line, which later fueled the strong push toward the channel top.
Liquidity Zone – Hunt or Breakout?
At the channel’s upper boundary, price tapped a key horizontal level. The spike above it looks more like a liquidity hunt than a real breakout—buyers were trapped, and the market quickly rejected from this zone.
Reversal Pattern – Head & Shoulders
After the rejection, a clear Head and Shoulders pattern formed exactly at the top of the channel
The neckline was positioned just above the dashed trendline. Once the neckline broke, momentum shifted sharply bearish, confirming the pattern.
Target & Expected Path
The chart shows the target of the Head and Shoulders, aligned perfectly with the lower boundary of the ascending channel. This creates a strong confluence around the 4,160 area.
The projected move suggests a possible minor pullback or neckline retest before continuing downward.
Overall, the chart signals a short-term trend reversal within a long-term bullish channel, driven by liquidity sweep behavior and a confirmed Head & Shoulders breakdown.
Disclaimer: As part of ThinkMarkets’ Influencer Program, I am sponsored to share and publish their charts in my analysis.
DXY I Monthly CLS range - Model 1- TP discount LQHi friends, new range created. As always we are looking for the manipulation in to the key level around the range. Don't forget confirmation switch from manipulation phase to the distribution phase to make the setup valid. Stay patient and enter only after change in order flow. If price reaches 50% of the range take partial or full close.
🧩 Complete proces and Strategy explained 👇 Click Below
👊 Your ultimate goal as a trader is not to be a generalist who knows 10 000 patterns. But rather create one system with narrowed criteria of each element of the trade to remove subjective and emotional decisions as much as possible and stick to this system no matter what. Practice it 10 000 times become a MASTER.
✨ Trading Mastery is reflection of your life
Have a longterm plan, No Alcohol & Drugs, Ignore others, Focus on your journey , Backtest regularly, Review your weeks, Journal mistakes, Exercise, Sleep well, Read books, Walks in nature (no phone) , Meditate, Reduce social media time, Spend time with family, Live Life.
Trading is hard, but not impossible. I believe in you 💪
David Perk aka Dave Fx Hunter

AUDUSDThe AUDUSD chart shows an upward-sloping trendline indicating that the market has been in an uptrend, with higher highs and higher lows since around the 20th of November. This trendline suggests that price action is generally bullish, and this upward movement has been sustained for a period of time.
The price is currently near the level of 101.800, just below 102.000, which has been a key resistance zone the shaded region in light gray, located above the current price, represents a potential resistance zone. This is a level where price may struggle to break above, creating an opportunity for short trades if price fails to push higher The green shaded area below the current price level (around 101.600) indicates a potential area of support. If price begins to fall, this region could act as a point where price may bounce or stall before moving lower.
The chart suggests that there may be a bearish scenario developing. From the current price of around 101.800, the analysis shows a possible move down to 101.600 (and possibly lower) in the near future. This move is marked by the downward arrow and target area shown on the right side of the chart The target for this downward move is set around 100.516, which would represent a significant drop from the current price level. If the market follows through with the anticipated bearish movement, traders might expect the price to reach this area before finding another level of support.
As the trade anticipates price movement to the downside, the trader may place a stop loss slightly above the resistance level (above 102.000), allowing the trade to be protected if the market doesn't follow through on the bearish bias The chart is set on a 1-hour time frame, meaning the trader expects this move to unfold within a relatively short period, potentially within the next few days. This type of chart analysis is useful for short-term traders, such as scalpers or day traders.
The chart also includes specific symbols at the bottom, which could represent certain events or alerts for the trader. The purple circle indicates a potential news event, while the red circle likely represents a trade setup or entry signal. The use of these symbols shows that the trader is closely monitoring events that could impact the market.
Overall, the trader's analysis suggests that the market has reached a point of resistance at around the 102.000 level. If the market fails to break above this resistance, a downward move to the support zone near 101.600 is expected. From there, the trader anticipates further downside movement toward the 100.516 region, providing a potentially profitable trade setup.
If You find it helpful please like and comments for this post and share thanks.

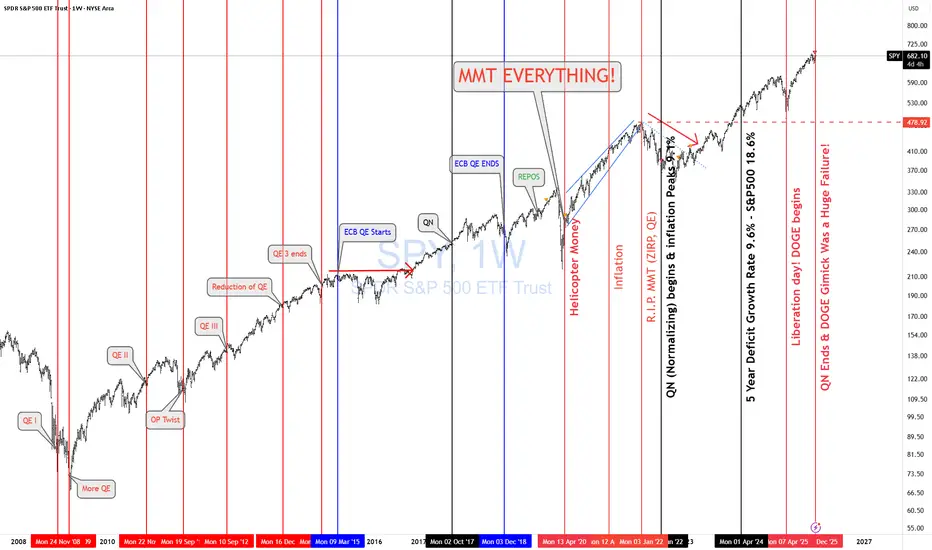
SPY & Macro HistoricalToday FED ended QN (Quantitative Normalizing NOT "T" = tightening. 1st, you normalize, then you tighten. Right??)
The Fed is continuing to let mortgage-backed securities roll off its balance sheet, while the U.S. Treasury increases T-bill issuance (cash-like instruments). That combination means more gov securities are hitting the market even as the Fed’s balance sheet stays roughly unchanged.
More Treasury supply + no Fed buying = higher yields and tighter liquidity. More MBS roll-off = higher mortgage rates and pressure on housing. Treasury bills soak up cash, while longer bonds suffer.
🔥 REALMACRO summary:
The Fed is doing this to:
Get out of the mortgage market.
Strengthen the Treasury bill market (the foundation of dollar liquidity).
Keep bank reserves “ample” without restarting QE.
This combo lets them tighten just enough to cool asset prices, without breaking the plumbing again like in 2019.
The success of this experiment will largely determine how long the Fed can avoid returning to QE. If liquidity tightens too far as the economy continues to weaken, they’ll be forced back into some form of balance sheet expansion sooner rather than later.
Lastly, let's check how right I was when I posted "MMT Everything."
As of April 2020, US debt was $ 24T. Today, it is $38T, representing a total increase of $14T in 5 years.
✅ CAGR ≈ 9.6% per year
✅ S&P 500 CAGR (Apr 2020 → Today): ~18.6% per year
Both are completely unsustainable growth rates.
I nailed that back in April 2020. Trump & MMT "print and play" will be the death of us! SIGH!
Lastly, the DOGE gimmick was a complete and total failure as expected. No reduction in deficit and no fraud found. Imagine that!
As I keep saying, " NEVER INVEST IN TOXIC PEOPLE! THEY WILL ALWAYS BURN YOU IN THE END!" It's not political it's a FACT!
THANK YOU for getting me to 5,000 followers! 🙏🔥
Let’s keep climbing.
If you enjoy the work:
👉 Drop a solid comment
Let’s push it to 6,000 and keep building a community grounded in truth, not hype.
Why USD is a forex King !USD continues to show why it’s considered the king of the forex market—its strength sets the tone across major pairs. I’m watching how its momentum influences broader market structure

Bitcoin Only after breakout chanel resistance bull market again Soon we can expect price broke above channel resistance now it is near 93K$ and after that market will face huge gain only.
Step 1: Confirm the Breakout (The "Is It Real?" Check)
Don't buy the first tiny wick above the line. Wait for confirmation to avoid a false breakout:
Daily Close: Wait for a daily candle close (UTC) decisively above the $93K trendline.
Volume Surge: The breakout should be accompanied by significantly higher buying volume than average . This shows conviction.
Follow-Through: The price should hold above the trendline and not immediately fall back in.
Step 2: The Trade Entry Strategy
Aggressive Entry: Buy on the first strong 4-hour or daily close above $93K.
Conservative Entry : Wait for a "retest" of the broken trendline. After breaking out, price often pulls back to touch the former resistance, which should now act as new support. This is a higher-probability, lower-risk entry.
Step 3: MY Bullish Targets - A Realistic Roadmap
my targets are logical and align with measured moves and previous all-time high extensions.
First Target: ~$110,000
This is the first major psychological barrier and would represent a strong resumption of the bull market.
Second Target: ~$120,000 - $125,000
This area is a common 1.618 Fibonacci extension from key swing points and represents the next significant resistance zone.
Extended Target: ~$140,000+
This is the "blue sky" target that comes into play if the bullish momentum becomes parabolic, likely fueled by a FOMO (Fear Of Missing Out) influx of new capital.
DISCLAIMER: ((trade based on your own decision))
<<press like👍 if you enjoy💚

Bitcoin Bitcoin highlighting recent price movement, supply–demand zones, trend structure, and potential trade planning.
Recently, Bitcoin experienced a sharp drop from the upper zone near 90K, breaking below the rising trendline and entering a corrective phase. After this strong bearish candle, price fell into a lower demand zone, where buyers stepped in again. This created a temporary support area around 84K – 82K
Resistance Zone: Around 90K – 92K shown in the red area. This is the region where sellers previously dominated and pushed the price down Bitcoin is now trading around $87,300–$88,000, where price is retesting a previous breakdown area. This zone acts as both resistance and a decision point.
If You find it helpful please like and comments for this post and share thanks.

EURUSD False reject from resistance looks Bearish TrendEURUSD is showing signs of renewed bearish momentum after retesting the resistance zone. The pair has rejected this area multiple times, indicating weakness and a loss of bullish momentum.
Technically, even though price previously broke upward from a symmetrical consolidation pattern, it is now struggling to hold those gains. The repeated rejections from resistance suggest buyers are losing strength, increasing the likelihood of a corrective move to the downside.
If bearish pressure continues, price may extend lower toward the next key support zone around 1.15500 – 1.15210.
You may find more details in the chart,
Trade wisely best of Luck Buddies.
Ps; Support with like and comments for better analysis thanks for Supporting.

NEARUSDT - Catch the Bottom!NEAR is pumping hard right now — honestly I really like its price action.
Remember the post where I explained how to enter a successful futures setup?
I’ll attach it below for you, take a look at it.
NEAR is showing the same pattern from the Ceciliones futures methodology :
-It’s a strong coin with a solid market cap.
-It formed a bearish pattern and is giving a bearish signal suggesting a drop.
-A lot of traders are hunting for the “perfect” short entry.
-Almost everyone who was long either closed or got liquidity-grabbed.
-Spot holders got hit hard and exited with losses.
This creates the perfect environment for an upside move — remember what I’m telling you.
Add it to your watchlist: the coin is currently at the bottom, fear levels are at their peak, and that’s exactly the kind of environment that fuels a bull run.
Keep your eye on NEAR — you won’t regret it.
Best Regards:
Ceciliones🎯

USNAS100 consolidating within a bearish trendThe USNAS100 is currently consolidating within a bearish trend. Wall Street’s main indexes are expected to open lower on Monday as investors move to the sidelines ahead of key economic data and a closely watched speech from Federal Reserve Chair Jerome Powell. Markets are looking for clues regarding the Fed’s policy direction later this month.
From a technical perspective, US100 remains vulnerable to further downside If price closes below 24,990 and holds beneath this level, bearish momentum is likely to continue. In that scenario, the next support zones lie at: 24,800 TO 24,200
You may find more details in the chart.
Trade wisely best of luck buddies.
Ps; Support with like and comments for better analysis Thanks for supporting.

Bullish Analysis 15M-Gold Breakdown – XAU/USD
✨ Clean structure, institutional narrative, and a clear bullish roadmap.
🔹 1. Bearish Liquidity Mitigation (Sell-Side Liquidity)
The market completed its job by sweeping all sell-side liquidity below previous lows 🟠.
This provides the fuel institutions need to build long positions at discount levels. 🔥
🔹 2. Institutional Reversal from the POI
After the liquidity grab, price taps your POI at 4,190 and shows a sharp rejection 🔁.
This is a strong indication of bullish institutional intent. ✔️
🔹 3. Fake Out + Bullish BOS
The fake out was used to trap late sellers ❌ while big players loaded longs.
The following bullish BOS confirms the shift in character and trend direction. 📈
🔹 4. Projected Path Toward Buy-Side Liquidity
Price is now targeting upside liquidity and higher-timeframe inefficiencies. 🎯
🎯 Institutional Targets (TPs)
• TP1 – 4,230: internal liquidity sweep 💧
• TP2 – 4,254: FVG mitigation ⚡
• TP3 – 4,277: continuation of bullish impulse 📊
• TP4 – 4,300: major liquidity grab / expected HH 🏆

SOL Near Inflection PointCRYPTOCAP:SOL is holding well above the mid S/R zone and showing solid strength. If it continues to rebound from this area, price could push back toward the upper resistance.
But if SOL breaks below this zone, it may slide down toward the $80 levels.
DYOR, NFA
Please hit the like button if you like it, and share your views in the comments section.

The MicroStrategy Bitcoin Bottom!Today MicroStrategy formed a beautiful daily chart bottoming tail on extreme volume.
Its truly a picture perfect reversal signal.
This reversal came on the back of BTC being very weak and still down 5% at market close.
Michael Saylor announced an addition of a 130BTC purchase, but also has set aside a billion dollar expense fund if he needed to sell some BTC.
The likely hood of MSTR having to sell BTC is very unlikely.
We traded MSTR today for a lovely gain. Riding 180 calls to the upside.

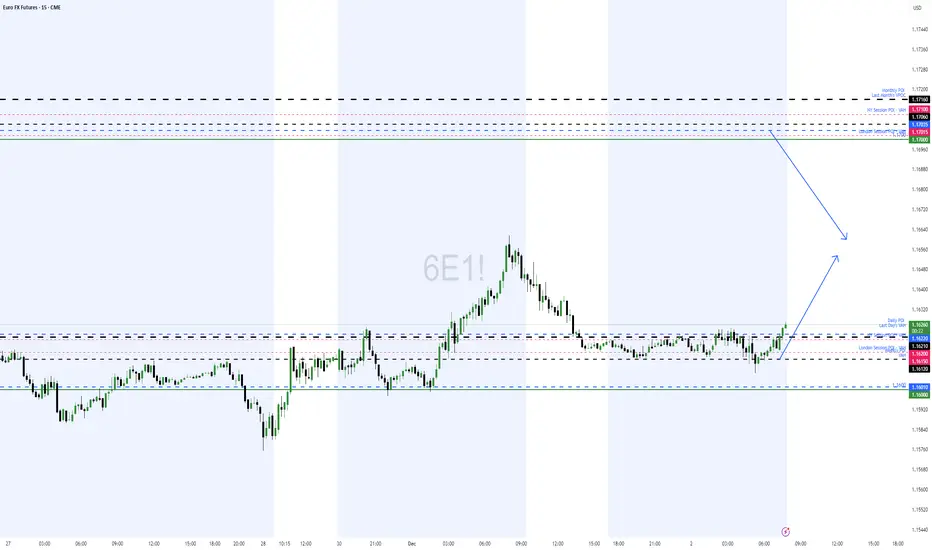
Value Suggest 6e is cheap. Looking at the monthly Vol profile o euro i see 1.162 as a key level to buy and price can be bought and sold at 1.175. but everything comes down to orderflow and what the buyers think.
It can be correct more then 80%again ??Every three to four years BTC fall more then 80% now it can be???

EURUSDHello Traders! 👋
What are your thoughts on EURUSD?
EUR/USD has broken its descending trendline and has now completed a clean pullback to the broken level. Price is currently trading just below a resistance zone.
Given the current market structure, we expect this resistance area to break during the next bullish leg.
A confirmed breakout above this zone would open the path toward the next upside targets and validate further bullish continuation.
Don’t forget to like and share your thoughts in the comments! ❤️

S&P500 Idea FOMCBias until Dec FOMC:
We will be looking to continue to ride the Fed rate cuts odds increased on the markets as that is still holding most weight at the moment and will most likely continue to do so until the FOMC decision on 11 December.
The markets have been primarily pricing in the rate cut expectations 30 days well before the actual FOMC decision, there during the actual Rate decision release, we barely get any impact and we get markets repositioning for any future guidance to come. Basically a case of ‘Buy the rumour and Sell the news’’ play.
- Because at the moment, we have been seeing rate cut probabilities increasing to 85% which has been holding most weight for Gold upside and giving the greedy intuitions a reason to further buy up risk assets.
However,
- This doesn't mean that Dec is a guaranteed rate cut, and during the December FOMC, the fed may either cut rates by 25bps or Hold rates, and if there future guidance remarks are hawkish since inflation is still elevated - then we can see Profit taking on risk assets. Therefor expect to see Gold bears, DXY bulls, BTC Bears, Stock bears.
So until the actual December FOMC, If December Rate cut probabilities are still elevated (80%+), then, we can still expect Buyers in control on Risk assets, so:
- DXY - Downside.
- GOLD - Upside , potentially retest upto previous ATH’s $4380’s. Then Profit taking post FOMC.
- US Stocks - Upside on SPX to make New ATH’s and bearish wave if Dec FOMC hawkish.
- BTC - Upside to 100k, prev supply zone before Correction bearish phase.
BTC USDHI GUYS,
A Friend has shared with me the most accurate trade path and detail on current situation as newly illustrated above believe me i feel soo bad that i got it very late in the middle of the week.
u can imagine if only i got it earlier i would have made wonderful trade on sniper entries any way, lets see how long it will lasts.
NOTE
HISTORICAL PATH AND DETAIL ALWAYS WORKS IF U FIND THE ACCURATE SCRIPT , however it is not as easy as me posting almost every day. one has to go through vast amount of historical data to find and make the impossible possible.
A lot of information is on the internet about historical data not always accurate or reliable and they are correct however what they do not explain is that history time jumps and since its not easy to find it in one place then it requires a lot of math on technical analysis.
u can make trades with no loss or almost no loss however u need a team of professionals if not u need alot of experience using different Technics to make better and legit entries.
i post mistakes. i make corrections, i share my ideas on entries and i store my information on trading view for research purposes to make future better trades

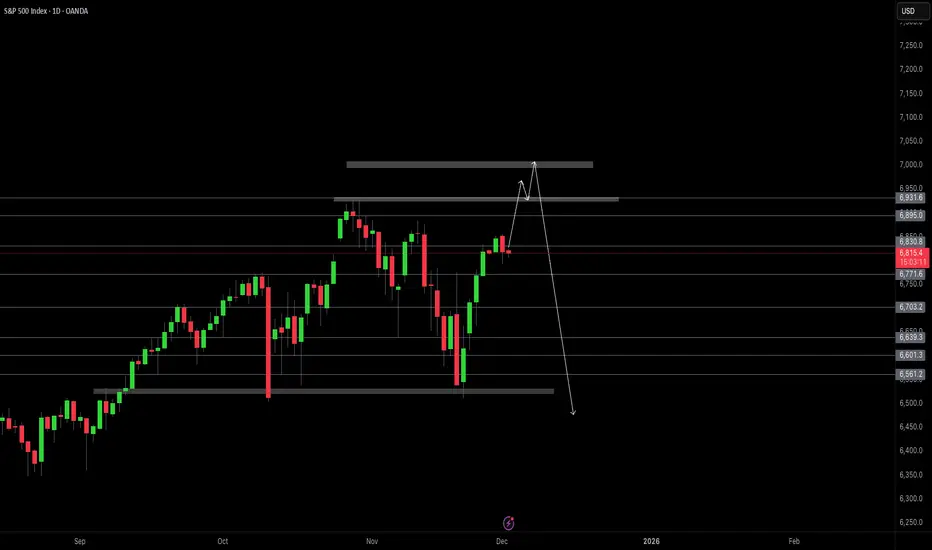
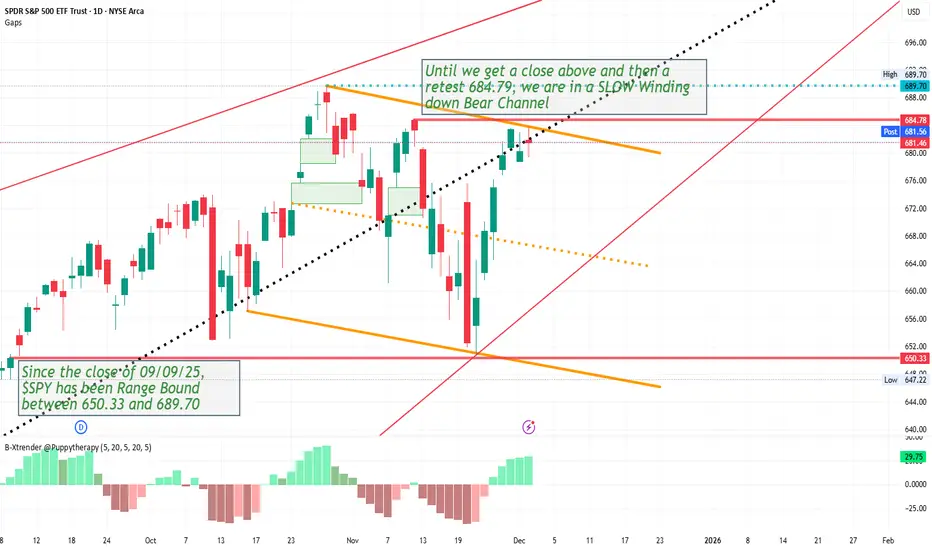
$SPY has been Range Bound going on 3 months... Teeter Tottering!This is what I'm seeing when looking at the Daily Chart of AMEX:SPY
I'll leave it up to the experts and professionals regarding price predictions... I just like to follow the price action. As you can see, since 9/9 AMEX:SPY has been stuck teeter tottering between the close of 9/9 and the ATH of 10/29... I believe AMEX:SPY started its' BEAR CYCLE on 10/29 and has slowly played with both Bulls and Bears emotions. Let's see if the "Santa Rally" is real and $ AMEX:SPY can breakthrough to ATHs or if my eyes are truly seeing a Bear Channel.
Again, no professional here... DO NOT TAKE FINANCIAL ADVISE from me or anyone else for that matter! Do Your Own Research and make Your Choices based off your conviction!
Good luck to all of you Bulls and Bears!!!
How to Build a Consistent Execution Checklist on TradingViewMost trading mistakes don’t come from bad strategy, they come from inconsistent execution.
An execution checklist removes guesswork and replaces it with structure.
When your actions follow a routine, your results stabilize.
TradingView gives you everything you need to build a checklist that stays visible, actionable, and tied directly to your chart.
1. Define Your Core Conditions
Before any trade, the bigger picture must be clear.
Start your checklist by answering three questions:
What is the higher-timeframe direction
Where is price relative to key levels
Is price approaching with strength or weakness
Use TradingView’s drawing tools to mark support, resistance, value zones, and session highs and lows.
Add a simple text note on the chart listing your core conditions so they are always visible.
If the market context fails this first screen, the trade is already invalid.
2. Build Confirmation Criteria
Once structure is confirmed, you move to evidence.
Mark confirmation areas directly on your chart:
Liquidity pools
Fair value zones or imbalances
Previous session highs and lows
Asian range or New York open
If your strategy uses indicators, document exact conditions:
Moving average position and slope
Volume behavior
VWAP location
Volatility expansion or contraction
Define rules that don’t change based on emotion.
Confirmation should prove your bias, not justify your urge to trade.
3. Validate Risk Before Execution
Every setup must survive a risk checkpoint before it’s allowed to go live.
Your checklist must answer:
Where is my invalidation level
How much capital am I risking
Does this violate any daily limits
Is the reward worth the risk
Use TradingView’s long or short position tool to visualize risk directly on the chart.
Save it as a template so your risk process stays uniform across all trades.
No trade is valid if risk isn’t clean.
4. Create a Pre-Execution Routine
A checklist only works if you actually follow it.
Add a short pre-trade process directly to your chart notes using checkboxes or bullet points:
Example execution checklist:
Market phase confirmed
Level identified
Confirmation present
Risk valid
Entry condition active
Walk through this list before clicking buy or sell.
If one item fails, the trade fails.
Over time, this routine removes emotional impulse completely.
5. Review and Refine Weekly
Your checklist isn’t static, it evolves.
Every week ask:
Where did I break my rules
What conditions led to losses
Which confirmations work best
What rules saved me from bad trades
Use TradingView’s trade replay and journaling features to review execution quality, not just profit.
Consistency improves when your system evolves with you.
Final Thought
A checklist doesn’t restrict your trading, it frees you from emotion.
When your process is clear, your confidence increases.
When your confidence increases, discipline follows.
Good traders make decisions.
Great traders execute procedures.
Stay Green!