1. Current Market Structure
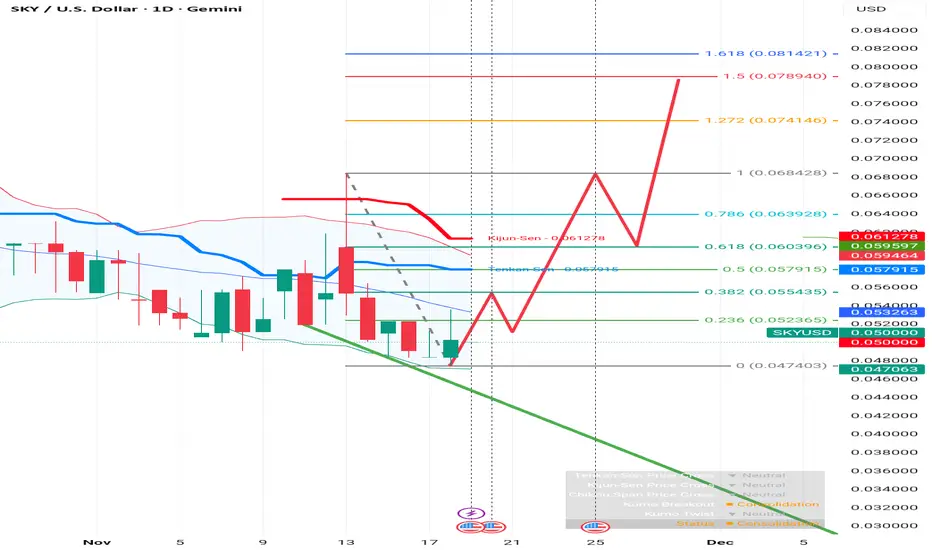
Trend: The asset has been in a downtrend, evidenced by the lower highs and lower lows over the past few weeks. The price is currently trading around $0.0500.
Support Zone: The price recently found a floor at the 0.0474 level (marked as the 0 Fibonacci level). The current price action suggests a period of consolidation or a potential bottoming formation.
Indicators:
Ichimoku Elements: The price is currently below the Tenkan-Sen ($0.0579) and Kijun-Sen ($0.0612) lines. In Ichimoku theory, price below these lines typically indicates bearish momentum, meaning the price needs to cross above them to confirm a reversal.
Bollinger Bands: The bands appear to be narrowing slightly, which often precedes a period of high volatility (a breakout or breakdown).
2. The "Red Line" Projection
The red hand-drawn line on your chart represents a classic Reversal Scenario, specifically resembling a Double Bottom or a complex Inverse Head and Shoulders pattern. Here is the breakdown of that prediction:
Phase 1: The Retest (Current to Short Term) The projection anticipates the price might dip slightly one more time to retest the recent low near $0.0474. This would create the second "leg" of a "W" pattern (Double Bottom), confirming strong support at that level.
Phase 2: The Breakout After the retest, the projection predicts a sharp rally upward, breaking past the initial resistance at the 0.236 Fib ($0.0523) and the 0.382 Fib ($0.0554).
Phase 3: The Golden Ratio Challenge The rally is expected to pause or face resistance at the 0.618 Fib level ($0.0603). In technical analysis, this is often called the "Golden Pocket." A rejection here is common, hence the small dip drawn in the red line before the continuation.
Phase 4: The Extension (Target) The final leg of the drawing predicts a massive breakout to the 1.618 Fibonacci Extension at $0.0814.
3. Key Technical Levels to Watch
Critical Support 0.0474 The recent low. If the price breaks below this, the bullish projection is invalidated, and the price could seek lower lows.
Resistance 1 0.0579 Tenkan-Sen / 0.5 Fib. A crucial mid-point resistance.
Resistance 2 0.0612 Kijun-Sen / 0.618 Fib. This is the "trend flipper." Breaking this confirms a bullish trend reversal.
Target 0.0814 1.618 Extension. The ultimate profit target based on this specific Fib setup.
4. Summary
The market is currently bearish, but the drawing is betting on a bottom formation.
Bullish Signal: Watch for a daily candle close above $0.053 (the blue Moving Average line). This would start to validate the upward move. Bearish Signal: A daily close below $0.0470 would invalidate the support and likely lead to a further drop.
Disclaimer
The information and publications are not meant to be, and do not constitute, financial, investment, trading, or other types of advice or recommendations supplied or endorsed by TradingView. Read more in the Terms of Use.
Disclaimer
The information and publications are not meant to be, and do not constitute, financial, investment, trading, or other types of advice or recommendations supplied or endorsed by TradingView. Read more in the Terms of Use.